-

Main page
-

Informational section
-

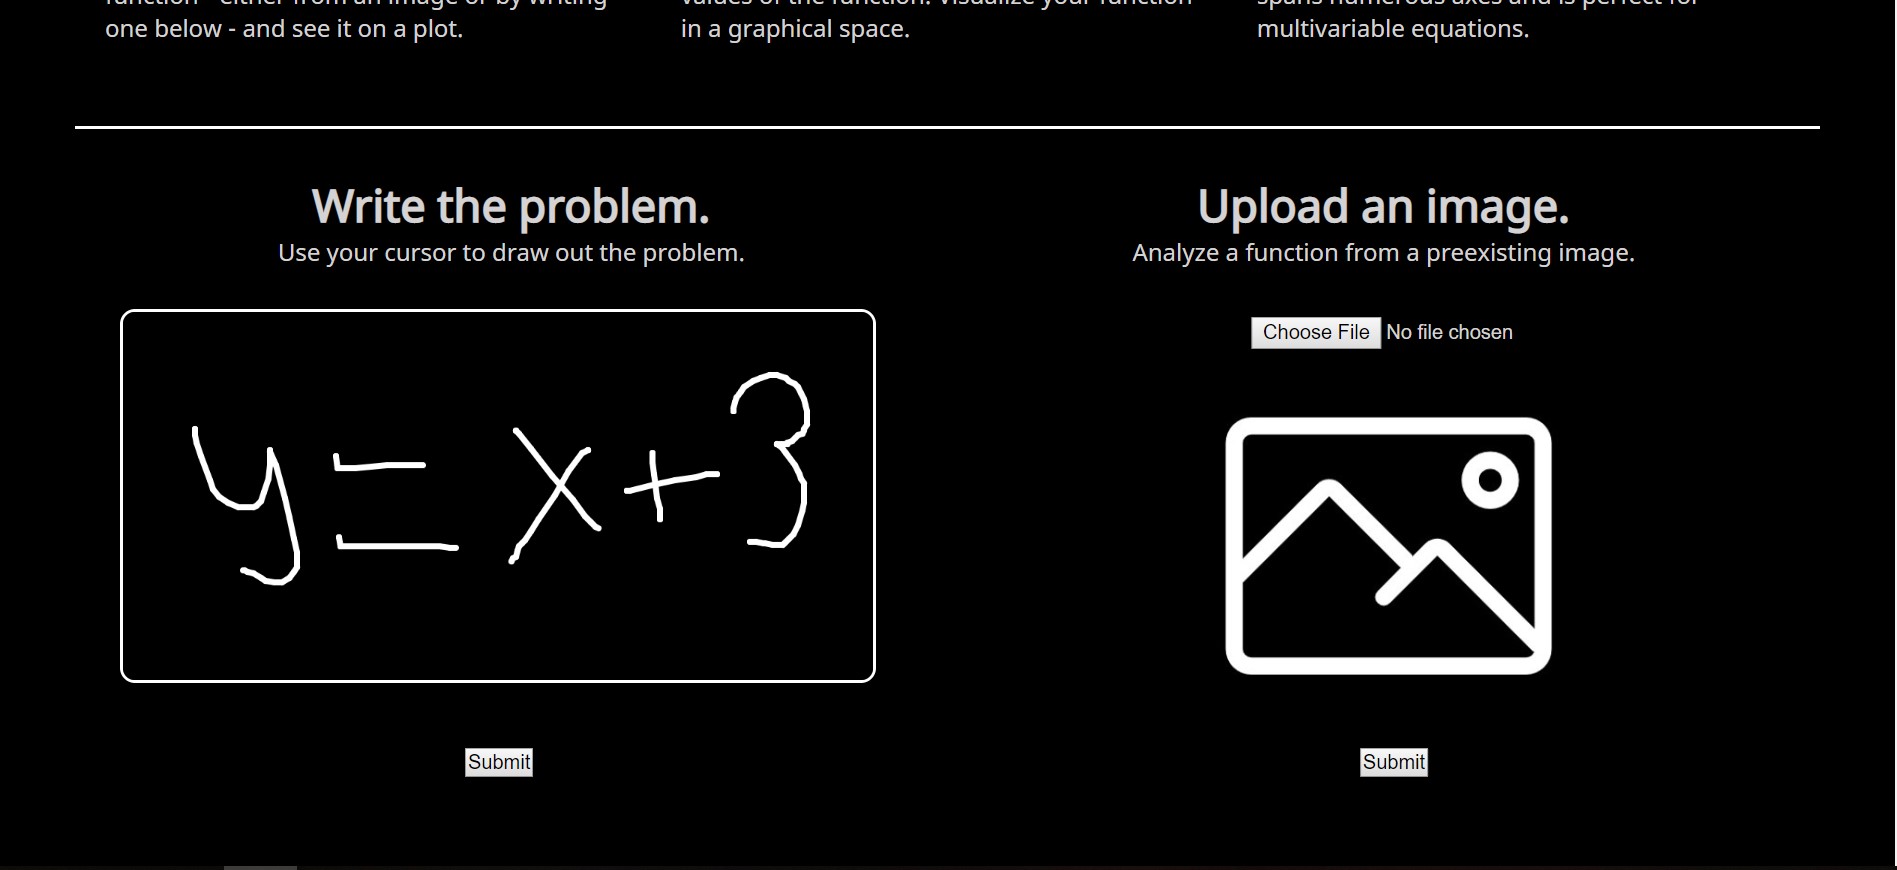
Upload for image processing
-

Results Page, Part 1
-

Results Page, Part 2
-

Processing Example, Part 1
-

Processing Example, Part 2
-

Processing Example, Part 3


Inspiration
Our interest in pursuing higher mathematics courses led us to enroll in advanced calculus classes at our local community college. While working on assignments and furthering our knowledge of the subject area, we realized that graphing software used by a substantial portion of enrolled students is exorbitantly priced or largely inaccessible. Consequently, we decided to build a software that could be used by students who wanted to graph 2-dimensional functions on the xy plane and 3-dimensional functions on the x, y, and z axes. Additionally, we aimed to implement calculator software to derive key values, such as extrema, limits, values at specific inputted points, and intercepts.
What it does
Compass intakes handwritten images through either a manual upload of an image that has a function written on it, either handwritten or printed, or allows the user to write the function on a JavaScript canvas included on the website by using a cursor. The image is then processed through Google's Cloud API which converts text within image to separate functions. This function is then analyzed using Wolfram's API to isolate key values, including extrema, limits, and other indicative values through processes like integration. This information is displayed on a results page along with the 3-D graph of the function on an xyz plane as well as with a solid model.
How we built it
We approached the majority of data analysis using Python and used this language to transfer data from our code to varying APIs, including Google's Cloud and Wolfram API. We also used PHP to transfer user data and used JavaScript to enable the handwritten canvas portion. The bulk of the website that we built was made of HTML and CSS. To understand the varying relationships between functions and editable graphs, we also studied the Desmos API, but decided against implementing it in our final models. Prior to building out the final version of our website, we also analyzed the MNIST dataset, a dataset consisting of tens of thousands of handwritten characters, and constructed a model that could differentiate between the varying digits. This was completed using Python and Jupyter Notebooks and served as a seamless introduction into the relationship between machine learning and image processing as they related to user input.
Challenges we ran into
We initially experienced trouble installing tools and transferring data among the various APIs and programs that we implemented in our software. We resolved these challenges by shifting our attention to APIs that were more conducive to our product and could be used among a host of plotting and calculation programs. Additionally, while converting user input to data that could be processed by the remainder of our program, we experienced difficulties integrating various languages at the same time, such as with JavaScript and PHP. By scouring online documentation and consulting previous forums, we were able to identify the functions necessary for our software and implemented them accordingly.
Accomplishments that we're proud of
While searching for website backgrounds, we stumbled upon a minimalist image of two compasses. From this simple source sprouted our product name, Compass, representing the math instrument and the tool of journeymen on their quest to succeed, accompanied by a simple black and white theme.
Instead of hosting our application locally, we used a cloud computing service in order to run our code 24/7. Using buckets, event functions, and the cloud engine, requests are processed and sent between each other. Through the Google Cloud services APIs, we used the Google Cloud Vision API to process incoming images as text so that they can be sent to other APIs for display, such as with the Wolfram Alpha API.
What we learned
Through transferring data across multiple platforms and implementing the varying functionalities of cloud-based APIs, we learned to harness our backgrounds in computer science while also building upon our existing knowledge by using online documentation. For instance, we applied our backgrounds in Python when working with other programming languages, especially as we transferred data across sources while using niche APIs.
What's next for Compass
Compass's use cases can be expanded into more advanced math scenarios, such as triple integrals, polar functions, and differential equations. A mobile app would allow for problems to be inputted more seamlessly and just as quick through cloud computing. As our website allows the user to draw their problem on the website, we could also implement this functionality on the mobile app and expand input sources to taking live images. One of our early ideas was to use augmented reality (AR) to visualize multiple graphs simultaneously so that the user can have a comprehensive understanding of 3-dimensional plots.

Log in or sign up for Devpost to join the conversation.