-
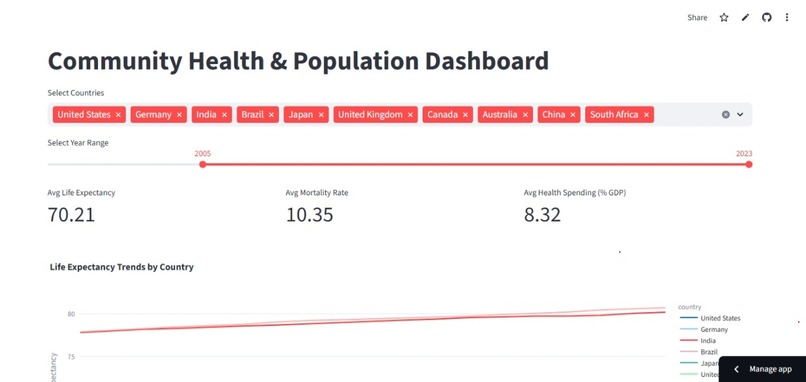
This is a screened picture showing the dashboard
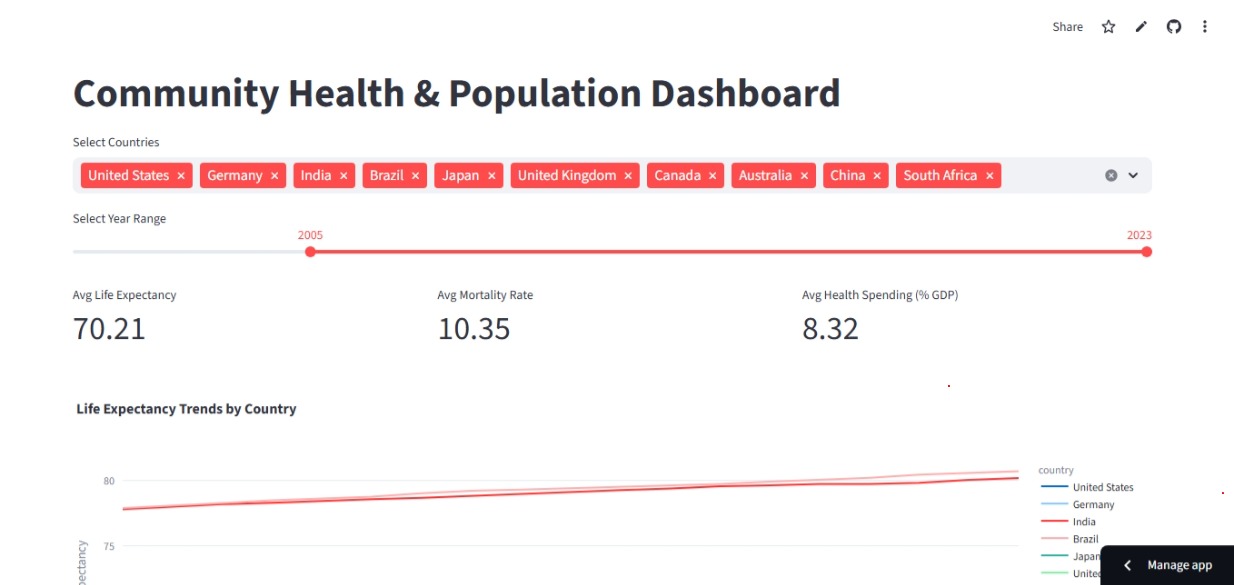
Community Health & Population Dashboard
Developer: DAVID KENEDY EMMANUEL
Project Overview
This project presents an interactive dashboard that visualizes community health and population indicators to support data-driven decision making in public health planning.
This project includes:
- Data cleaning & feature engineering with Pandas
- Exploratory data analysis with Matplotlib & Plotly
- Data storytelling notebooks
- Interactive dashboard built with Streamlit
Live Demo
Experience the interactive dashboard live here:
🌐 Open Dashboard
Key Features
- Select multiple countries and year ranges
- View key metrics: life expectancy, mortality rate, health expenditure
- Explore trends over time and visualize relationships ## Tools & Technologies -Python -Pandas -Matplotlib -Dashboard framework(streamlit) -Github
How to Run
-Clone the repository -install requirements -Run the dashboard script
Results
-The dashboard provides clear insights into population-health relationships useful for community health plamnning.

Log in or sign up for Devpost to join the conversation.