-
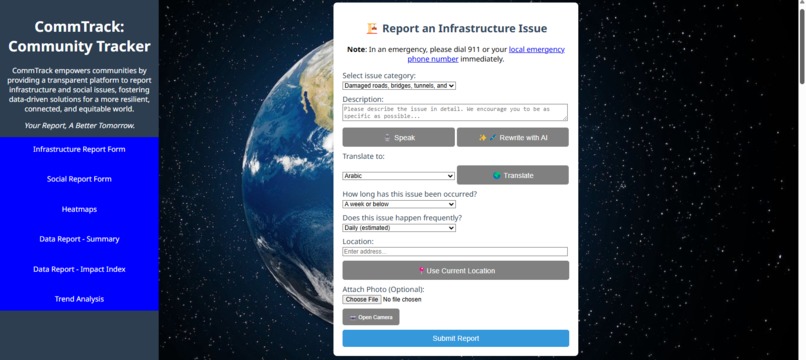
CommTrack Website Screen

Inspiration
Citizens' complaints about various infrastructure issues, such as roads, bridges, buildings, tunnels, technology, power failures, water disruption, etc., and social issues like racism, unemployment, crime, education issues, and corruption, were not always heard by governmental and non-governmental organisations that are responsible for these issues and fix them promptly. I also think that several indexes that categorise countries based on various factors like the Economist Democracy Index (EDI), Human Development Index (HDI), and Corruptions Perception Index (CPI) published by large organizations can have a little to some biases in favour or against some countries.
I want to create a platform where people/citizens can voice their opinions on infrastructure/social issues based on our experience, and a platform where citizens and governmental/non-governmental organizations worldwide interact and work together to fix real-world issues. By working together, we can achieve resilient infrastructure, promote inclusive and sustainable industrialisation and foster innovation, per (UN SDG 9: INDUSTRY, INNOVATION, AND INFRASTRUCTURE), and sustainable cities and communities (UN SDG 11: SUSTAINABLE CITIES AND COMMUNITIES). Introducing CommTrack.
What it does
Users will fill out one of two, or both forms, Infrastructure Issue Report and/or Social Issues Report. They will fill in all of the required information.
For each form, users are recommended (may be required in the future) to write the full description of the issues they encountered, faced, or observed. Based on the description on each form, issues can be automatically categorised into a distinct category that matches the description the most (or general categories like "Others"). If the description is too long, users can also rewrite it with AI so that their description is concise and easier to follow. Furthermore, their description can be translated into various languages (the default language is English, but I can make more adjustments and add more features so that users can type in any other language and translate to more languages in the future). To back up as proof of their reports, users also have the option to choose to take/upload pictures from the laptop/desktop/phone camera. If users face any difficulties when typing out the descriptions, there is also an option where users can record their voices and their voices will be processed into words and entered into the description box. To encounter fake/spam reports, a word filter feature has also been implemented.
After submitting each report, the form will record it into the data table of the sum of reports received, categorised by country. The reports from citizens are also taken into account to calculate the Community Infrastructure and Social Impact Index, also categorised by country. The more issues reported, the lower the index scores for each country. There is also a trend analysis that analyses the growth of issues reported using Chart.js by a specific time interval (last minute, hourly, daily, monthly, yearly, etc.)
How I built it
- The web interfaces are designed using pure HTML and CSS. I initially started programming the basic prototype for the web, creating the basic forms for users to fill out and submit.
- Most features in CommTrack including fetching submitted reports, loading heatmaps, fetching APIs for maps, translation, camera, voice input, geographical locations, fetching report data, and visualizing data are programmed in JavaScript.
- The backend for translation, storing reports categorised by country and year, analysing and visualising trends of reports by country and time interval, calculating the number of reports and community infrastructure and social impact index (CIII, CSII), and summarising reports and filtering out spam/bad words are programmed in Python.
- The backend and front-end communicate and exchange data using Flask, a Python microweb framework.
- I used Chart.JS to visualize the trends of reports using a basic chart.
- I used TensorFlow.JS to implement the "categorising issues using AI" feature. For each category, I added as many possible keywords that best describe it. For example, if the keywords are ["pothole", "bridge", "tunnel", "road damage", "crack", "highway", "corrugations", "rut", "ravel", "frost", "upheaval", "fatigue"], the description can be categorised into "damaged roads/buildings" category in the infrastructure issue report form. TensorFlow.JS will analyse the description and look for specific keywords to categorise the report into a category. This feature is not perfect. If the keyword is not notable or well-known, the report can be best categorised into "Others".
- I used the deep learning Transformer architecture to summarise a user's issue description to make it clear, concise, and convincing. The model I used is Facebook/bart-large-cnn. It requires a minimum length of 20 characters to summarise. I also used Transformer to detect bad keywords in the reports and prevent users from submitting reports that are filled with bad/vulgar/offensive words, making sure the reports are credible and of high quality.
- APIs used: OpenStreetMap to fetch the list of all countries and location addresses on Earth for each respective form, GeoNames to fetch the states/regions/provinces for each country, Open Layers Map to display two global heatmaps (one for infrastructure and one for social report) and visualize data on maps, and Google Cloud Translate to translate the report description to other languages.
Challenges I ran into
- This is the first time I built a large-scale website that uses many complex (but helpful features) and monitors much data. To test each feature independently took a long time.
- This is also the first time I got hands-on experience in using external REST APIs. It was difficult to retrieve access code, access token, or API keys (I had to go through many complex steps), and encrypt them for security purposes and manage data and traffic flow for the APIs (OpenStreetMap, Open Layers Map, Google Cloud Translate, Nominatim, etc.) For the heatmaps, I initially used Google Maps API, but turned out it was difficult and time-consuming to figure out ways to hide my API key from the public for security purposes so I chose Open Layers Map instead. But later, for the Google Cloud Translate API, I figured out ways to encrypt/hide my API key by storing it in a .env file, configuring it to make Git ignore it, and fetching the API key from other code files.
- The first time I used AI Transformer architecture for the "summarising/rewriting" feature and filtering out bad words. This architecture can be very slow and time-consuming due to its large amount of data so it could take seconds longer to process. Initially, I intended to use OpenAI instead of Hugging Face Transformer since it could be faster and more optimised for all AI features but it could be very costly to use.
- The Flask CORS issues occurred frequently. APIs constantly block local/URL requests. I went back and constantly fixed/configured these errors to make sure that data requests were handled properly.
- Other syntax/logic errors like "Cannot set the property of NULL..." For each function/feature, I included a debugging statement to be printed to the console when I tested my website so that I could locate errors more easily.
Accomplishments that I am proud of
- Every report is submitted and processed successfully.
- The trend analysis chart is visualized accurately in terms of time, allowing users to see and analyse the growth of issues in a particular country (even though this visualization may not always be perfect).
- The data report (in table form) like the total of reports, categorised by each country and ranked from the country with the most to least issues reported, are displayed and calculated properly. The Community Infrastructure and Social Impact Index are calculated for the most part, accurately.
- The heatmaps are visualized accurately, allowing users to properly see and determine which location is highly endangered/at risk in terms of infrastructure or social issues.
- The AI features work properly. For the most part, every description written by users is categorised correctly based on the keywords. Spam reports or reports that contain offensive/vulgar words are prohibited from submission. Users also have the option to translate their report from English to other foreign languages like Chinese, Korean, Japanese, Spanish, Vietnamese, etc. The translations from Google Cloud Translate API work properly and accurately.
- I enhanced my website to make it responsive and interactive across most technology devices like phones, tablets, computers,...
What I learned
- I got hands-on experience in navigating through and using APIs for the first time.
- I got hands-on experience in using AI/ML/Deep Learning architectures like TensorFlow.JS and Hugging Face Transformer. I also learned more about the Natural Language Processing concept of AI by utilising these architectures to summarize reports, categorize issues, and filter words on my website.
- I got to build a fully functional, large-scale website.
- I learned to develop a large-scale website following the incremental process model, by breaking my website down into smaller and manageable parts, integrating, developing, testing, and enhancing each feature one by one sequentially.
What's next for CommTrack
These are the features that I may implement for CommTrack in the future:
- Enhance both infrastructure and social forms to ask users for more information (but not any sensitive information) to enhance the quality/accuracy of reports.
- CAPTCHA or user verification (phone/email) to prevent bot submissions.
- Real-time alerts from weather APIs, earthquake monitoring, road condition, and infrastructure condition analysis/maps using public APIs like OpenWeatherMap, USGS Earthquake API, New Relic, or local government feeds.
- Features for users to comment, upvote/downvote issues, and suggest solutions to infrastructure issues (make CommTrack like a social media for discussing real-world infrastructure/social issues,... and coming up with solutions to mitigate them.
- Allow users to use the website offline, as many people in rural areas, or poor countries may lack stable internet access.
- Provide data analysis for reported issues from each city/state/region/province of each country, and also each categorised issue.
- Use an ML model like linear regression or time-series forecasting to predict potential infrastructure or social issues based on historical trends.
- Provide an AI chatbot or AI service to suggest or deliver resources that the users can utilise in high-risk areas (areas with frequent infrastructure or social issues).
Built With
- chart.js
- css
- flask
- google-cloud
- google-translate
- html
- javascript
- json
- nosql
- openlayers
- python
- tensorflow
- transformer

Log in or sign up for Devpost to join the conversation.