-
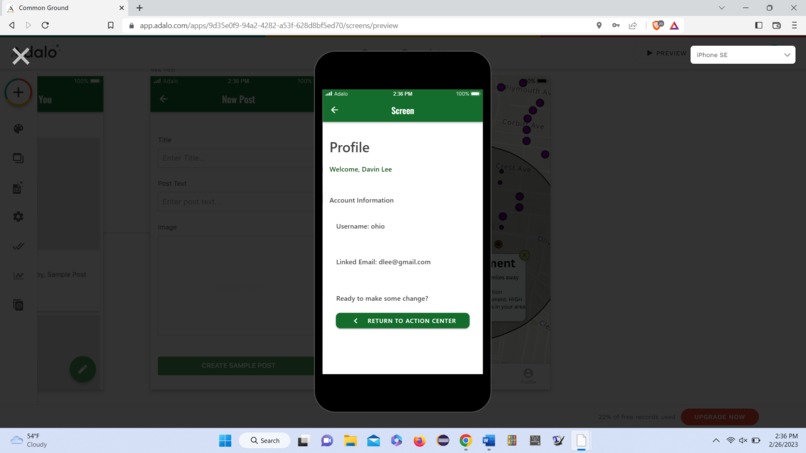
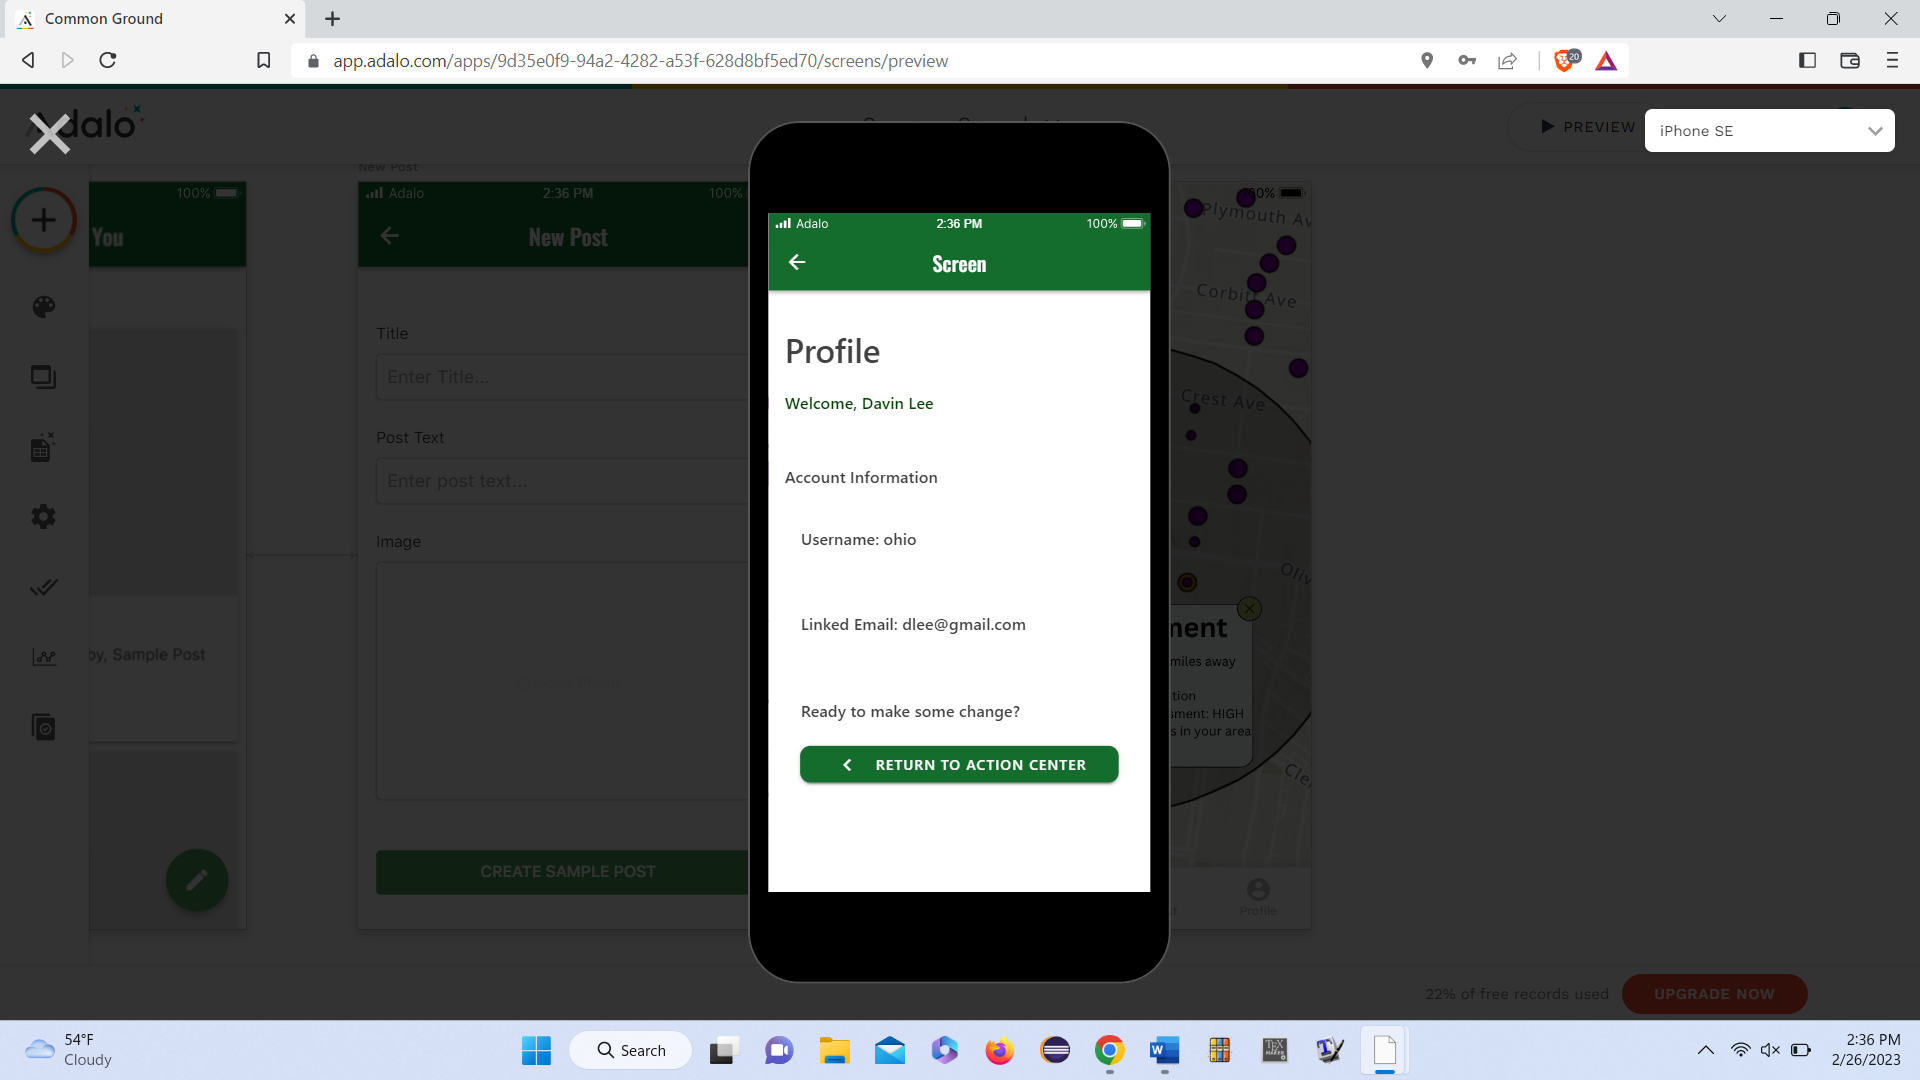
profile page
-
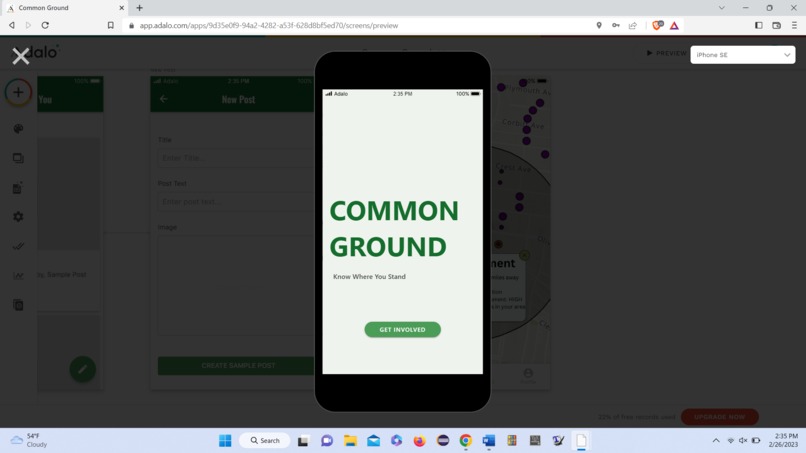
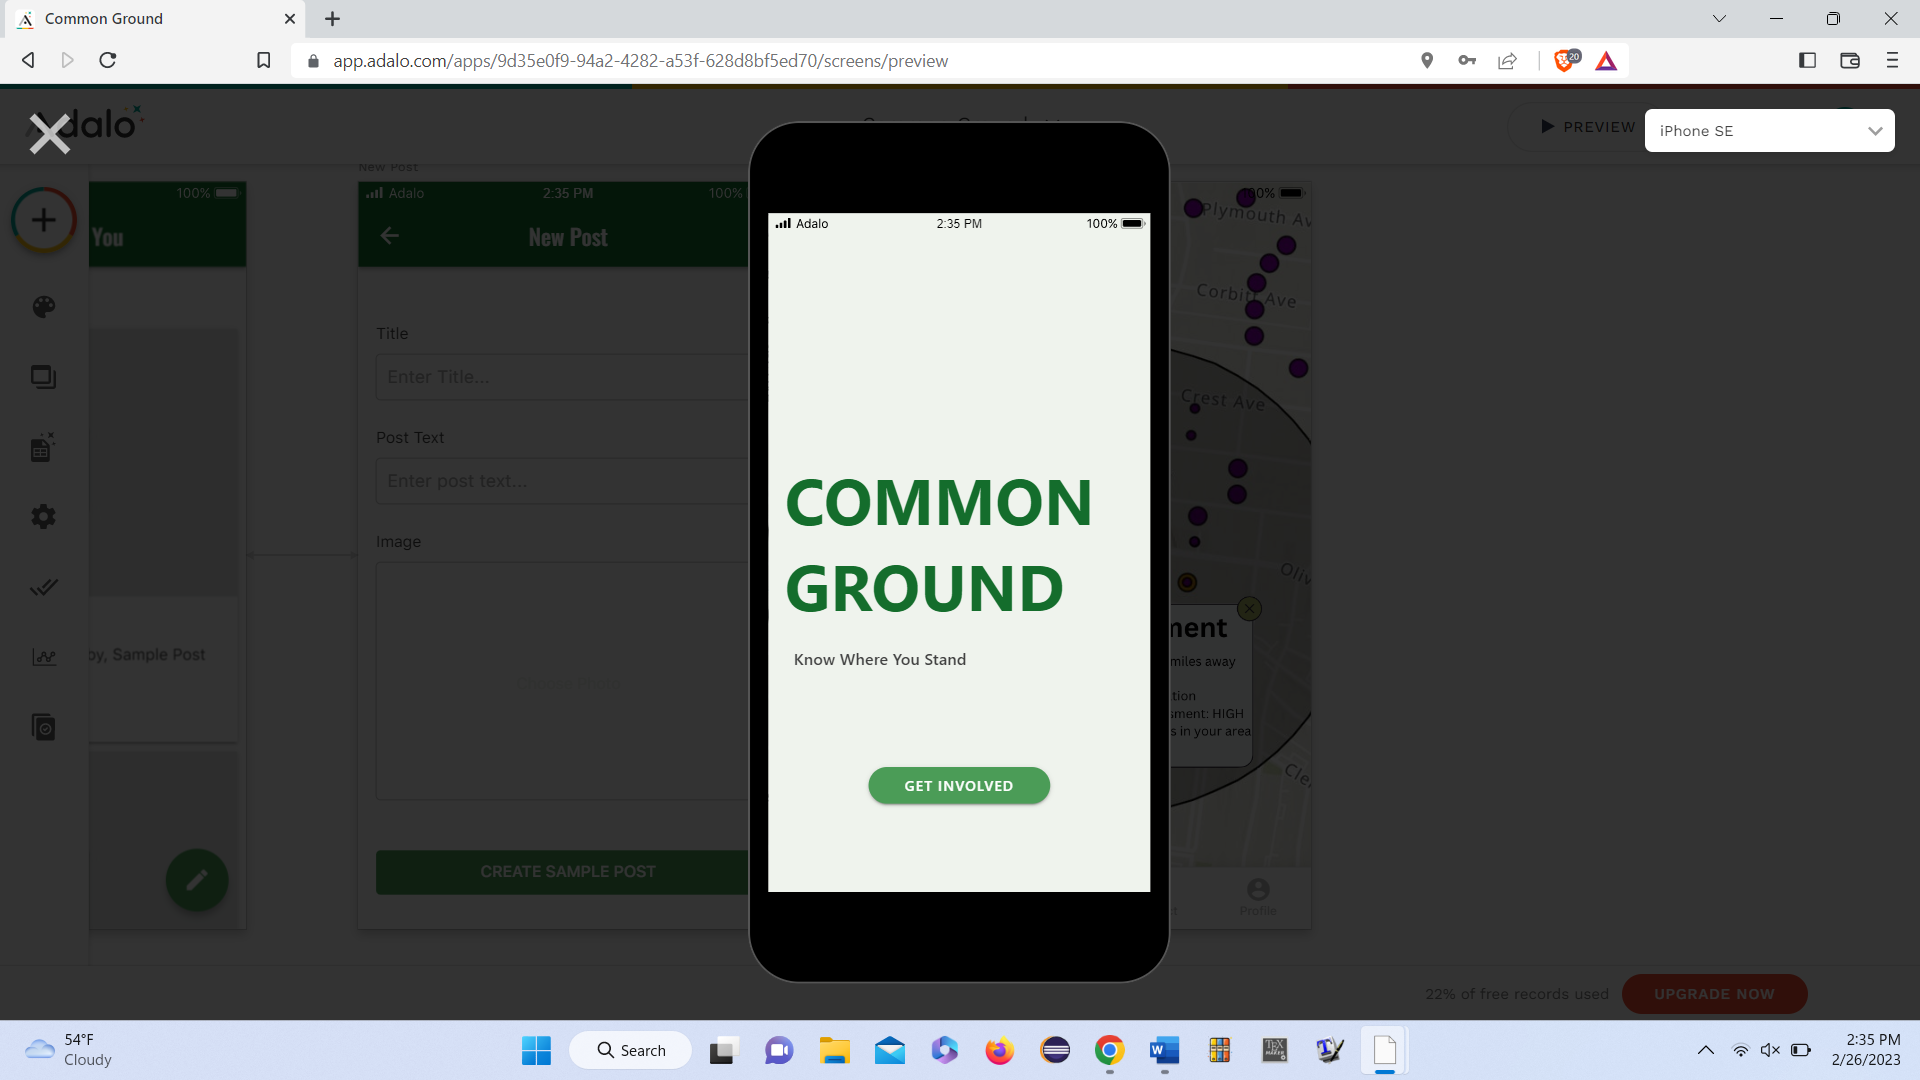
app launch screen
-
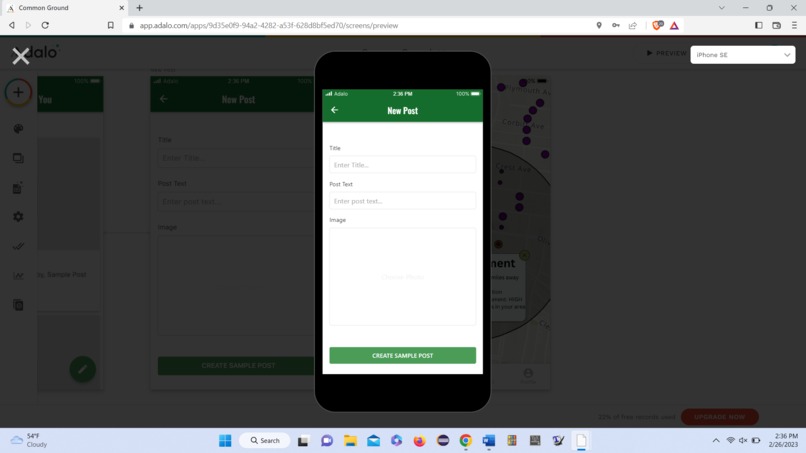
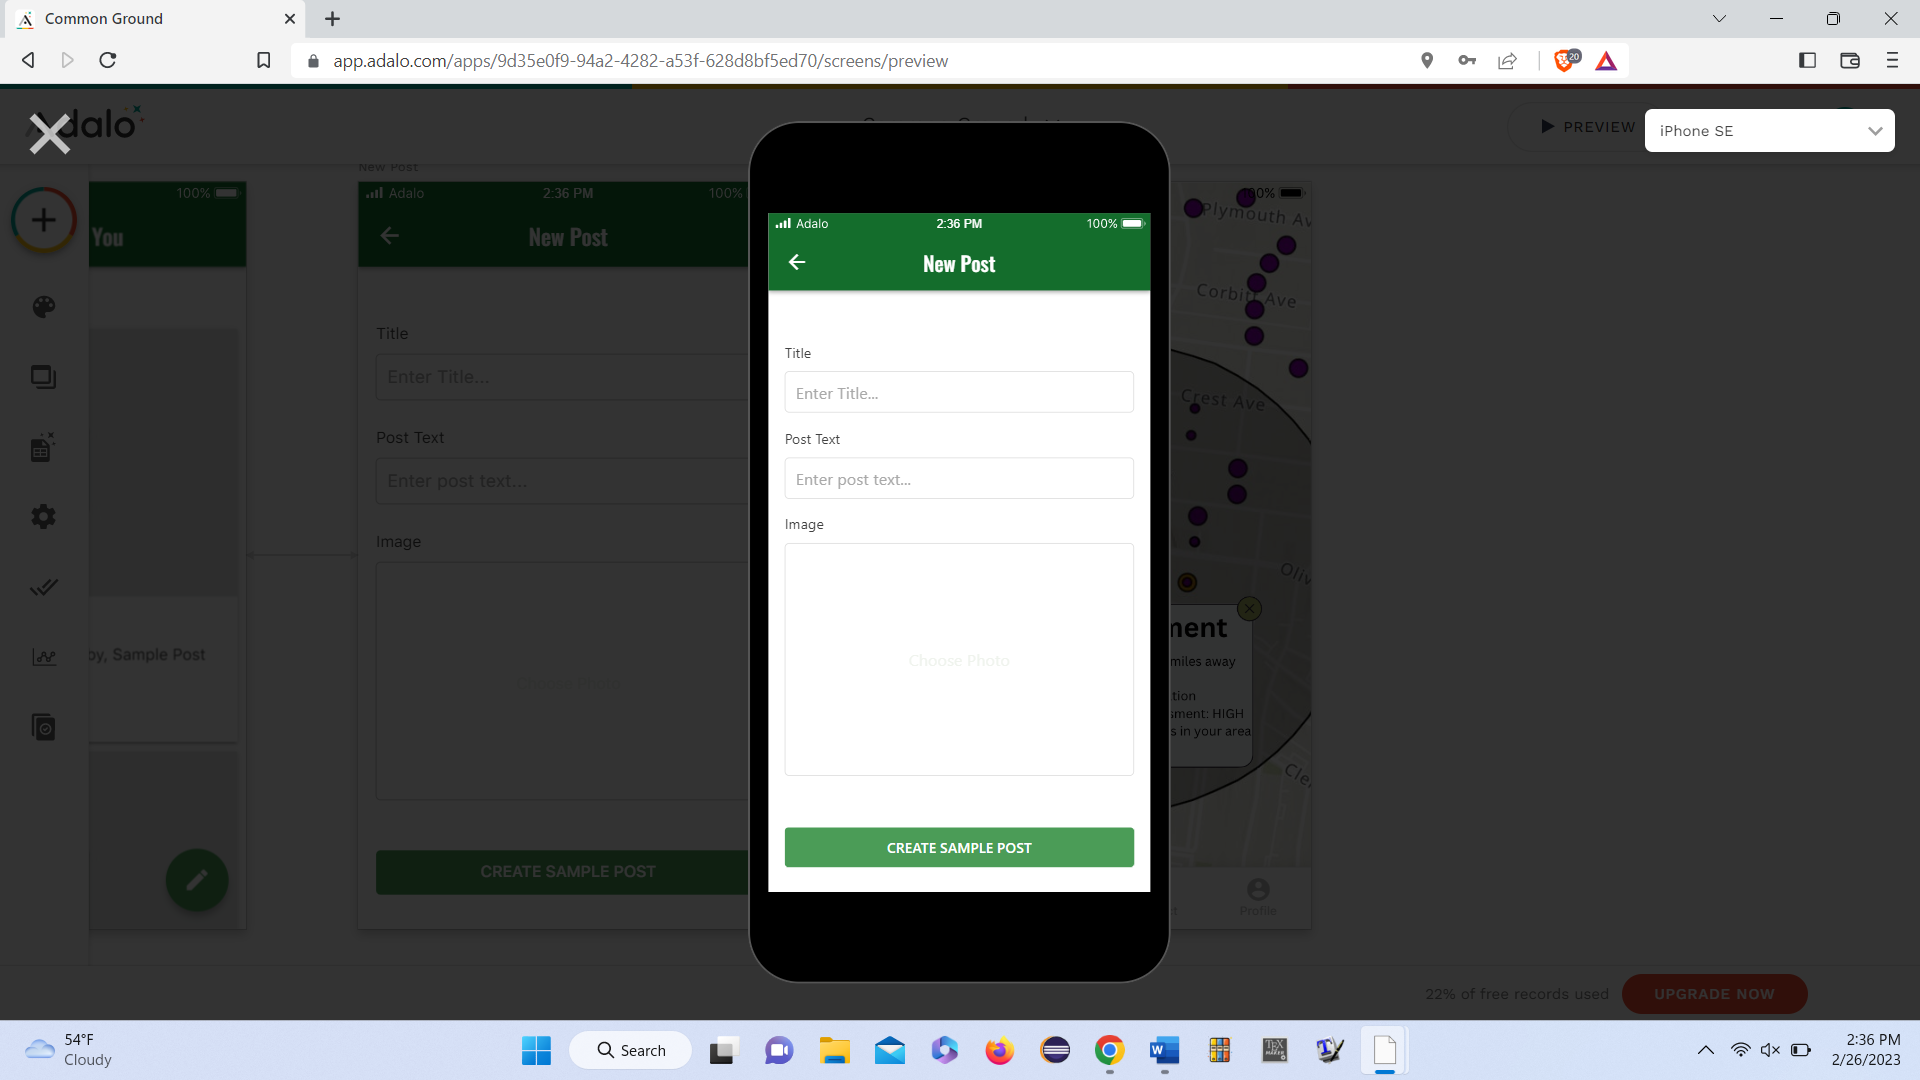
New post page. This is fully functional! New posts made here show up on the example feed.
-
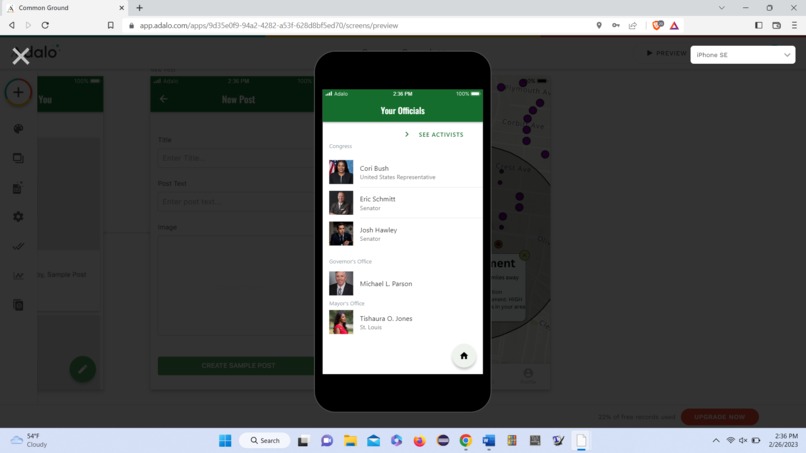
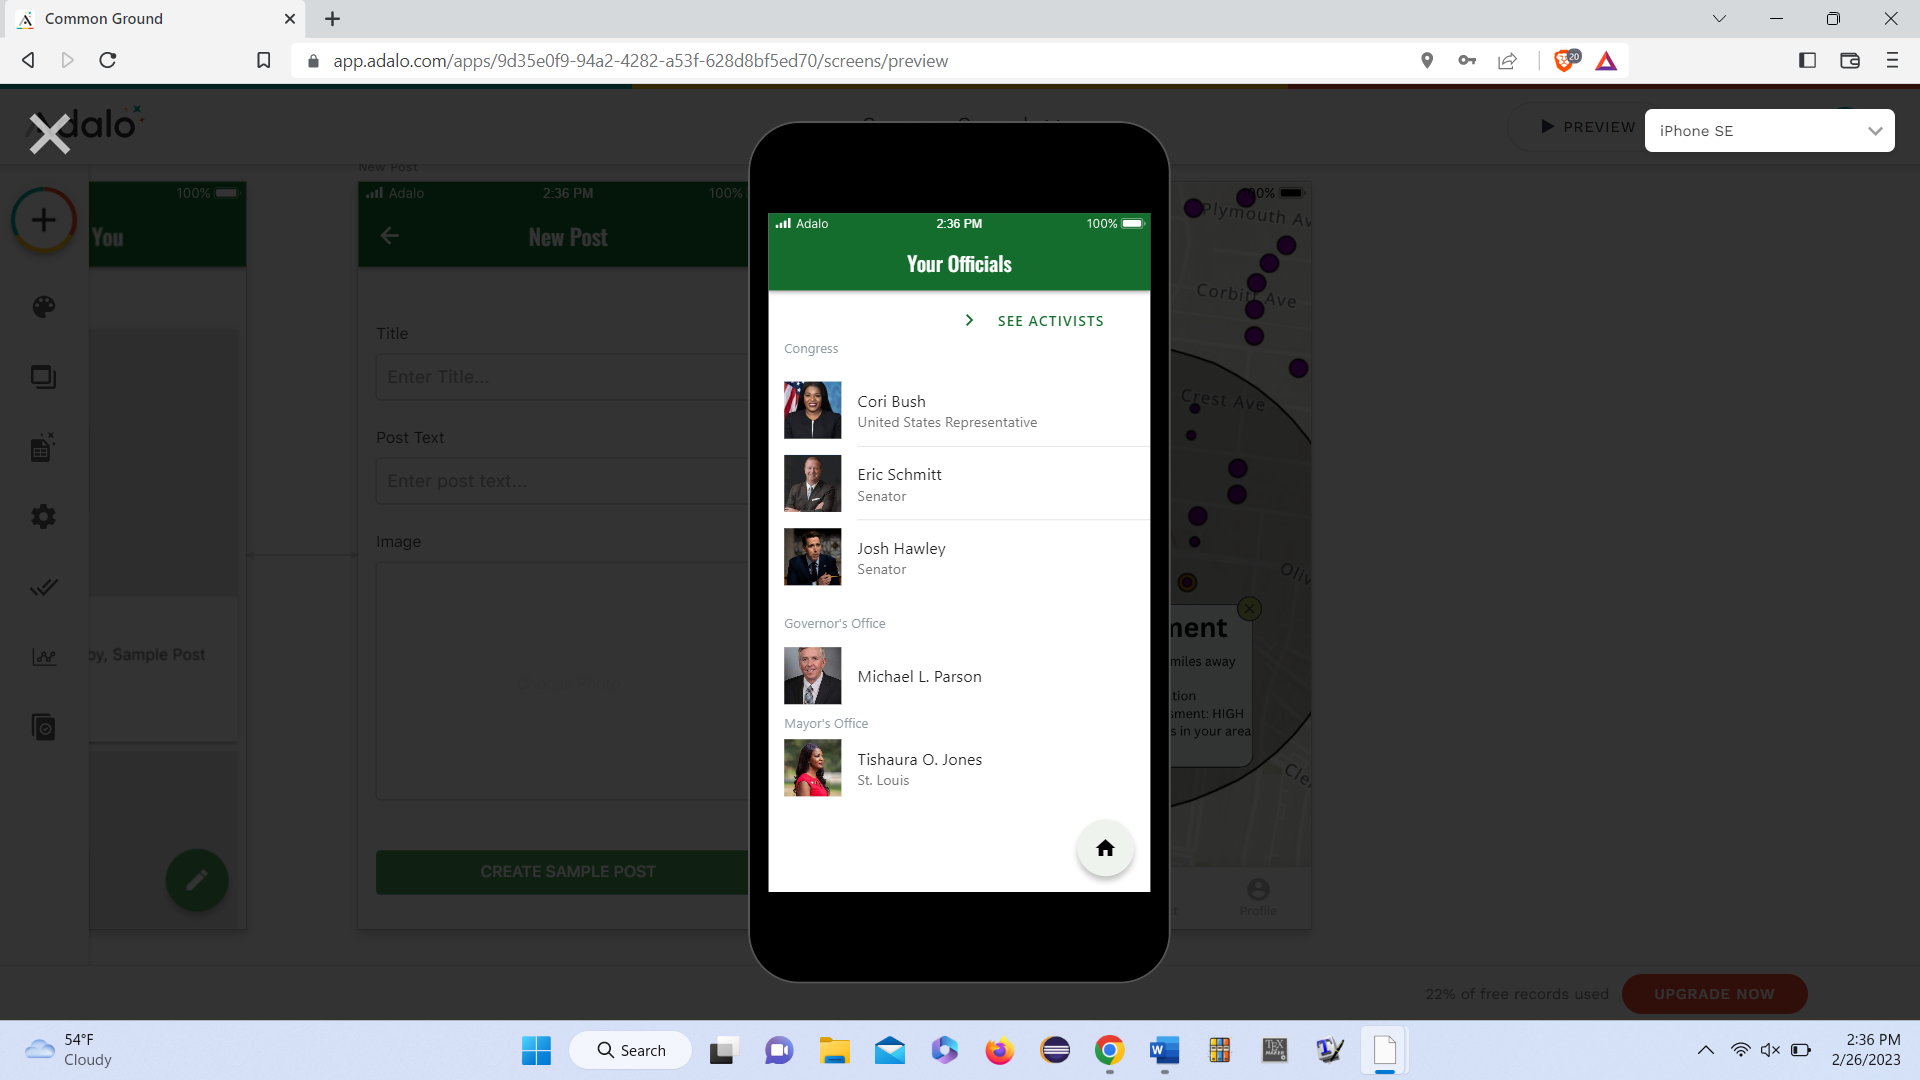
Reach out! Contacts page
-
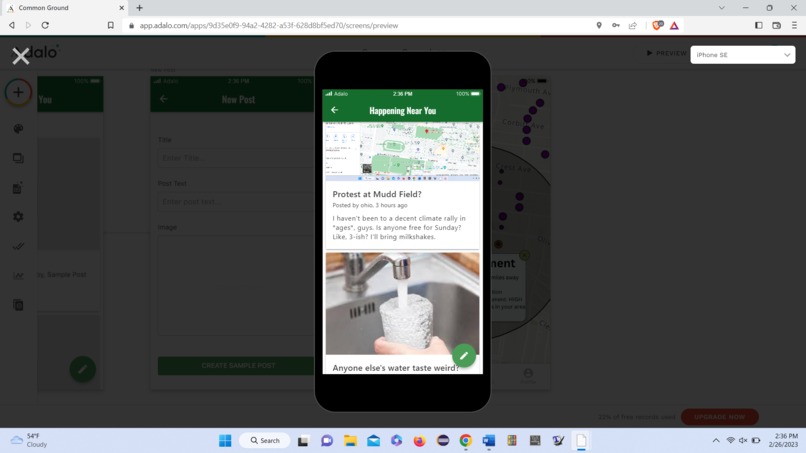
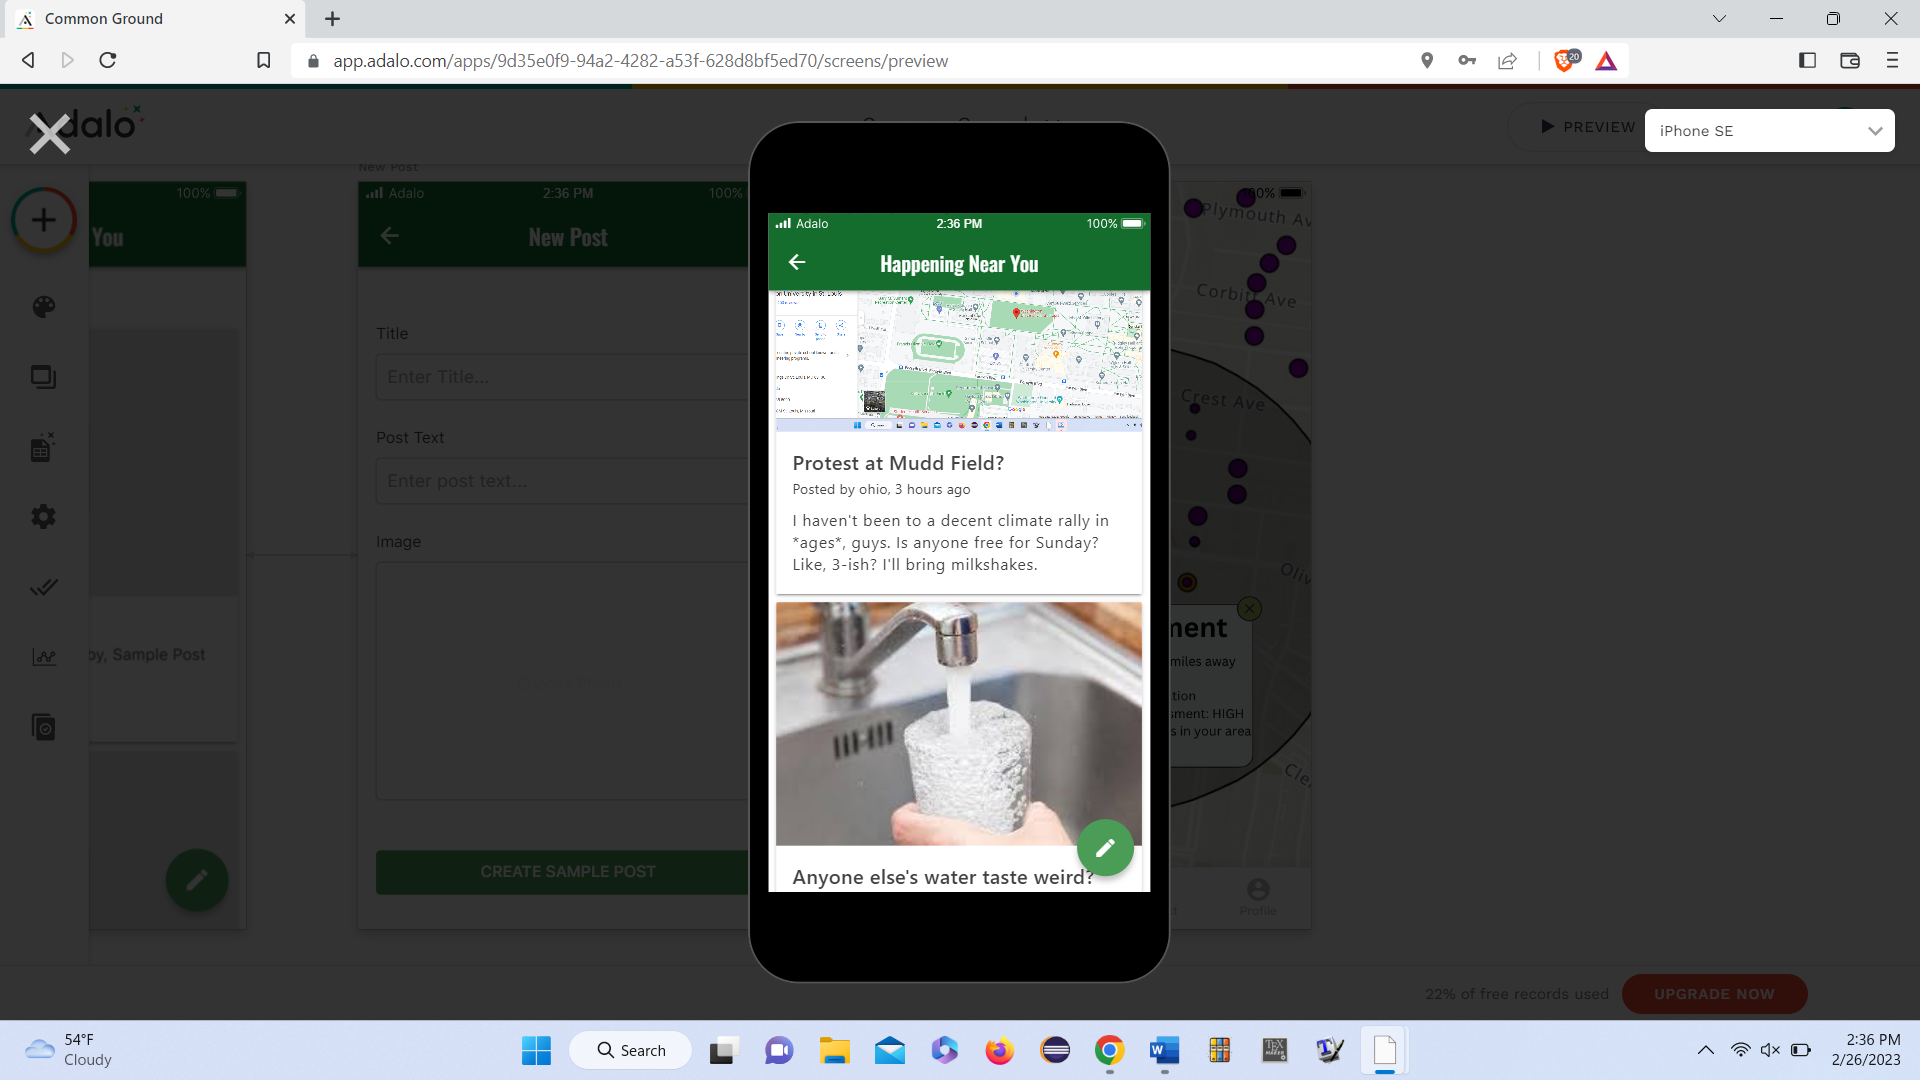
example feed for posts
-
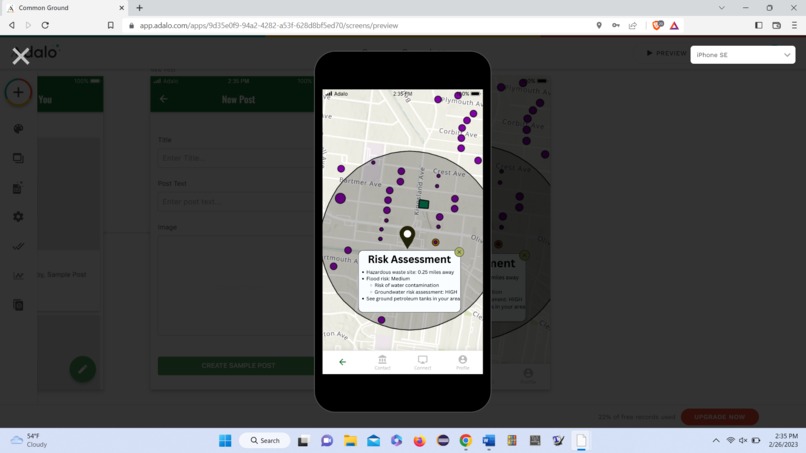
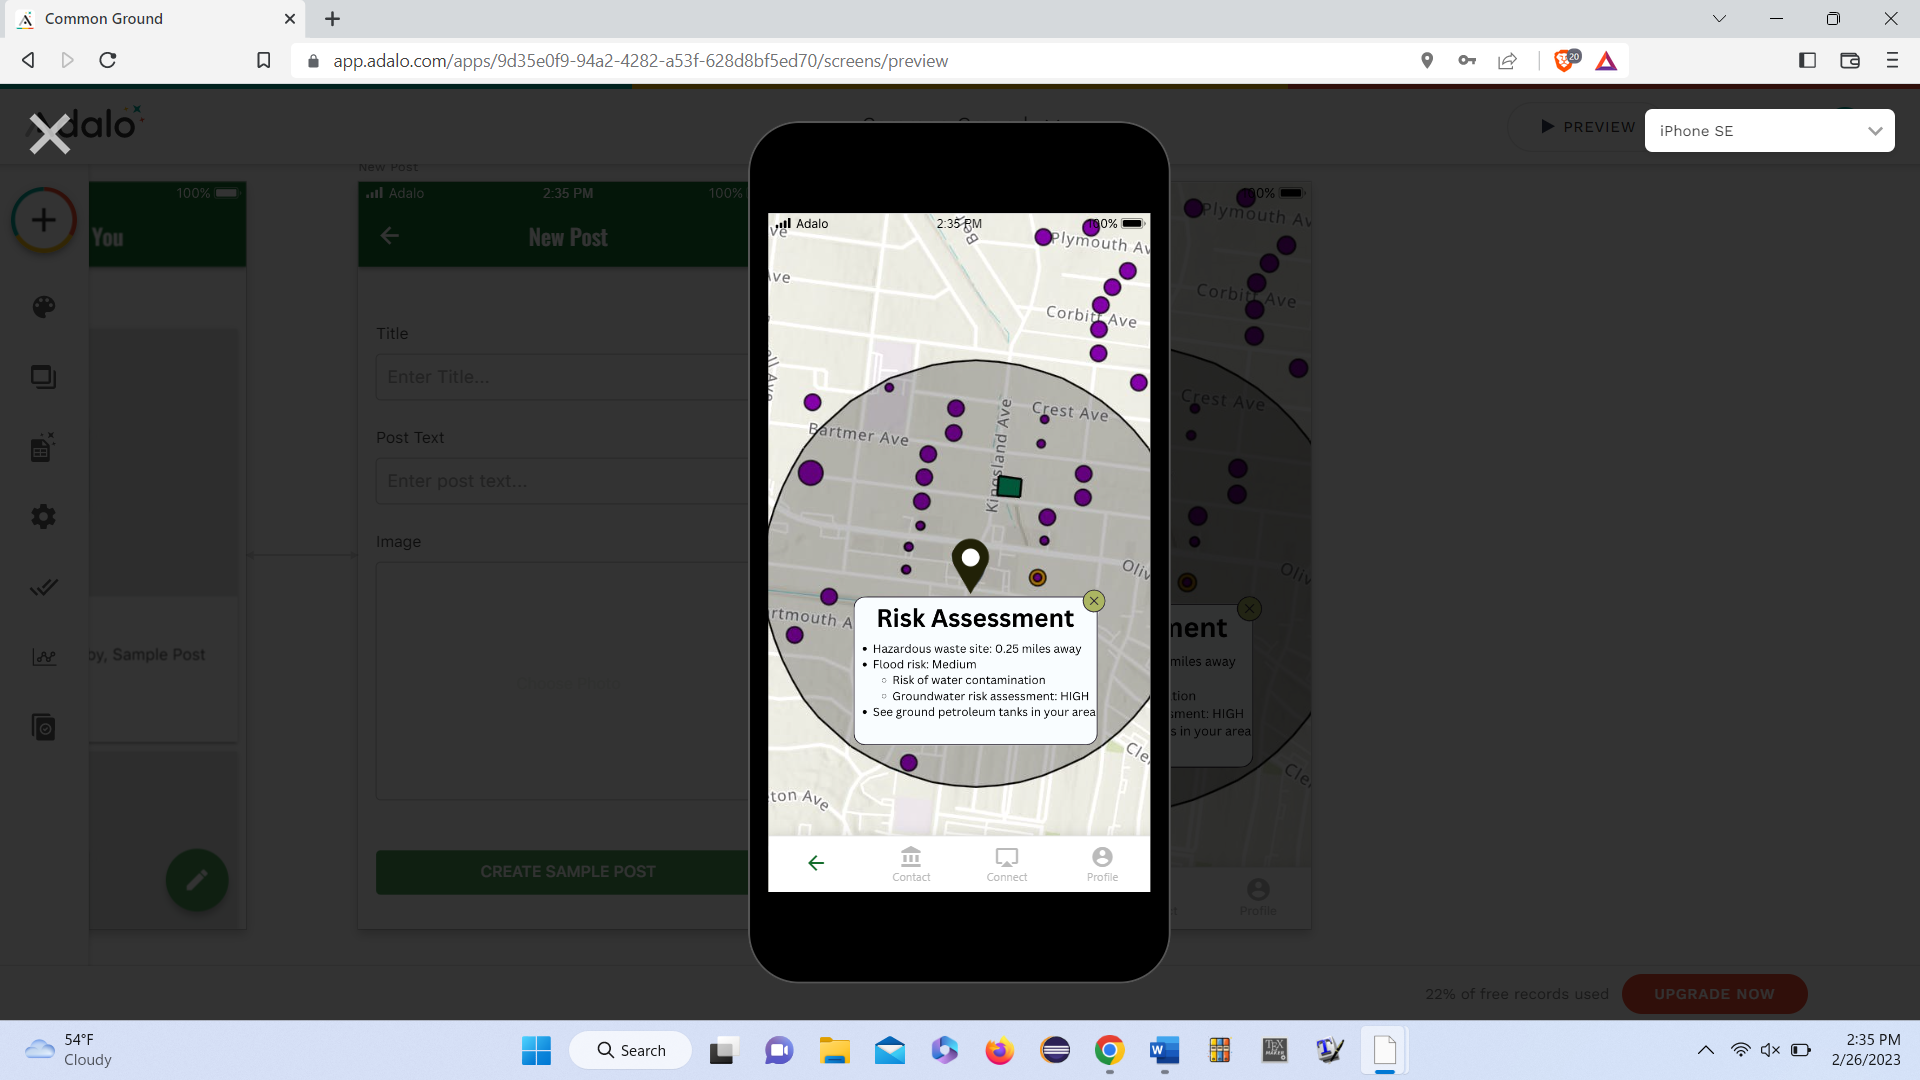
map with text box (proof of concept)
-
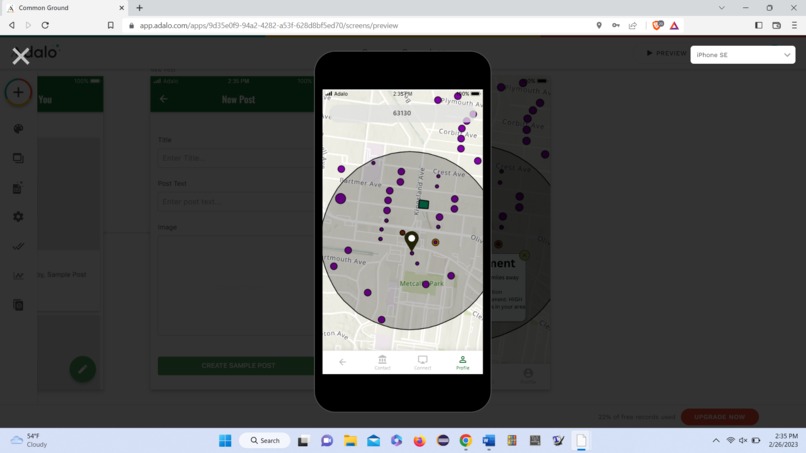
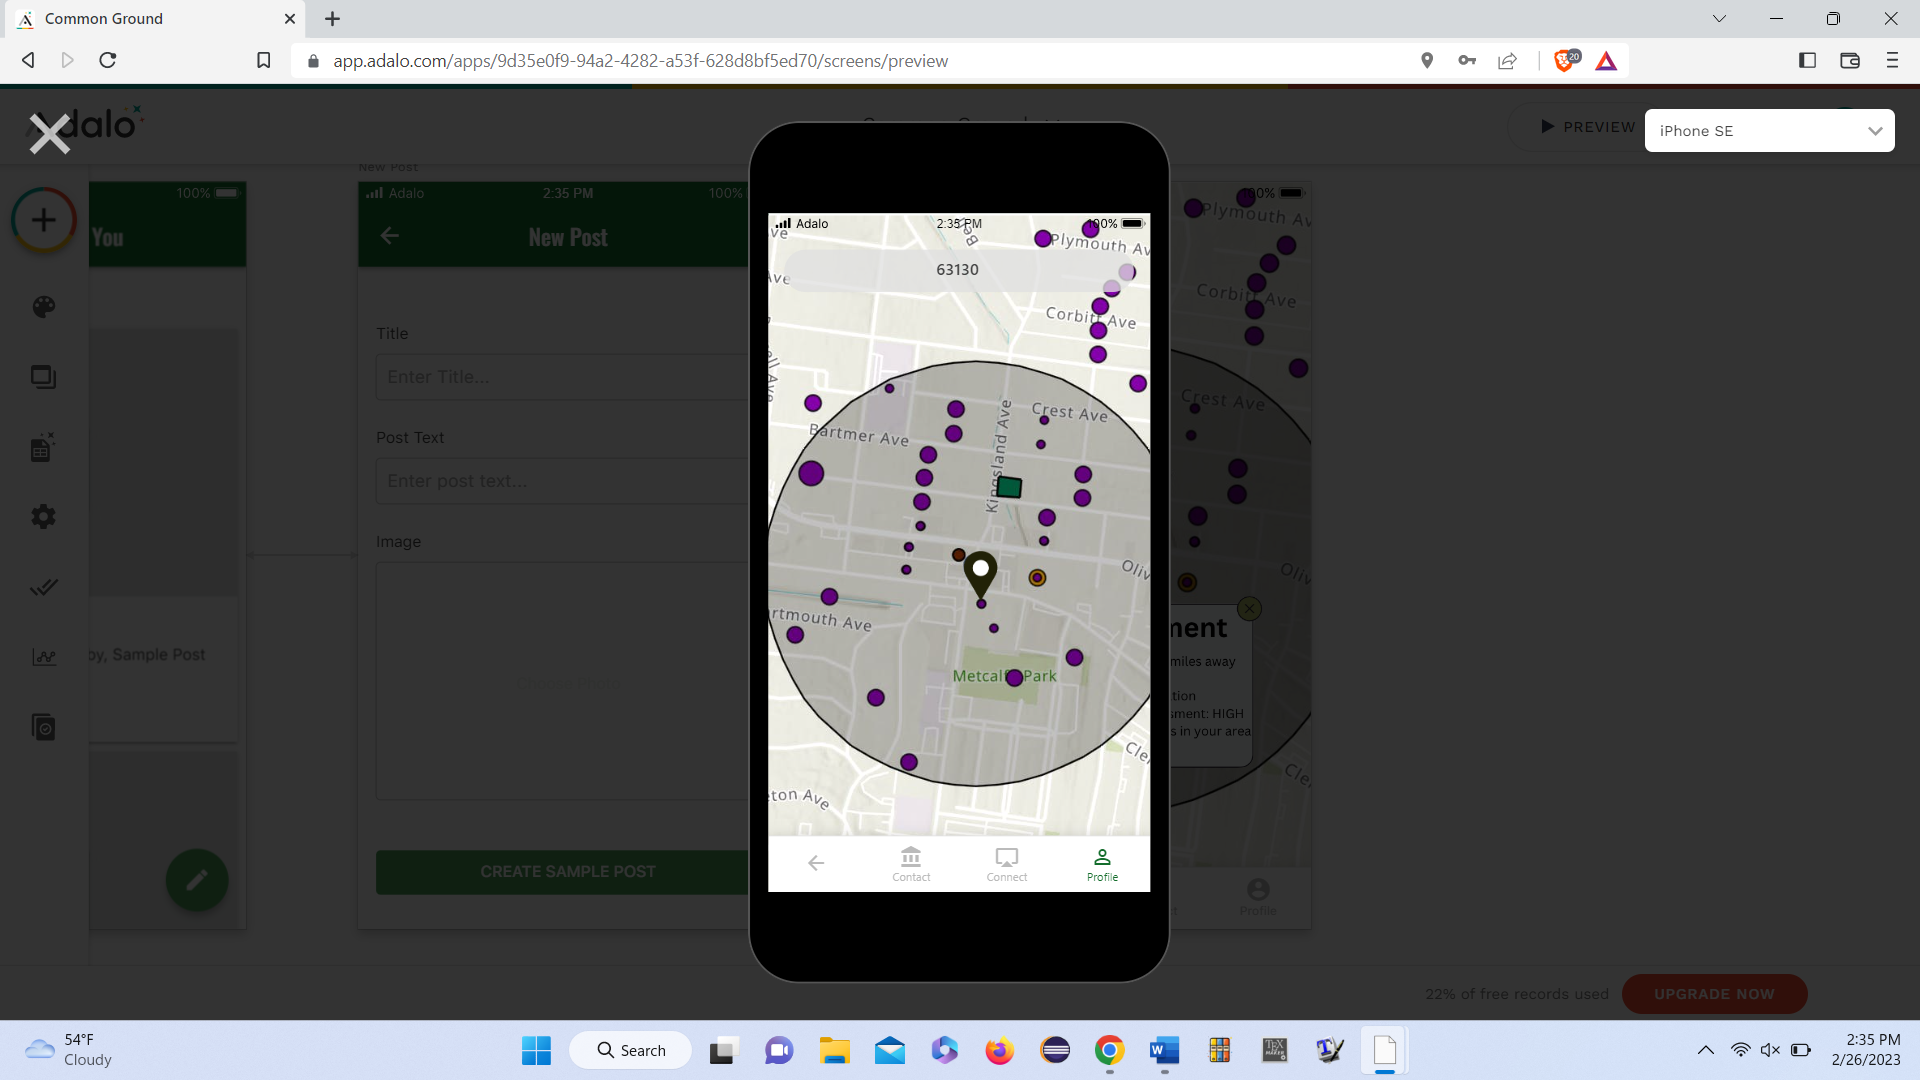
location data (real data)(proof of concept)
-

Logo idea
-
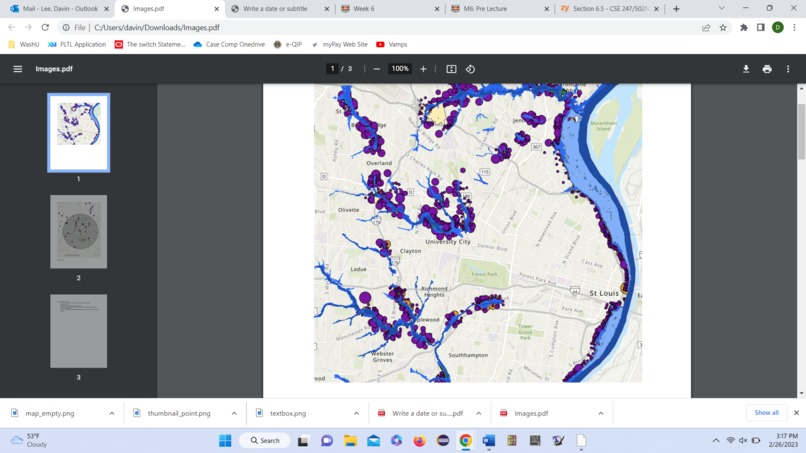
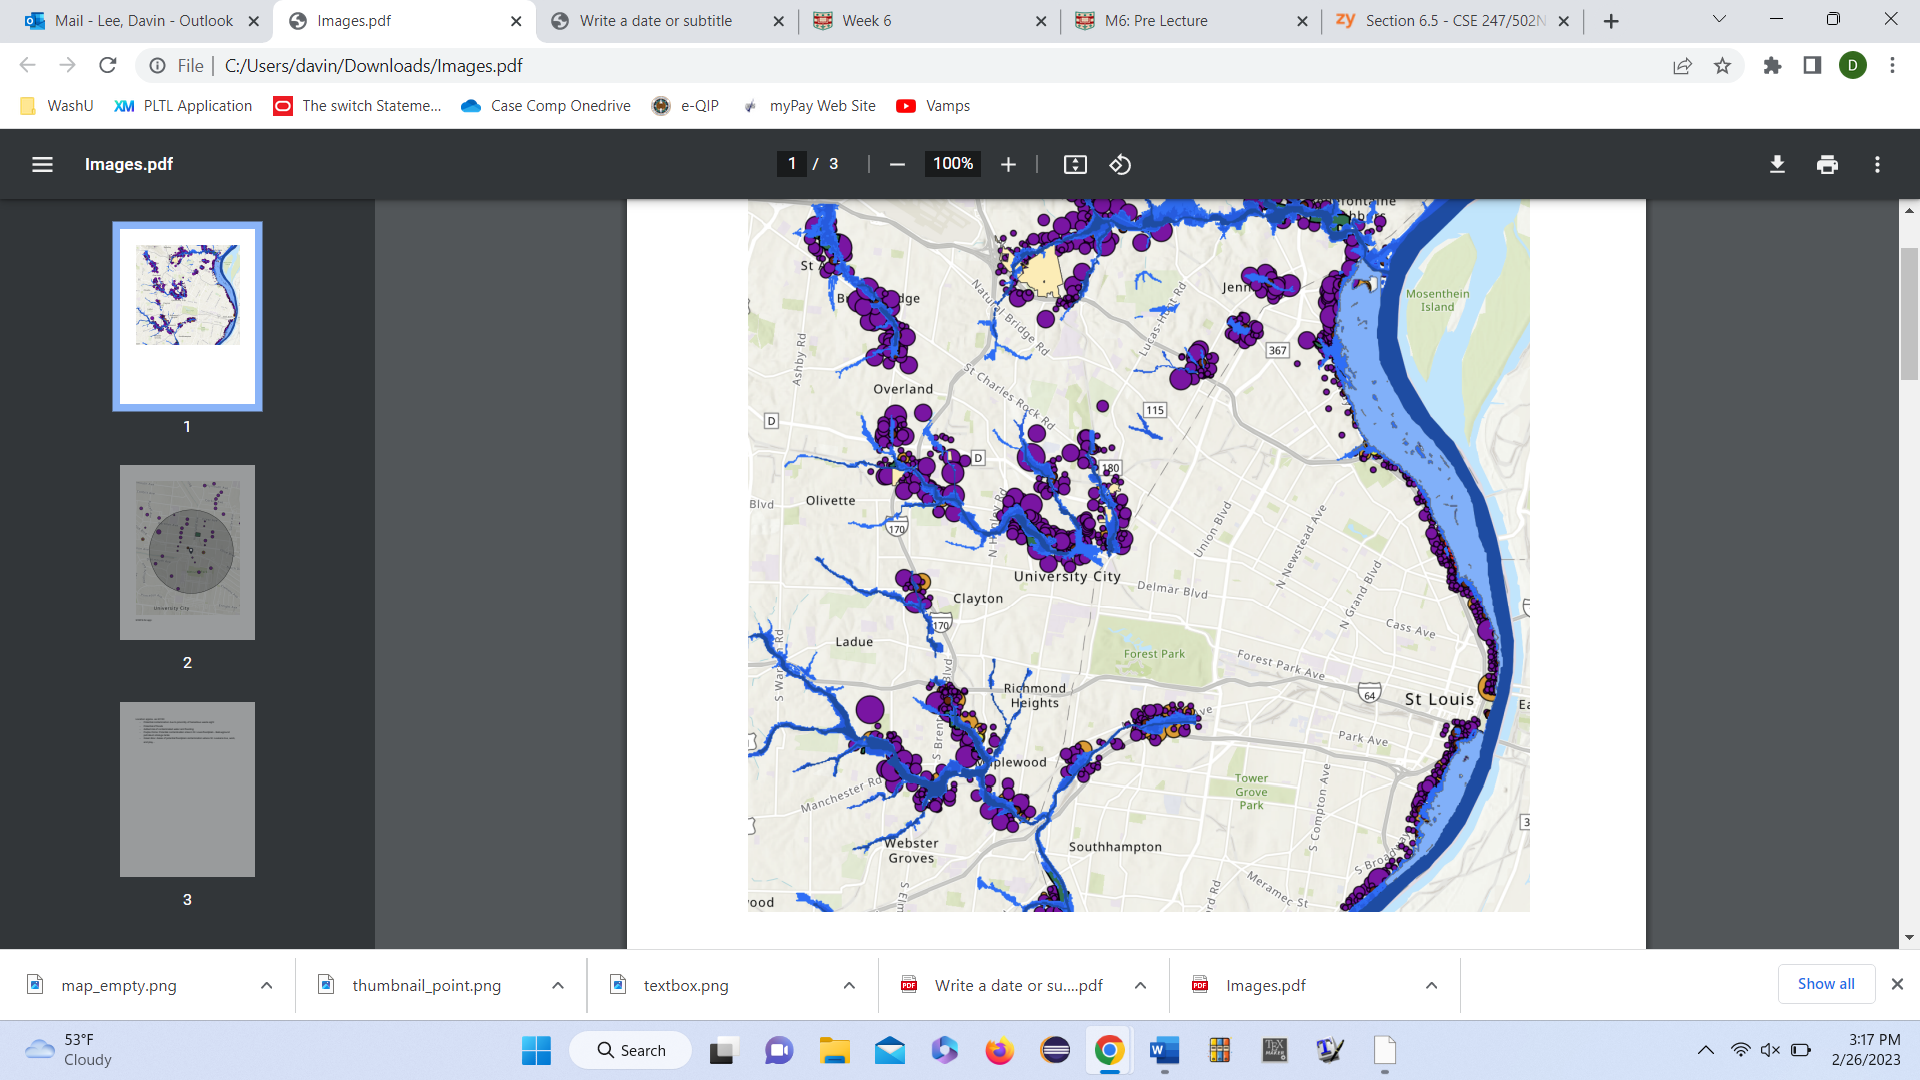
Our data, post visualization, pre-refinement. Made in ArcMaps, using data from a variety of private and public sources.

Inspiration
While incidents like the ones in Flint, Michigan and East Palestine, Ohio provide the source for numerous headlines about the tragedy of large-scale ecological disasters, countless other communities in the United States go unheard in their daily struggles against environmental hazards and corporate negligence. Despite the wealth of information available about these risks, the difficulty for the layman to parse the data tables and intricate graphs means many of these movements fizzle out before they even get off the ground. It's just too hard right now for normal people with regular lives to understand and get involved in the fight for their own health and safety.
The methods of Common Ground
Common Ground centers around the "action center." After a simple signup process, users get access to an interactive map of their surrounding communities. The map distills over a hundred various reports and studies on both regional and local environmental hazards and highlights only those which are relevant to the user, condensing the information into a few helpful popup boxes which tell them the risk levels for their homes, schools, and workplaces. From there, users are able to connect with others in their community through posts, or contact their local representatives and activism groups with just a few simple taps.
How we built it
We used Adalo to build the app from the ground-up. The no-code platform provided many advantages, allowing us to easily implement a number of features which would have taken much longer to create with hard code. We found most of our data on EnviroAtlas, which boasts over 500 different graphs on various environmental data sets, and compiled it into a series of csv files which we ran through Tableau. We also collected data sets from local research teams and government organizations. Once all this was in hand, we used ArcMaps to generate a few location maps with all the data graphed onto it, which we then refined into the visuals present in our finalized product Action Center. Synthesizing this data into an easy-to-understand format was one of our primary goals for Common Ground, and it took nearly as long as designing the app itself.
Challenges we ran into
Adalo is extremely limiting in how much they allow you to manipulate the graphs from their Google Maps interactive. There was no way to add additional dots indicating hazard areas, or to create radius limits for the action center's scope. This was by far the most ambitious part of our project, and in the end we settled for a proof of concept which we believe adequately showcases our idea for the action center as well as its feasibility as an actual product.
Accomplishments that we're proud of
Implementing a working post feature was a bit tricky, and we're proud of having figured it out and being able to include it in our finalized product.
What we learned
Before this weekend, we had little to no idea how to actually use a no-code platform. Now, both of us are confident we'd be able to create a basic app through Adalo for pretty much any purpose given only a few days' time. It's a massive leap up, and it wouldn't have been possible without the atmosphere of competition and teamwork of the Hackathon.
What's next for Common Ground
We want to do more work on the Action Center, getting it off the ground not only for St. Louis, but for many of the major cities in the United States. As ambitious as that sounds at first, our only real roadblock is figuring out a way to implement map interactivity for Adalo, for which we already have several ideas. After that, we plan to start looking for potential users and sharing our app with environmental activism groups on campus and in the larger St. Louis area as a trial run for its usefulness to real-world organizations.
Built With
- adalo
- arcmap
- tableau

Log in or sign up for Devpost to join the conversation.