-
-
-
Network
-
-
-
-
Inspiration
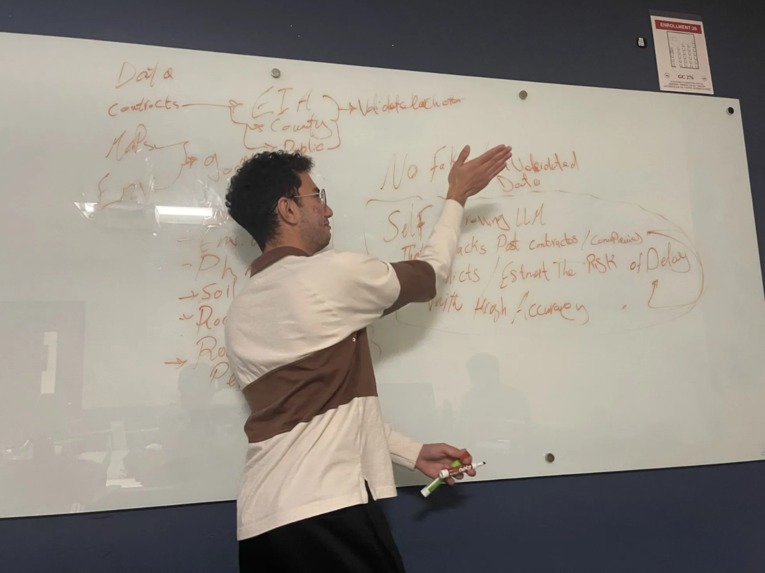
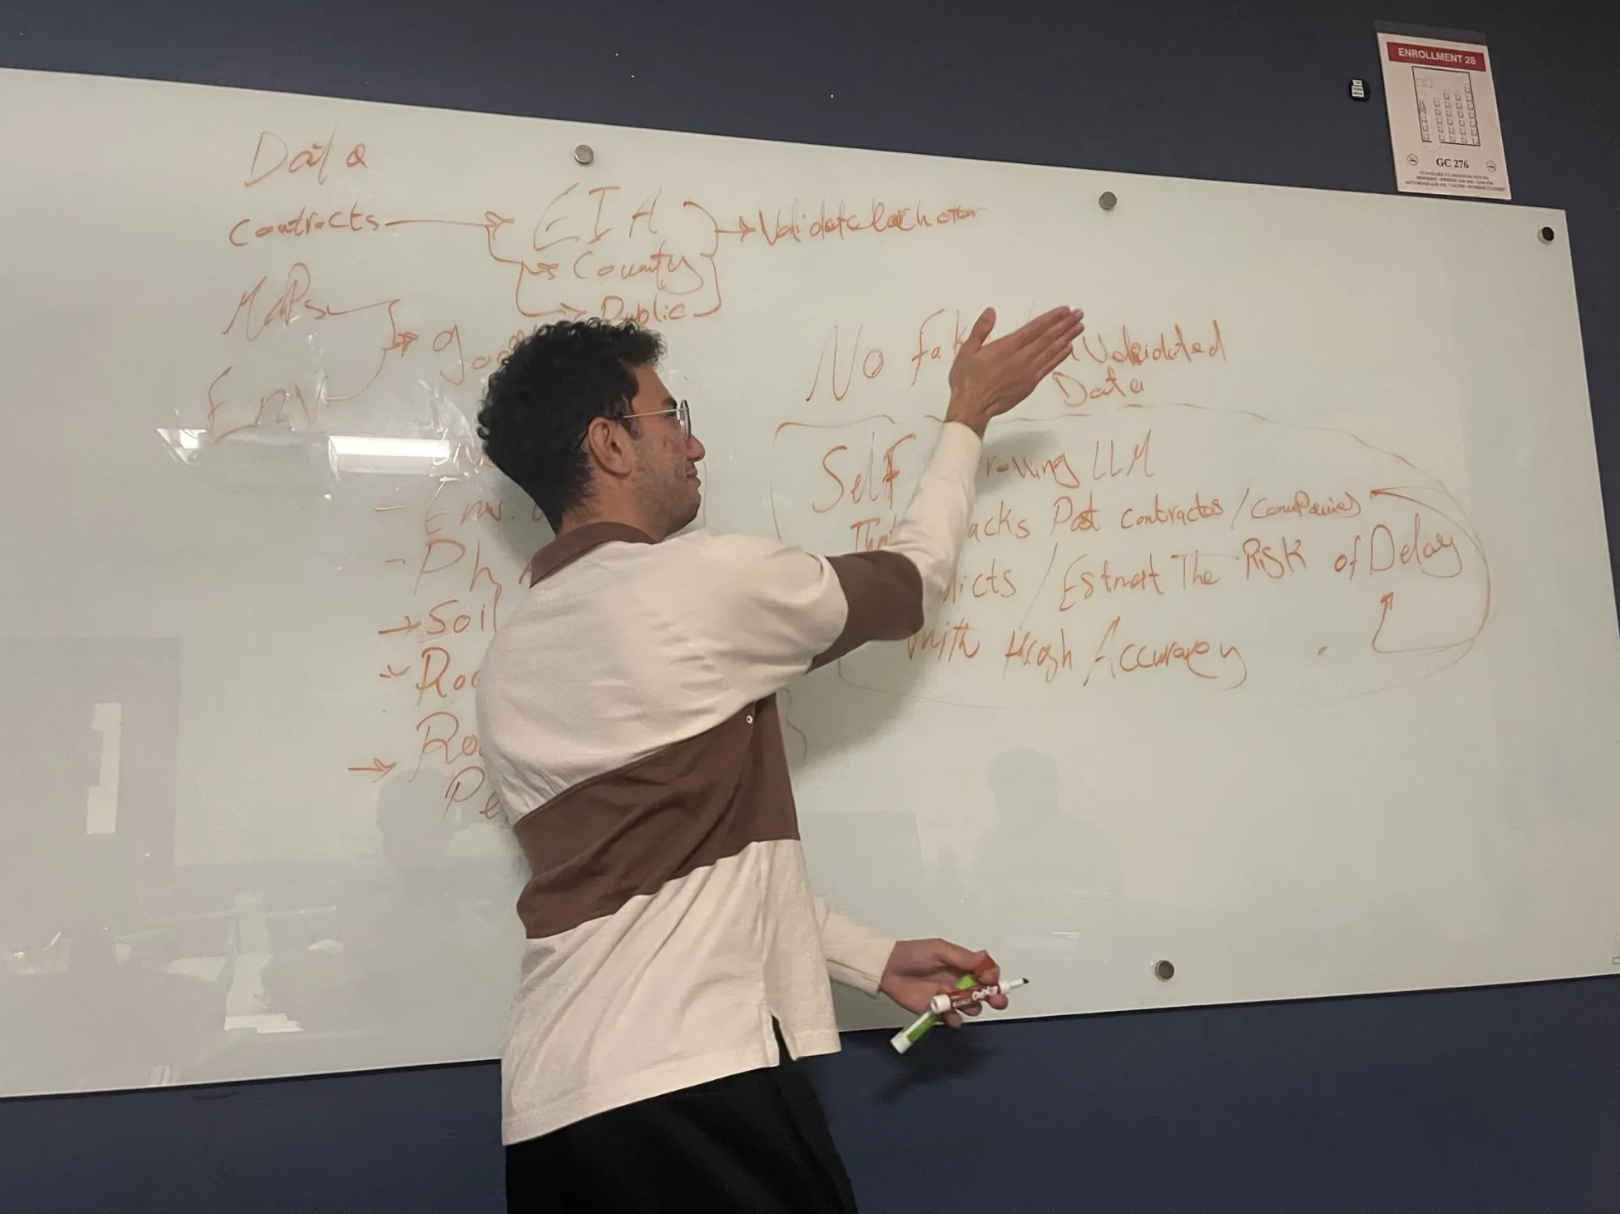
Common Ground started from the Gridlock challenge presented by our sponsor at ShellHacks. We were interested because the problem had real-world stakes, but no obvious solution or clean dataset. We had to research public utility filings ourselves and figure out what information was actually useful.
What it does
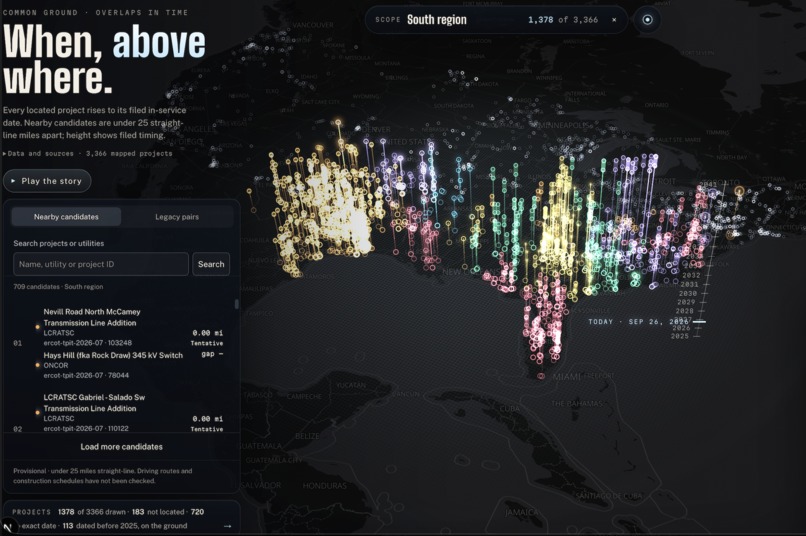
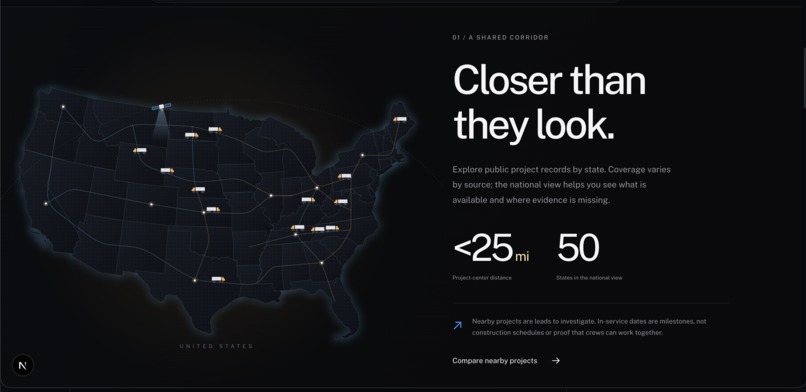
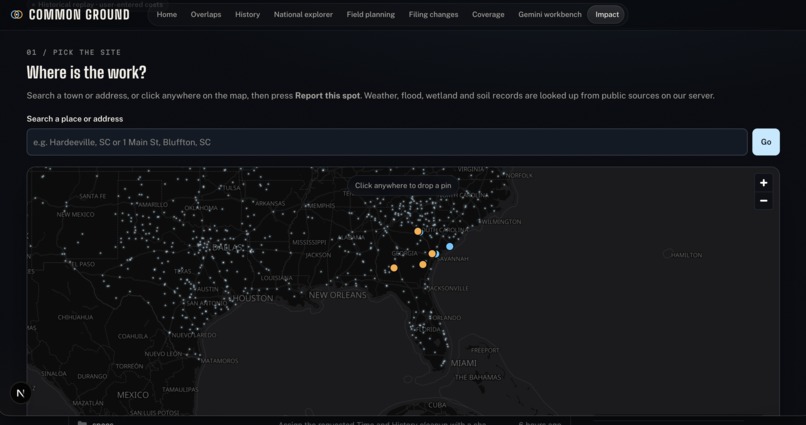
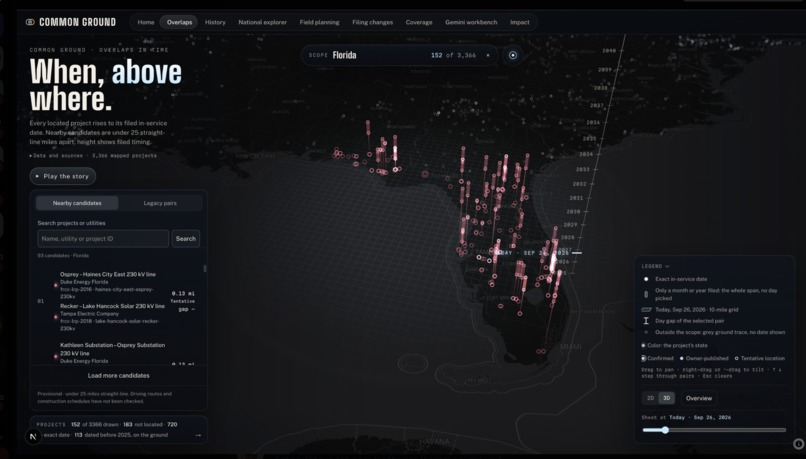
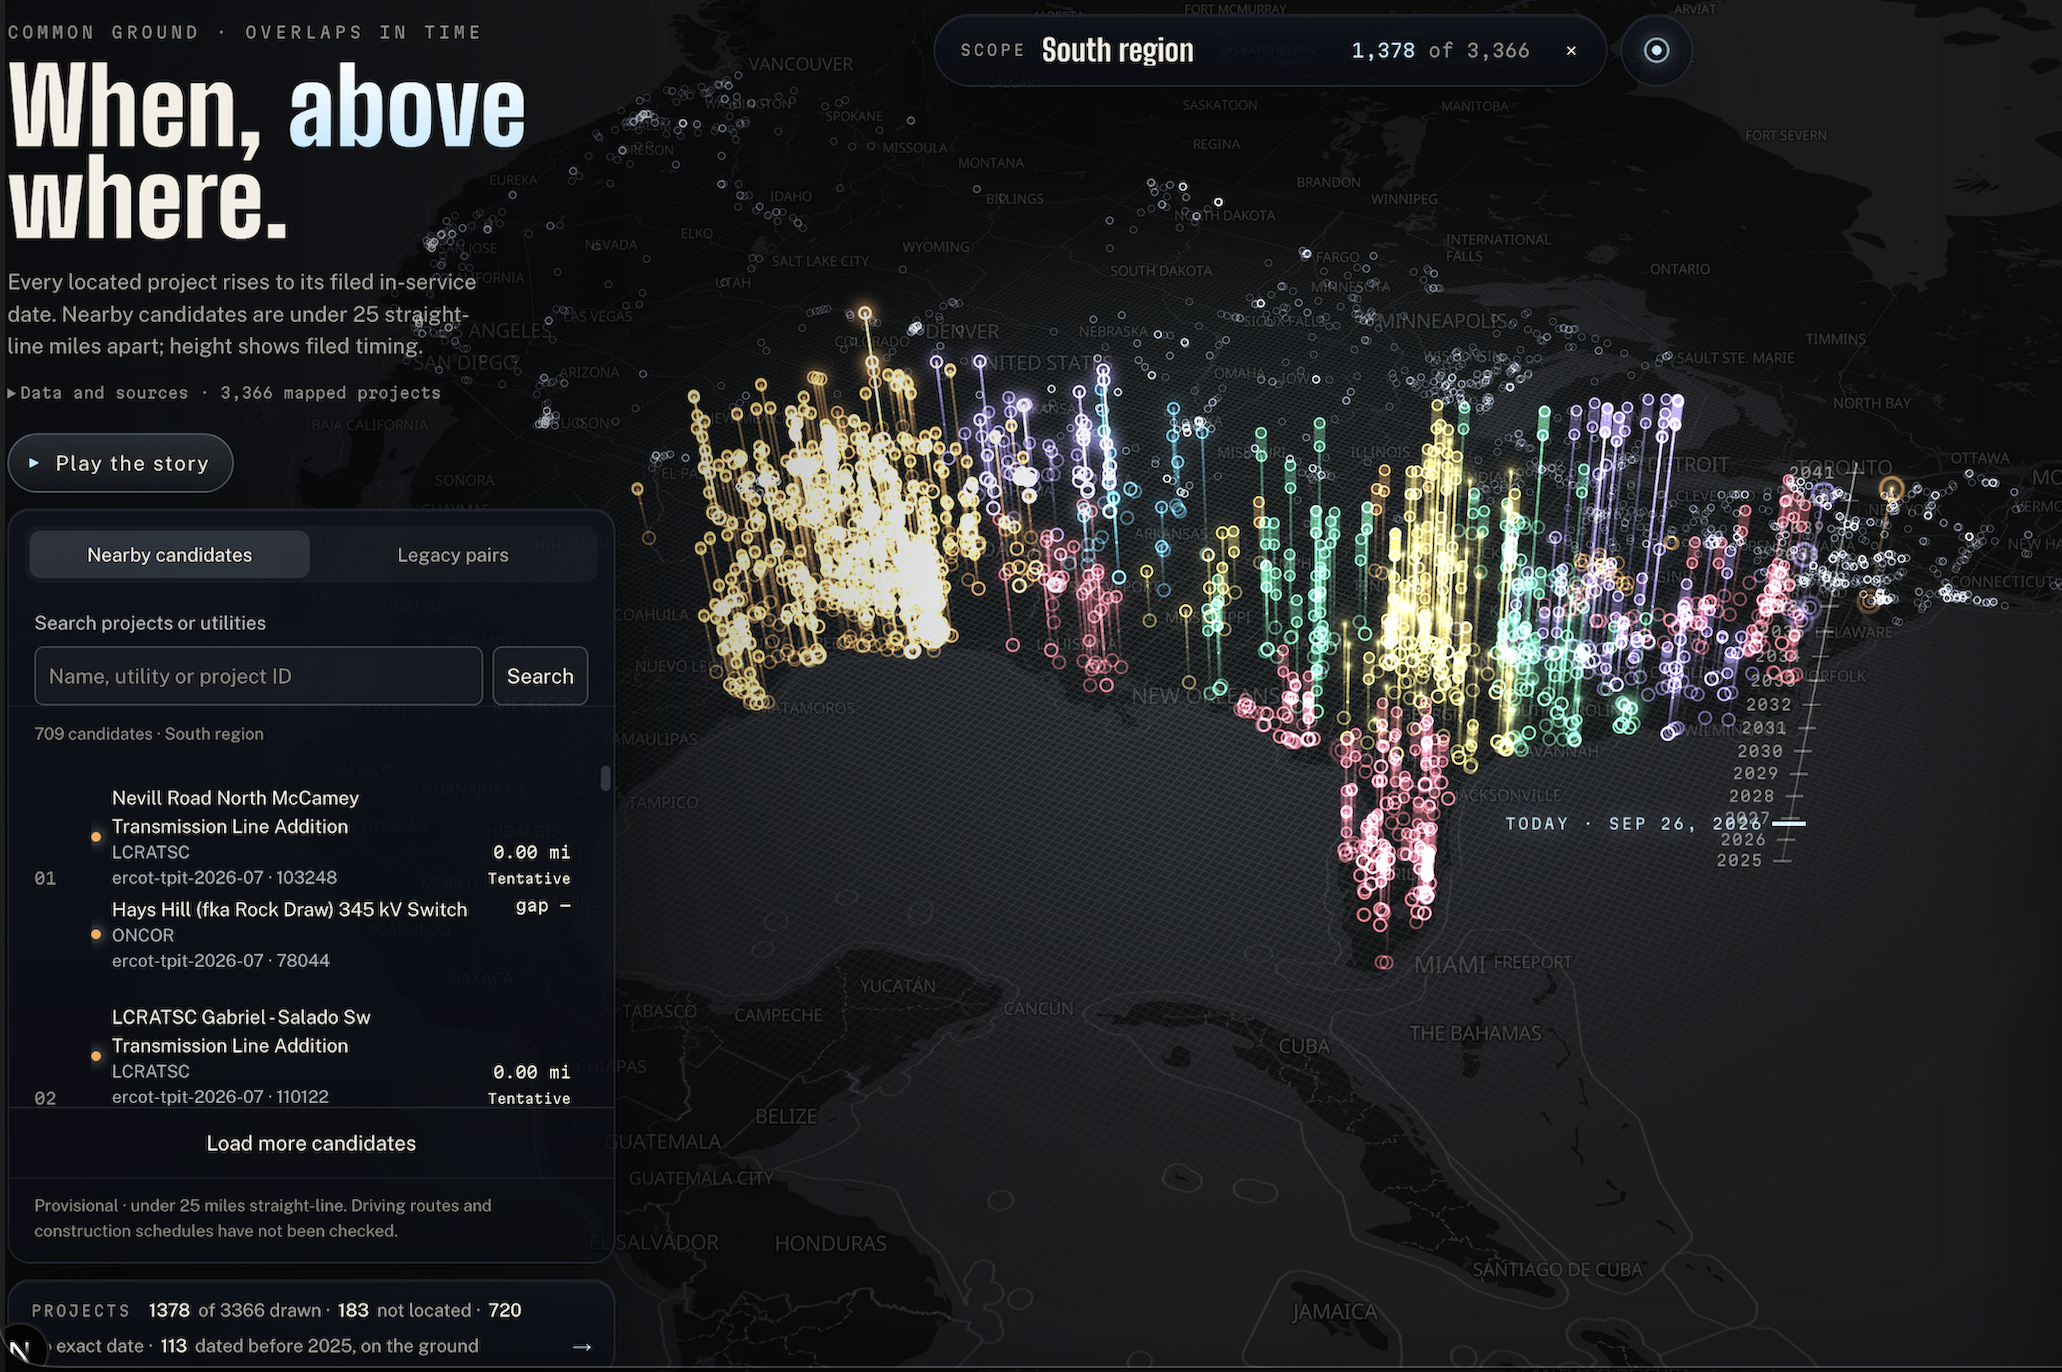
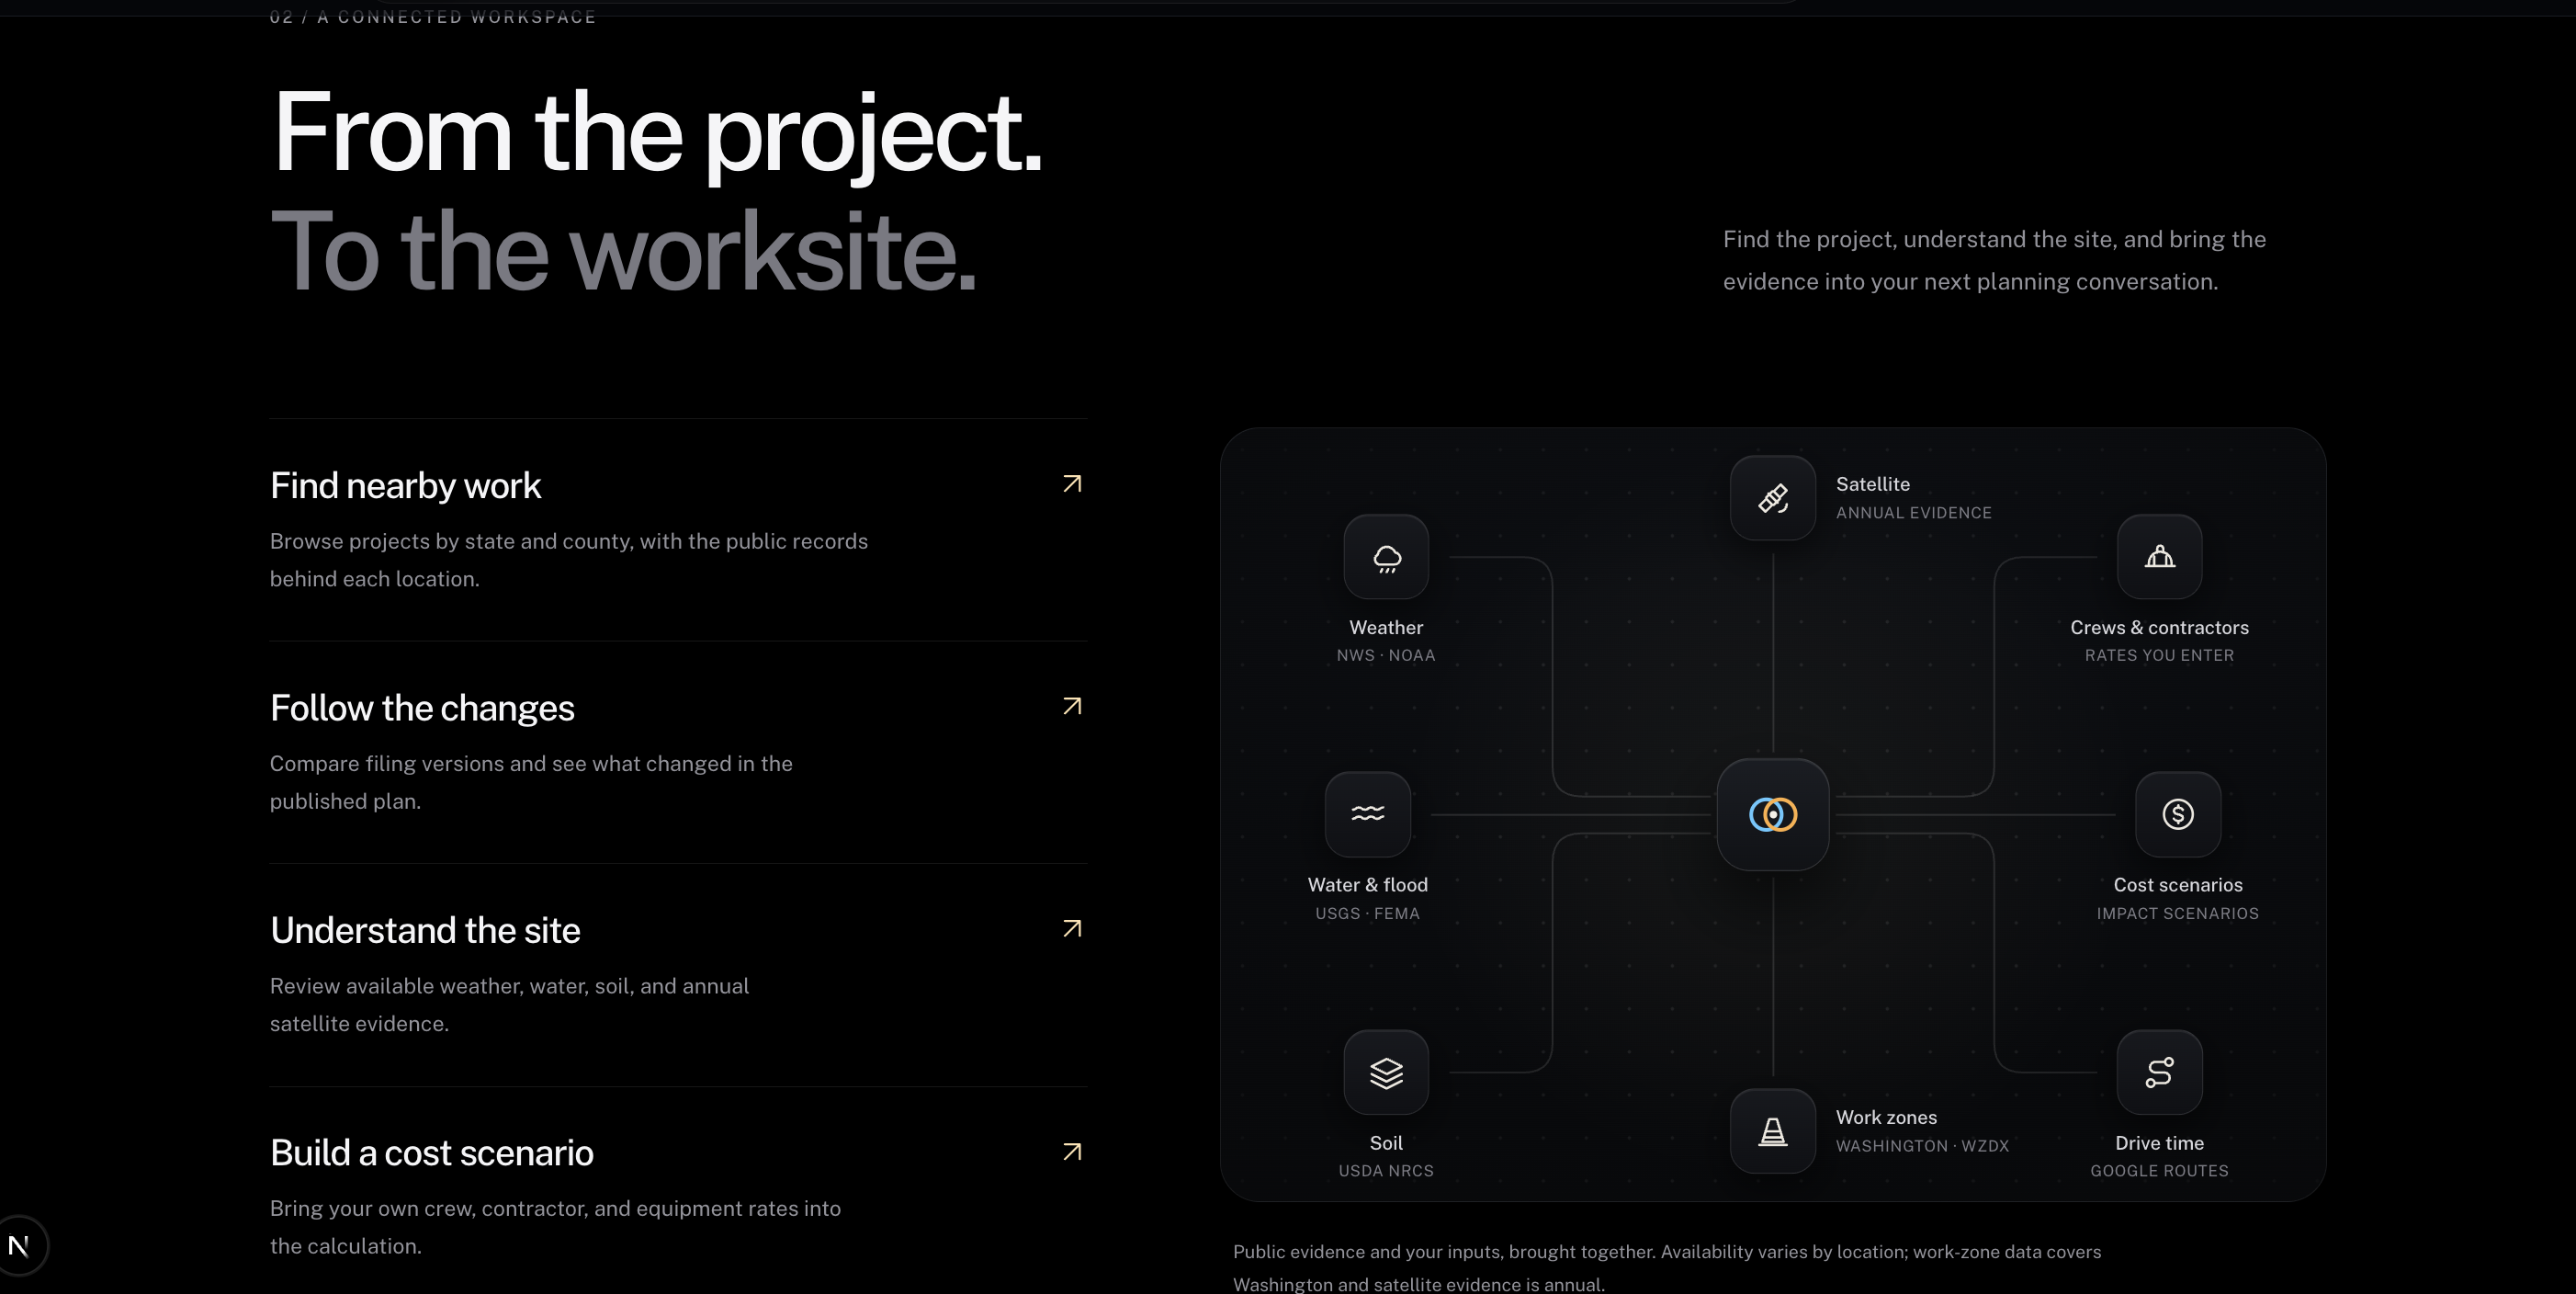
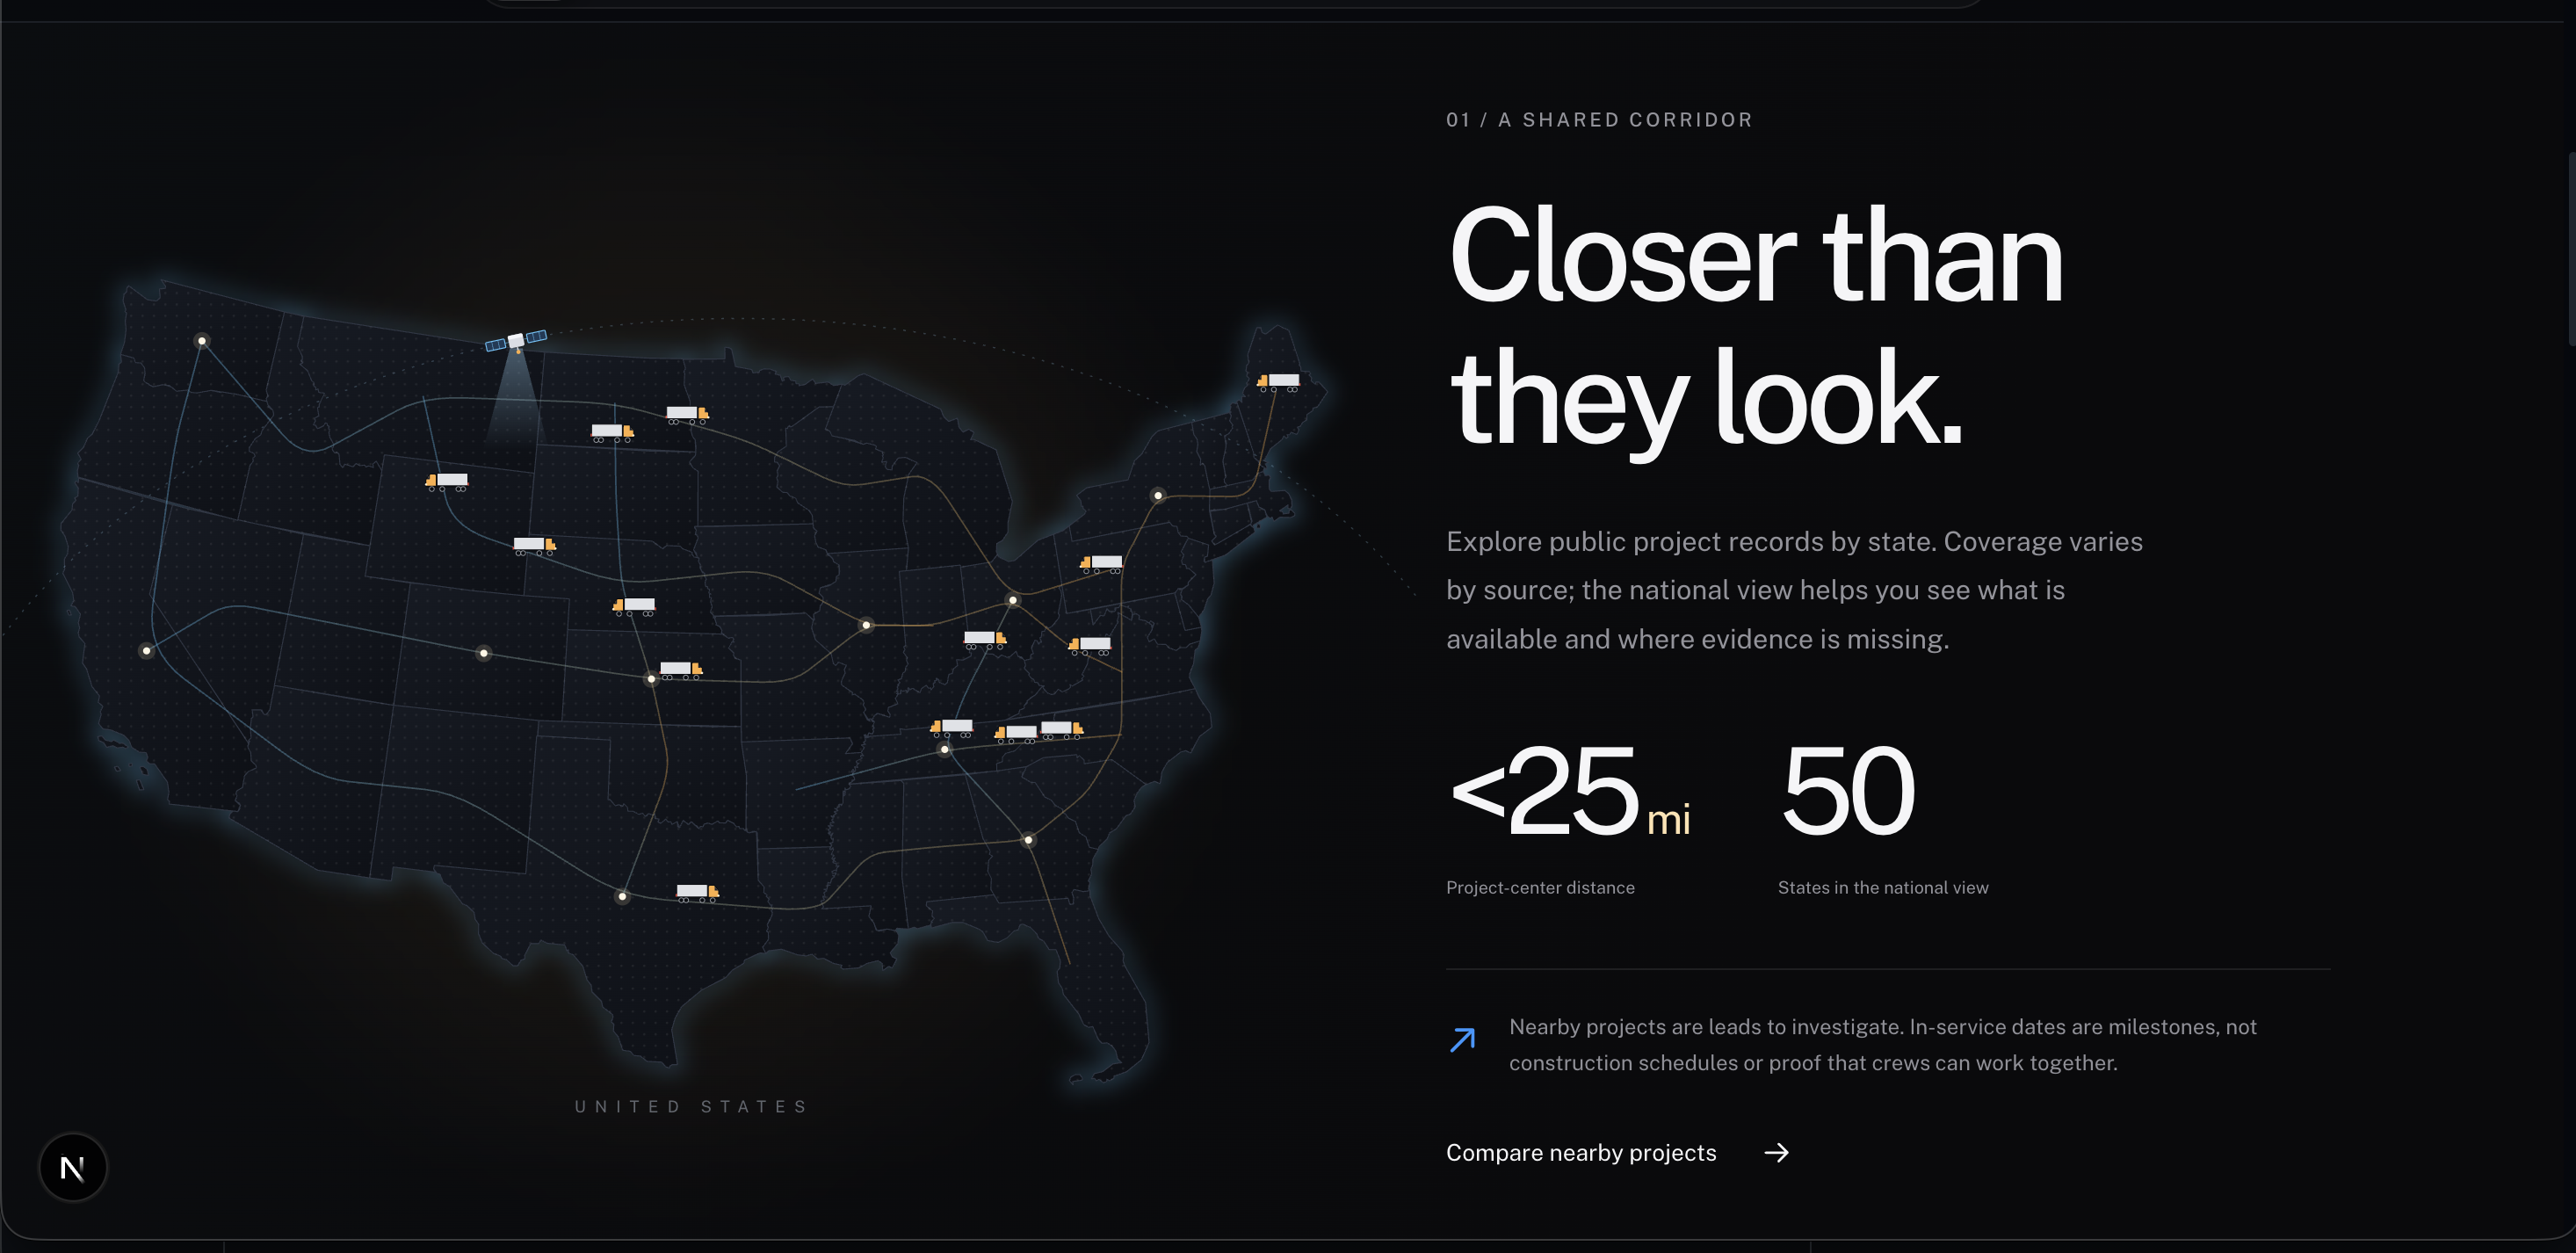
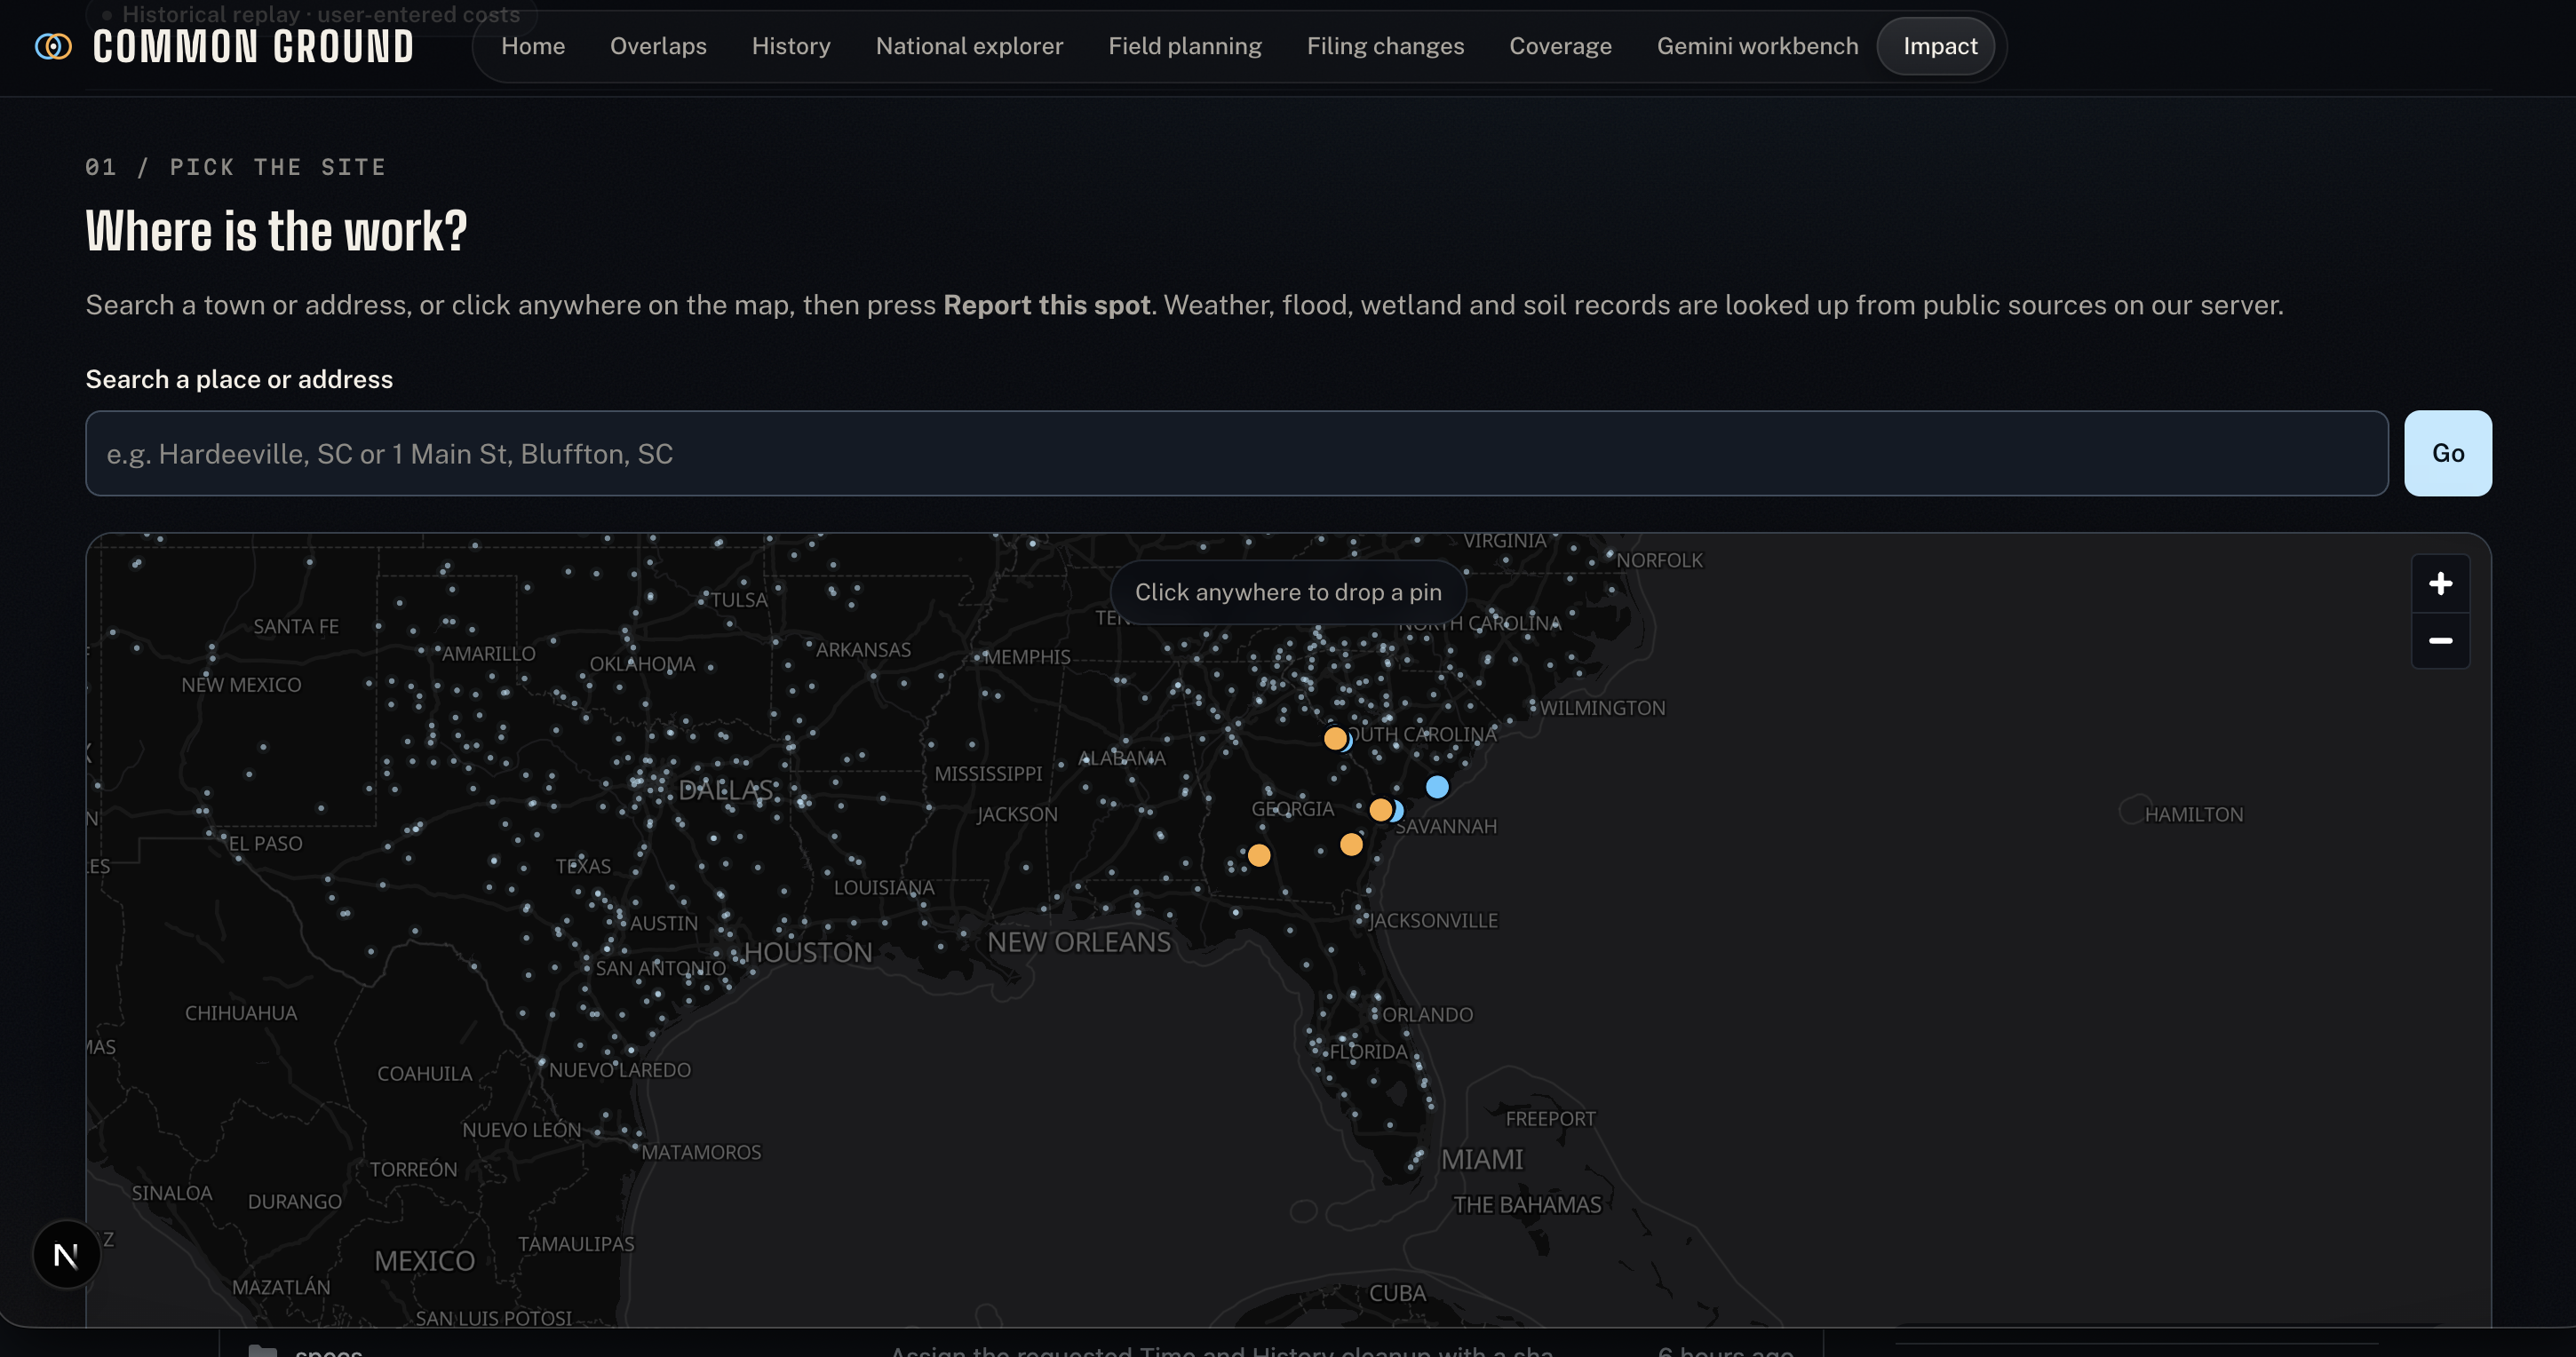
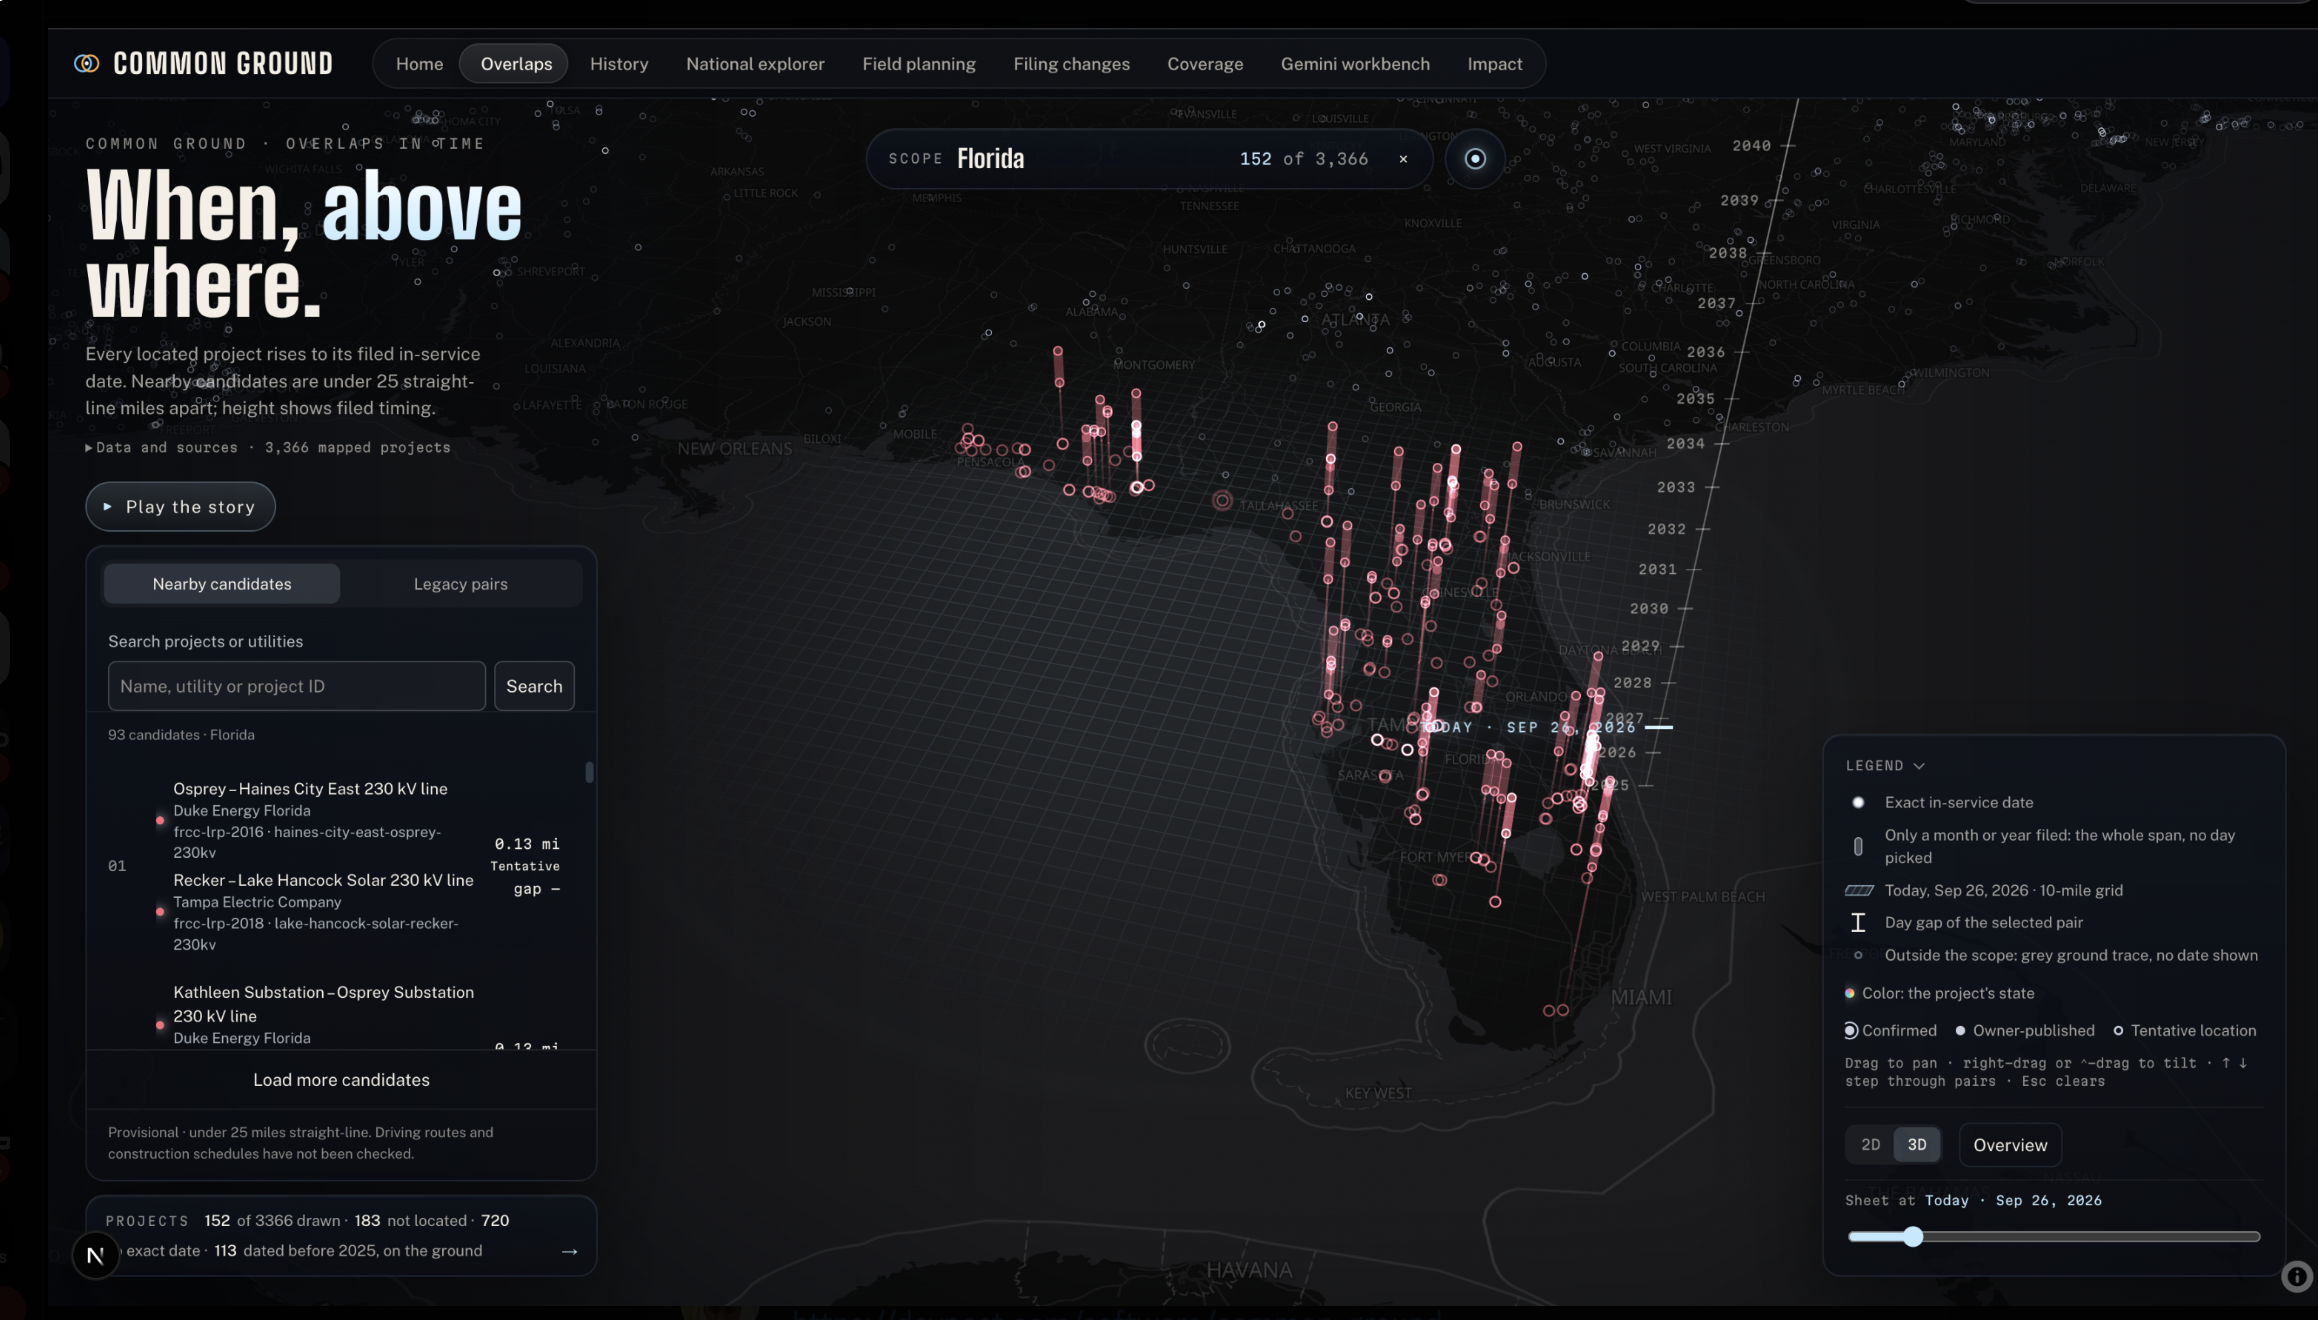
Common Ground helps transmission planners and project managers find nearby planned power-line projects that may be worth coordinating around. Users can explore projects on a map, compare distance and timing, and trace important information back to the original filing. The map shows where planned work clusters, and the time view shows whether those projects overlap in their construction windows. Proximity alone isn't enough, because two projects in the same area ten years apart aren't a real opportunity.
How we built it
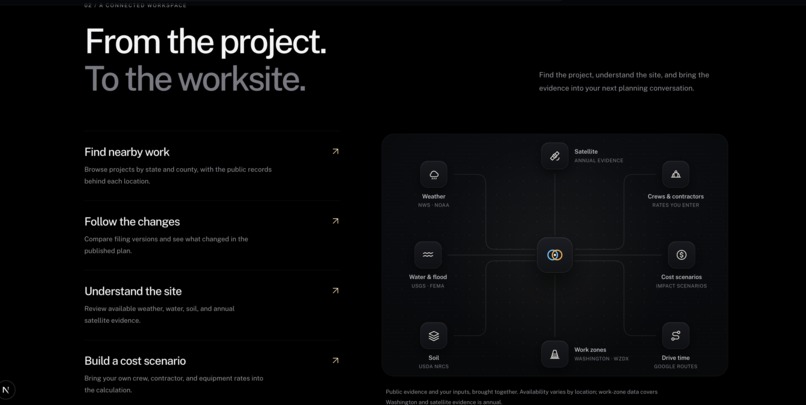
We used Next.js, React, and TypeScript for the frontend, MapLibre and Three.js for the map and time view, Python for document processing and project matching, MongoDB Atlas for data, and Gemini for structured extraction and evidence-based briefs. We split the work across testing, core logic, UI/UX, and data collection.
Challenges we ran into
The hardest part was understanding an unfamiliar problem space while working with messy public data. None of us had worked in utilities before, so we had to learn enough about transmission planning to tell which outputs would actually help a planner. The filings themselves were inconsistent: locations were often described in words instead of coordinates, and dates were rarely more precise than a quarter or a year. That's a big part of why we required a source for every extracted field.
Accomplishments that we're proud of
We are proud of building a working, polished interface on top of real public planning data rather than a mock dataset. We also built an evidence workflow where users can trace information back to its source instead of relying on unsupported AI output. In a field where a bad assumption can cost real time and money, that traceability is what would make a planner willing to trust the tool. We're also proud of the time view, because showing overlap in time as clearly as overlap in space is what makes the results useful rather than just interesting to look at.
What we learned
We learned a lot about teamwork, cleaning and filtering real-world data, and building across a data pipeline, database, and frontend. Most of the effort went into the data, not the code: deciding what to trust, what to discard, and how to handle vague or incomplete information. We also learned that AI agents are most useful when their output can be reviewed and verified. Treating the model as a fast first pass, rather than a final answer, shaped how we designed the whole system.
What's next for Common Ground
We want to pull in more utilities and grid interconnection queues, put a rough dollar figure on each coordination opportunity, and, most importantly, sit down with actual transmission planners. We'd also like to move from approximate project locations to full route geometry, so we can detect true corridor overlap instead of just nearby projects. The planners are the ones who can tell us which of these matches are worth acting on, and that feedback matters more than any feature we could add on our own.
Built With
- atlas
- chatgpt
- claude
- cursor
- gemini
- grok
- javascript
- kimik3
- mongodb
- python
- restapi
- three.js
- typescript
- vercel



Log in or sign up for Devpost to join the conversation.