-

Combo-Graph-Tiger-Graph-Studio-and-Queries
-

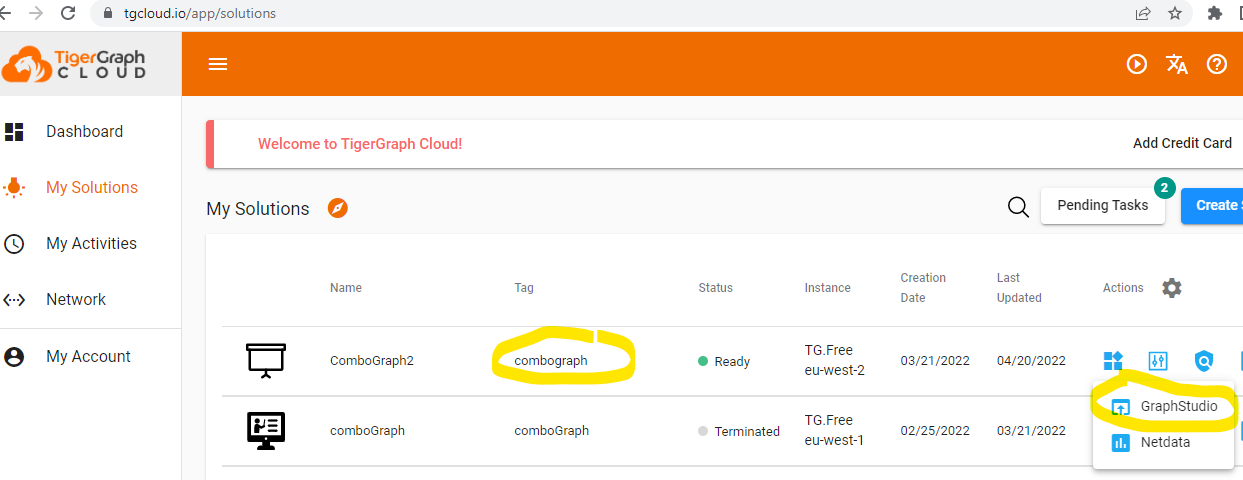
combo-graph-tgcloud-graph-studio
Inspiration
The TigerGraph Challenge is a good opportunity to combine the desire to participate to worldwide global challenge and at same time discover/showcase TigerGraph technologies (Cloud, GraphStudio,...)
What it does
Enable to find entity relationship between SDG (Sustainable Development Goal) subjects/ OKR topics related to the SDG, thanks to graph browsing and also thru frontend
How we built it
The TigerGraph recommendations to manage Graphical Database have been respected
extraction of metadata from publication reports and store in csv format
extract metadata from publication reports, organize them in meaningful intelligence, and store in appropriate csv data files, to enable data science manipulation.
graph design schema
map data to graph
load data
graph browse and find patterns
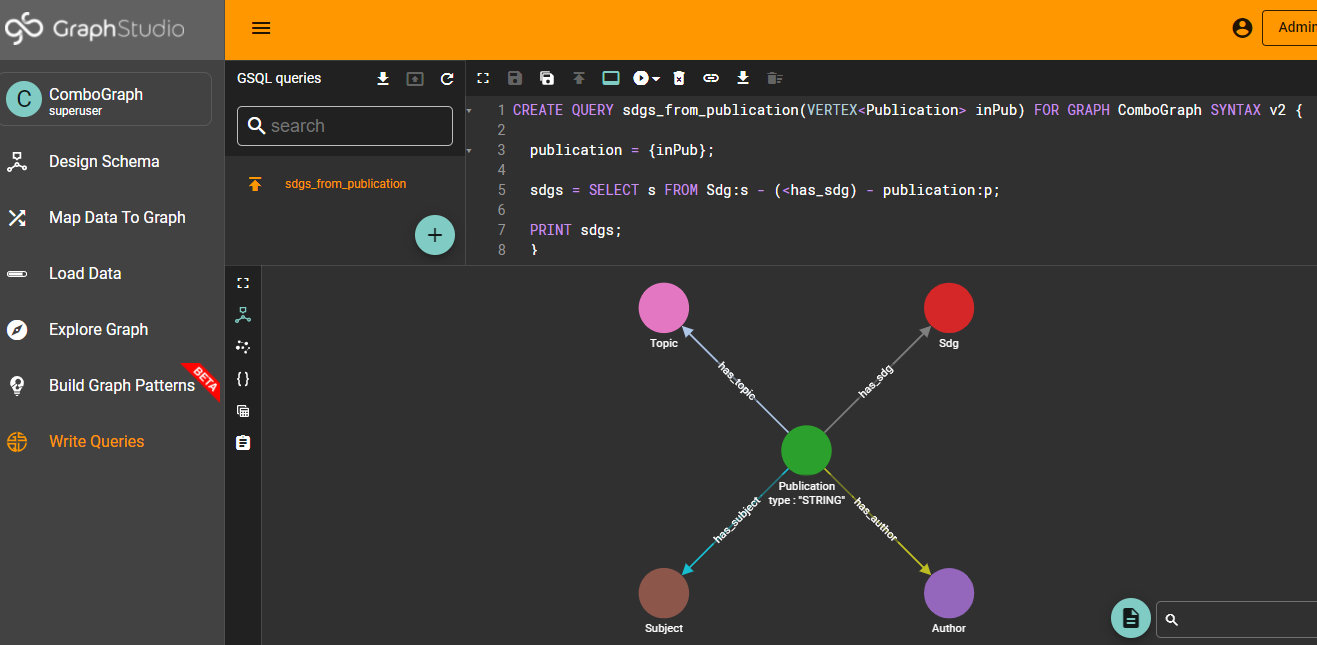
write queries
sdgs_from_publication : get list of SDG (Sustainable Development Goals) for a given publication
pub_sdg_max_count : return the publication with most (max) SDG count in descending order
subjects_from_publication : get list of SDG (Sustainable Development Goals) Subjects for a given publication
pub_sdg_subjects_max_count : return the publication with most (max) SDG subjects count in descending order
topics_from_publication : get list of OKR Topics for a given publication
pub_topics_max_count : return the publication with most (max) OKR topic count in descending order
Challenges we ran into
Accomplishments that we're proud of
Observed Results for first 10 publications for each of 17 Sustainable Development Goal
Publication identified with uri "https://openknowledge.worldbank.org/handle/10986/35218" got ** 4 SDG ** max count
Publication identified with uri "https://openknowledge.worldbank.org/handle/10986/35434" got ** 29 subjects ** max count
Publication identified with uri "https://openknowledge.worldbank.org/handle/10986/37016" got ** 24 topics** max count
What we learned
- TigerGraph graphic capabilities power
What's next for ComboGraph
- Add more GSQL queries
Log in or sign up for Devpost to join the conversation.