-
-
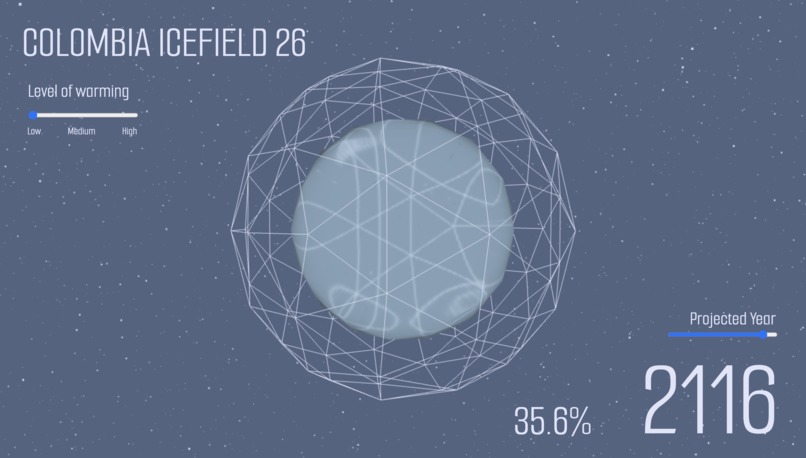
After toggling
-
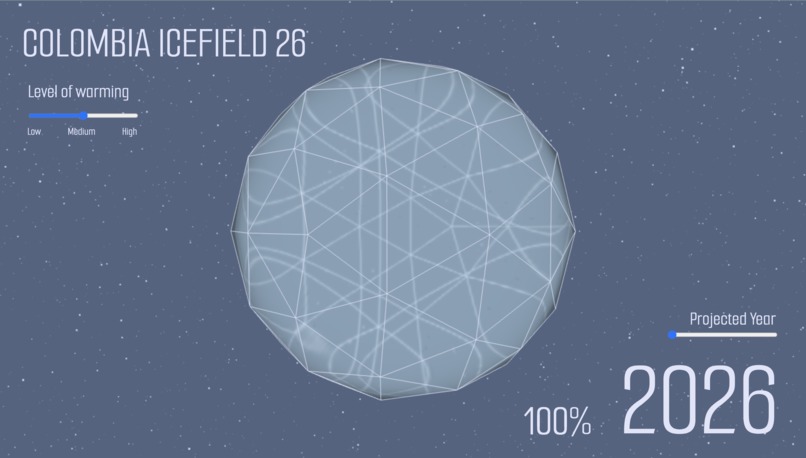
Initial Screen
COLOMBIA ICEFIELD 26
Inspiration
This year, I travelled to Alberta in Canada and was lucky enough to visit the Athabasca Glacier, part of the Colombia Icefield. It was such an amazing experience and I was shocked to hear that there were predictions that the glacier would be completely gone by 2100. This inspired me to make this simple, visual model. I found the glaciers and the ice field extremely interesting and wanted to learn more about them.
What it does
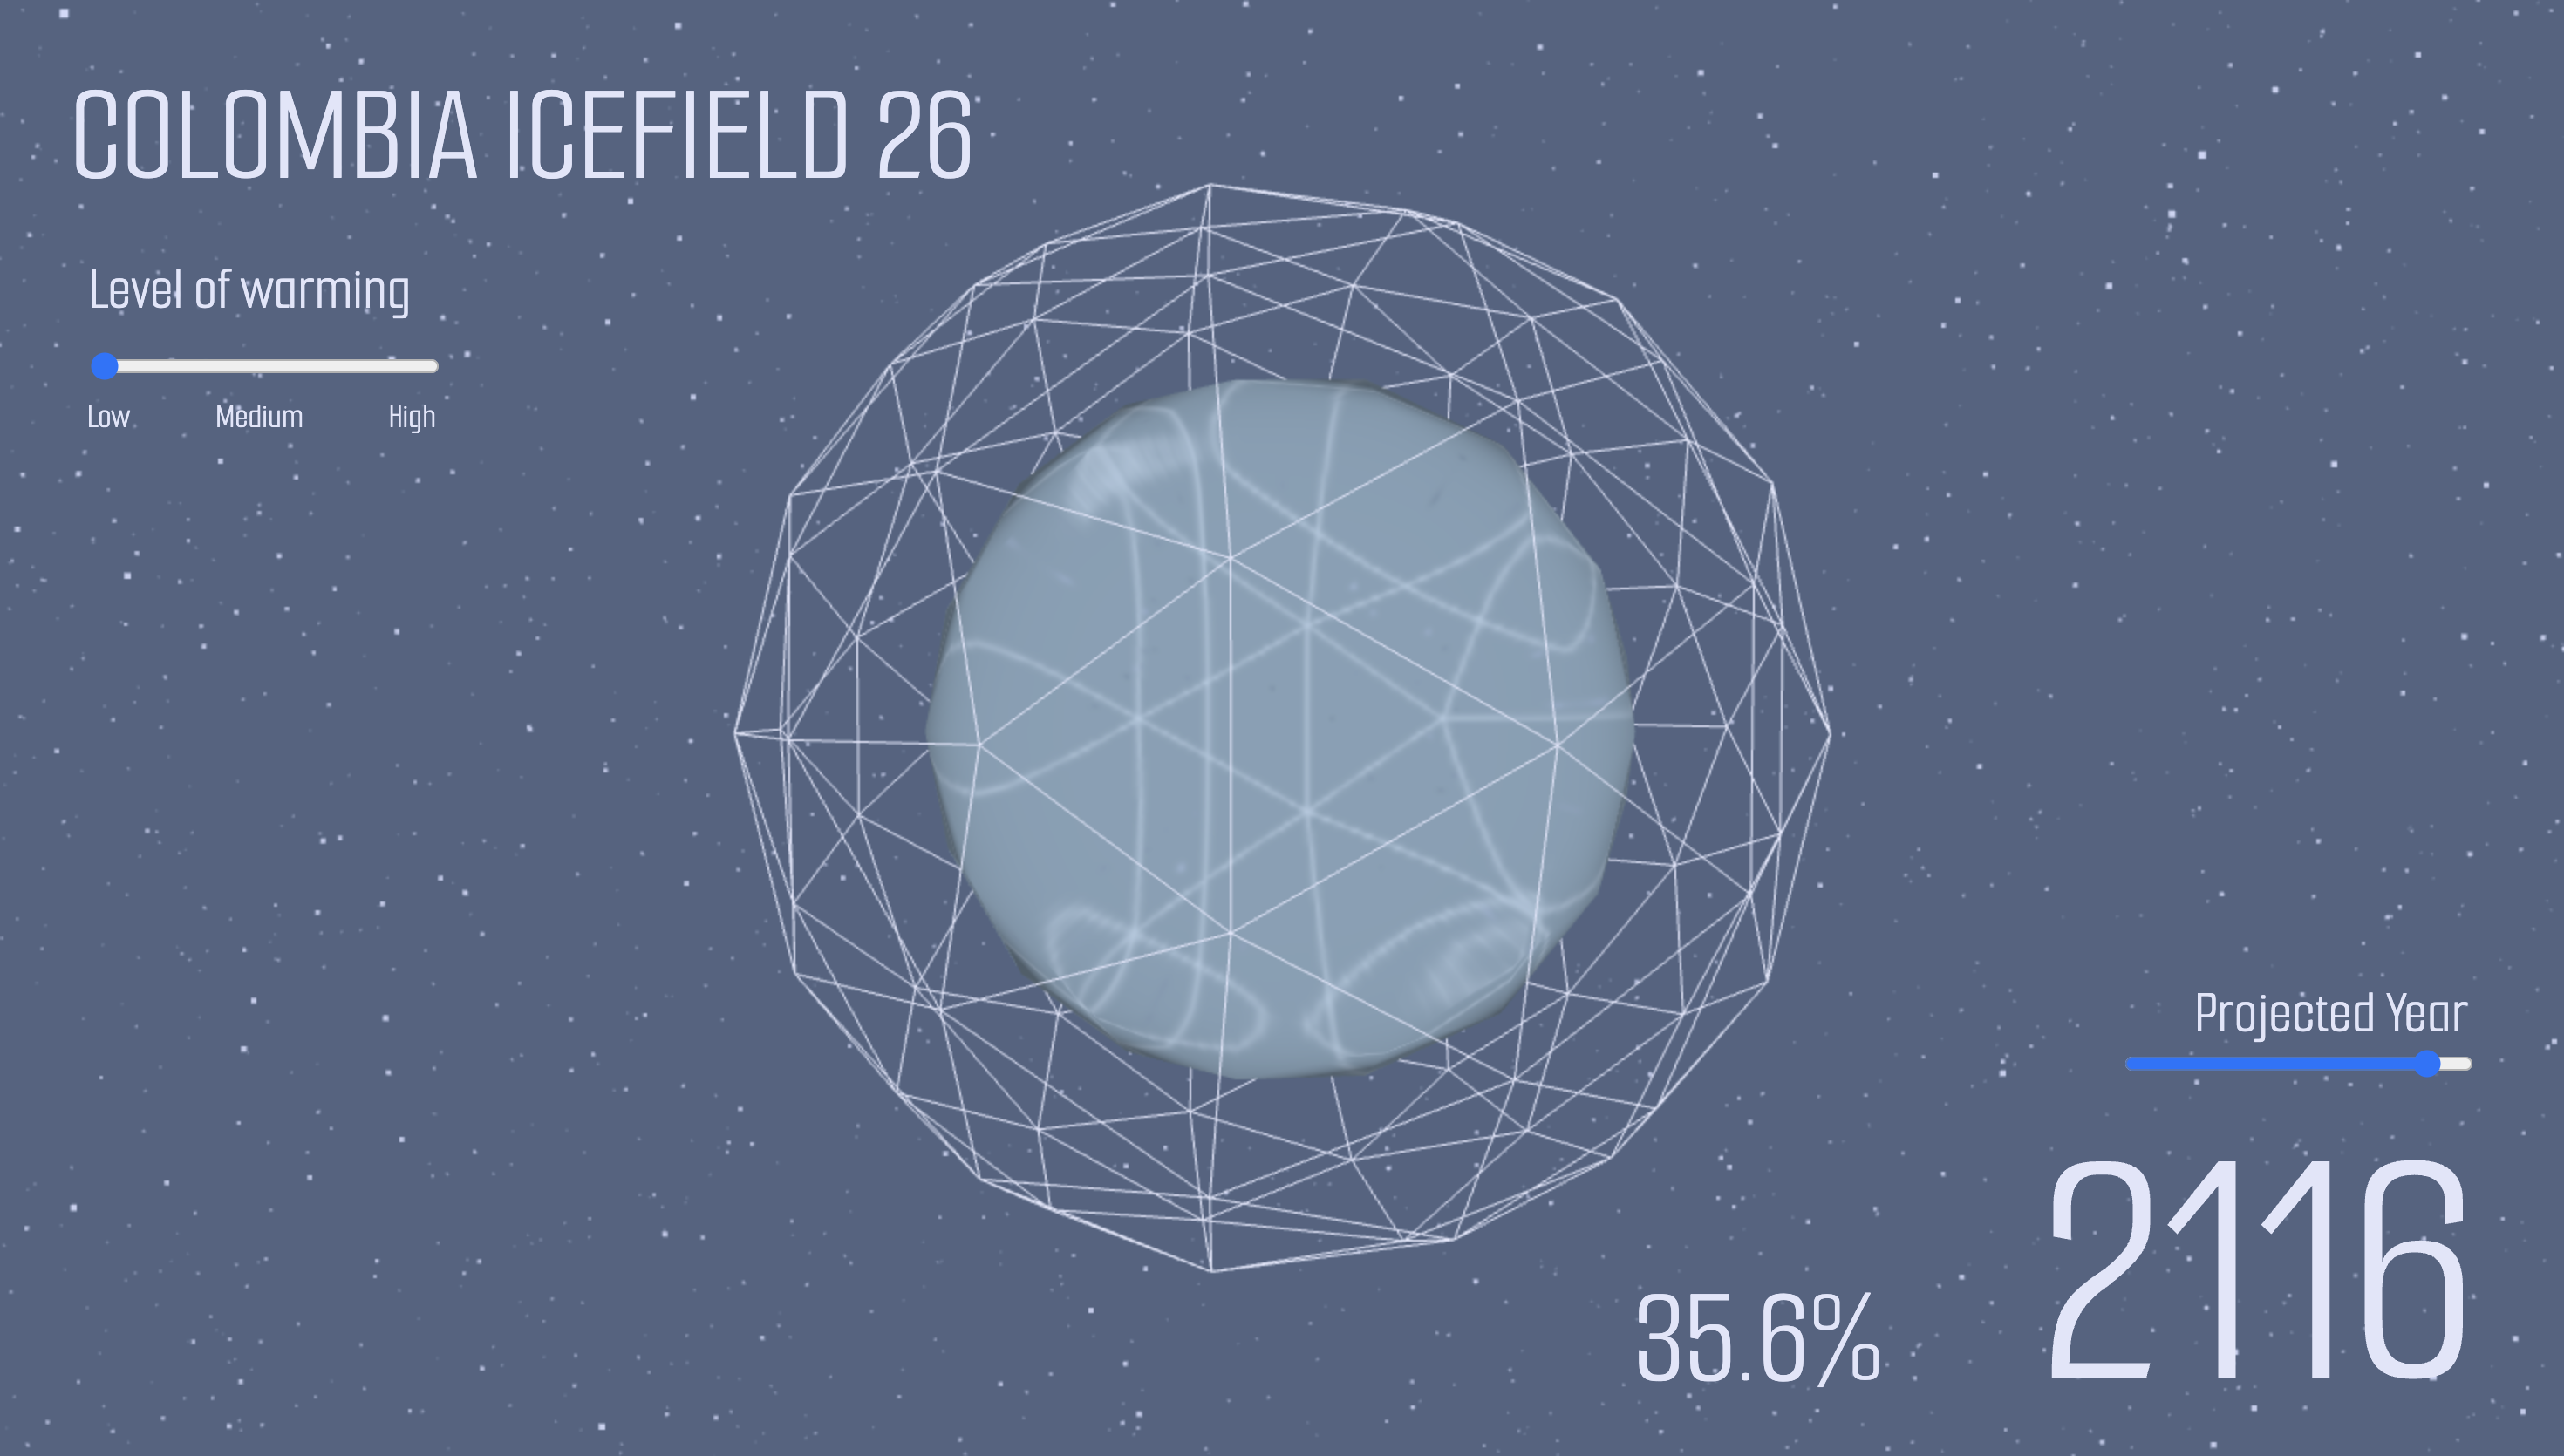
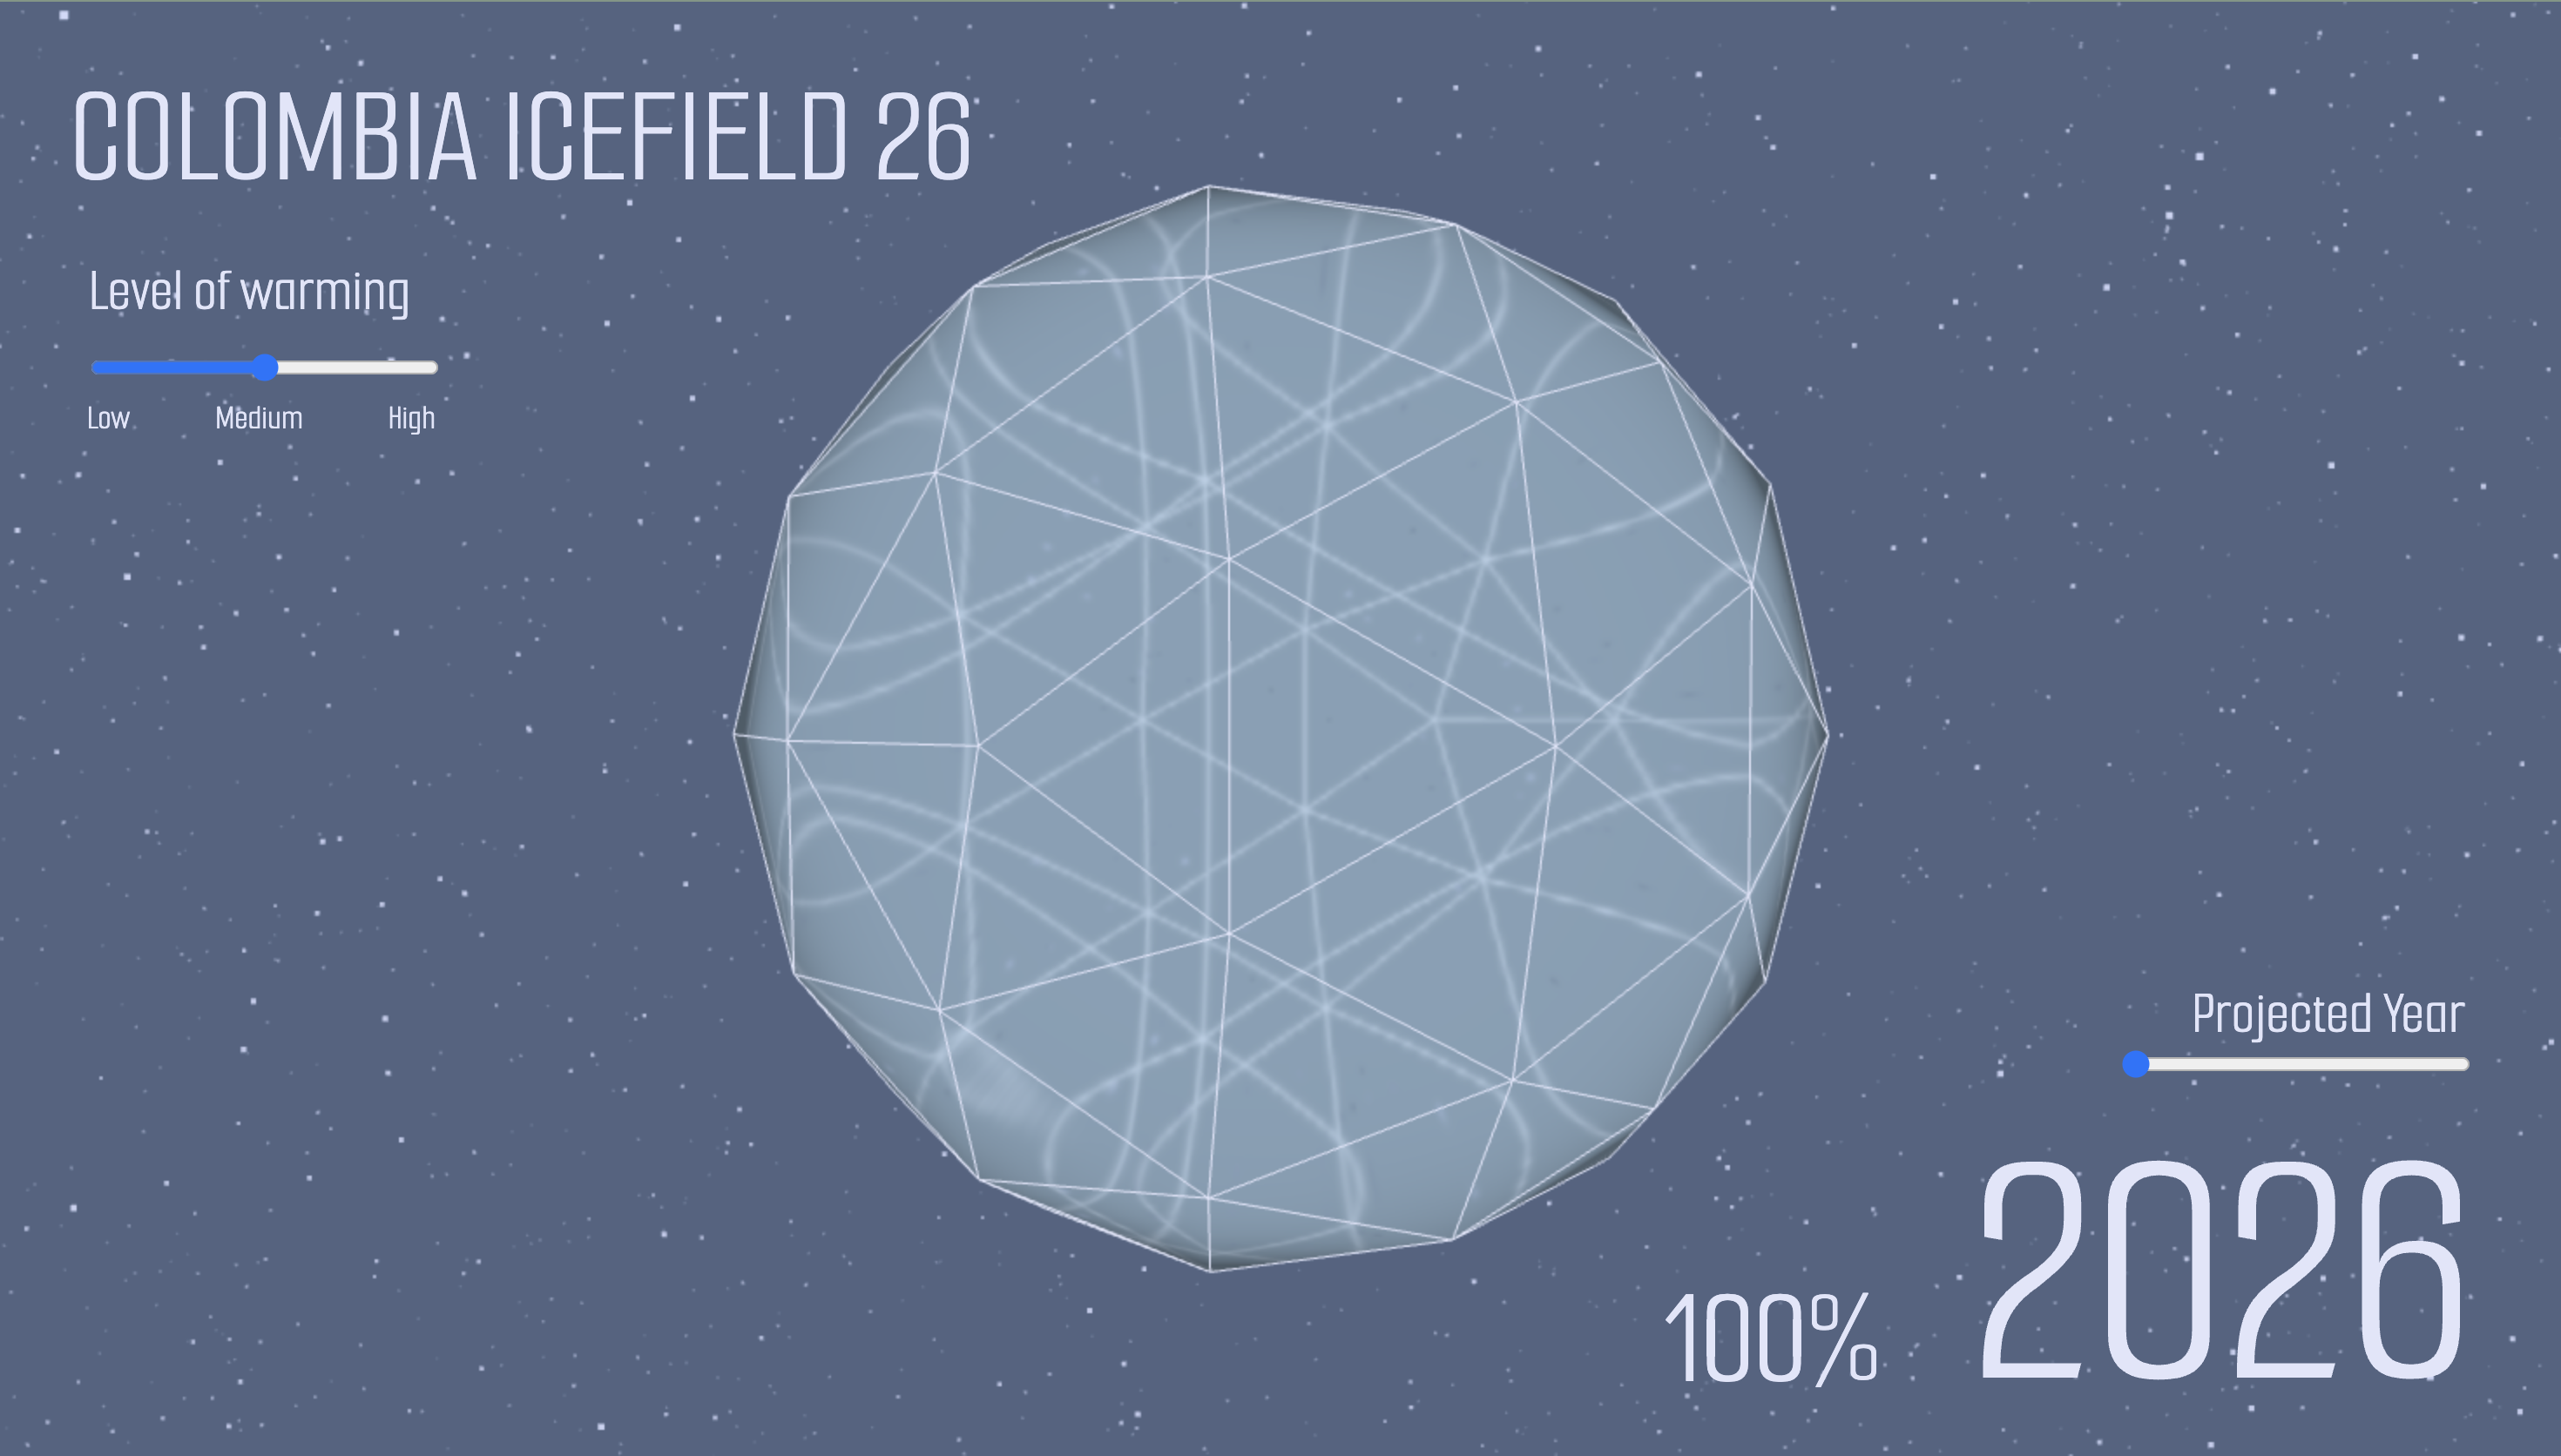
Colombia Icefield 26 is a model based on my research and calculations that shows my predictions of the decrease in mass of the ice field in Alberta over the next 100 years. There are three settings based on the Representative Concentration Pathways (RCP) climate scenarios set out by the Government of Canada GoC-ClimateScenarios (May need to refresh the page for it to load) which are represented as low, medium and high levels of warming; medium being the most likely prediction of global temperature increase. After choosing a setting, you can scroll through the next 100 years and watch as the ice ball shrinks showing a visual representation of the prediction.
How I built it
As I am completely new to Web.GL and Three.js, I began this project using a youtube tutorial WebGL-Tutorial to start the foundations of the project. A large part of the project was then research and working out the maths to create my predictions. Here are some of my sources and a summary of the maths used MyGoogleDoc. I then coded this into the project and added some other features such as the stars in the background to add depth. To do this I used some Youtube tutorials, Claude AI and help from websites such as StackOverflow.
Challenges I ran into
I ran into many problems when working out the maths needed for this project. This was mainly due to the lack of data available for the Alberta region but also just trying to take into account as many factors as possible to predict without over complicating the project. I am very proud of the final prediction and the visualisation to show it. I feel it is a simple way to represent such a complex issue.
What I learnt
I learnt a lot about Three.js and WebGL as I have never coded in them before. I have definitely been inspired to do more projects and experiment with both languages. Of course, I also learnt a lot about the melting of the glaciers, the change in temperature of the Earth and all the factors affecting these.
What's next for Colombia Icefield 26
Originally I'd planned to make the website much more interactive, with more animations and other features. I unfortunately didn't have time to do a lot of this as I didn't realise how much time the maths and research of the project would take. I plan to develop the project further and add the features as I had originally intended. My goal website would be one that not only shows the visual prediction, but one that really impacts the user. Sharing information about the glaciers, what is causing them to melt so rapidly and what that means for our futures.

Log in or sign up for Devpost to join the conversation.