Inspiration
Coming from a Small School like Fordham LC to a school with such a huge campus made me question how different life would be here. At Fordham there are days when I want to go to the gym when is not crowded, so since it is a very small campus I just walk over to the gym and check, but if I had to do that at Yale and walk 15 minutes back to my room if there was a Stampede of People in the gym at that time I would be pissed!
What it does
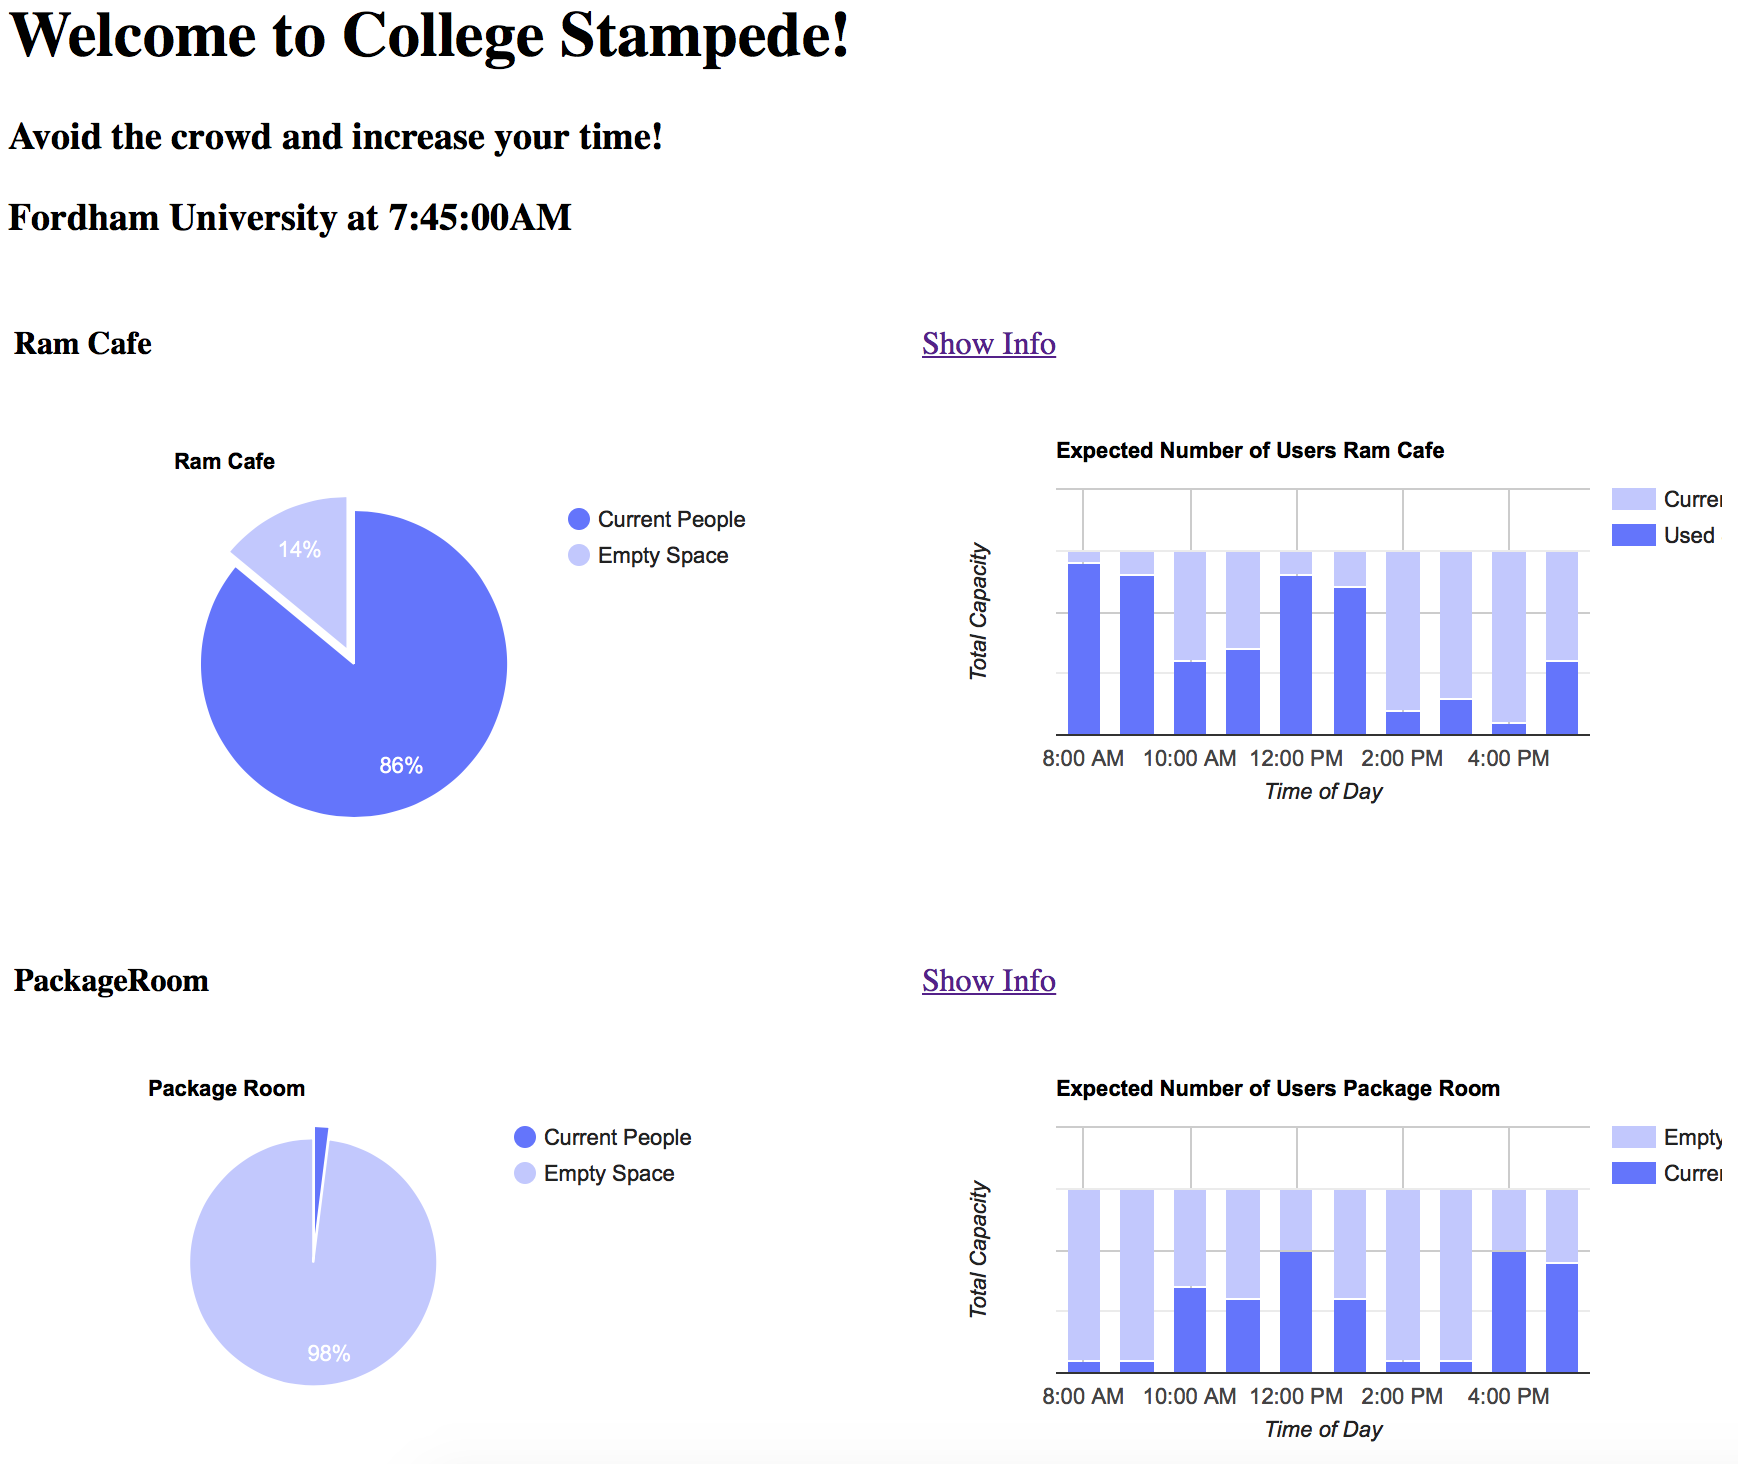
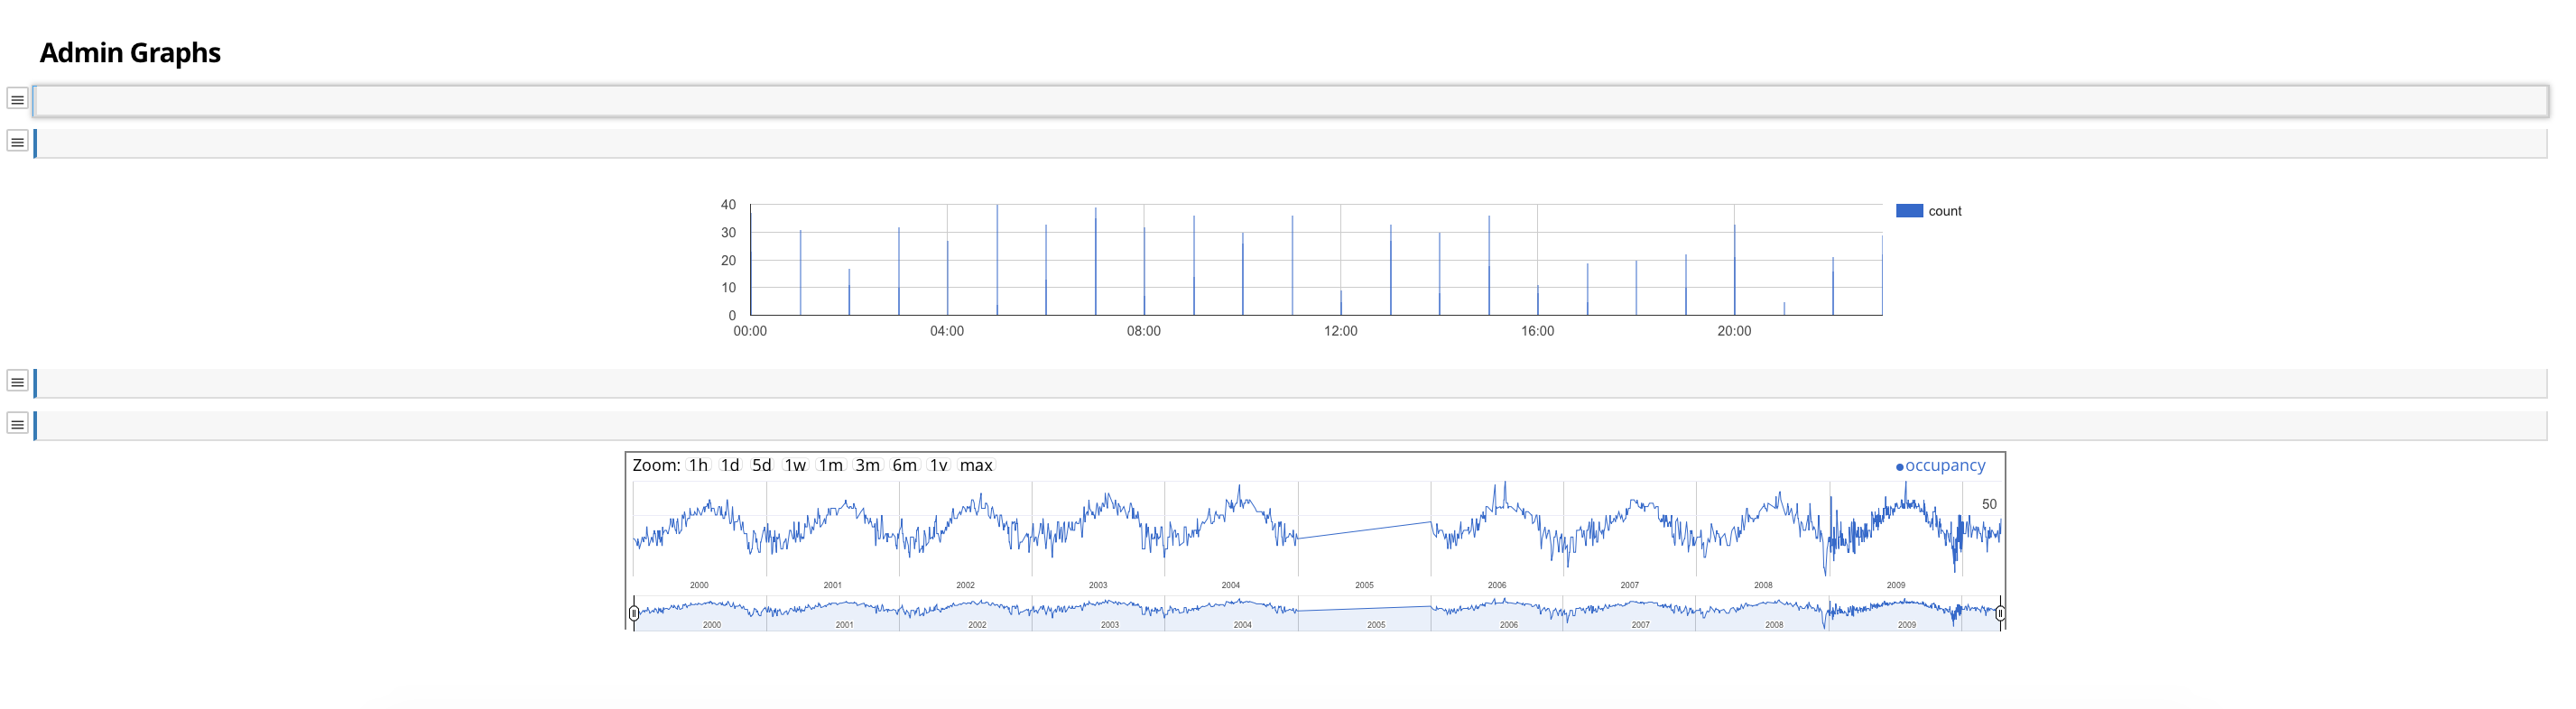
College Stampede is useful for both students and administrators at any college campus. It tracks the number of users connected to a specific router; therefore, being able to determine their position on campus through a Raspberry Pi Zero, and then sends that information to the cloud, where it is displayed in real-time for students to know how crowded the cafeteria, the gym, or the library are before going. The information is also stored in Google Cloud Storage. From there it is sent to Big Query for Data Regressions with Machine Learning and then displayed through Datalab for Administrators to discover things such as the places on campus that require more or less staffing. The Machine Learning Analysis is also used to display an estimated number of people that will visit a certain place in the coming hours.
How I built it
Raspberry Pi's sends information directly to the website's javascript and to Google Cloud Storage through JSON files. The main website with real-time information and predictions of students was written from Scratch with HTML and Javascript. The data that received to make the graphs comes after the query-scheduled Machine Learning analysis of the data in BigQuery. Various DataLab notebooks receive the BigQuery Data and include different options for the appropriate analysis of it
Challenges I ran into
At first, my intention was to create the product in DataLab since it is run through Python's Jupyter Notebooks, which I was already familiar with, also I was going to create the graphs by sending JSON or CSV files to the Notebook. However, the DataLab Python notebook is impossible to embed into a website and the way it is built is very oriented towards passing the data through BigQuery
Accomplishments that I'm proud of
Although encountering the adversities mentioned before, I was able to make the best out of both. I learned Javascript, and I was able to implement all that I wanted to implement in Python but using a new language. I learned how to use BigQuery and the machine learning capability of it, therefore, my final idea including expected number of users turned out to be more appealing than the original due to this adversity.
What I learned
JavaScript, Google Cloud APIs
What's next for College Stampede
Test complete integration with a network of Raspberry Pis
Note from Tenzin:
Be sure to check out the website! Since we couldn't integrate raspberry pi into the project, please press the button and press send for the data to dynamically change. A button push represents another person entering a router network. Also towards the end, we all agreed that a live twitter feed is also really helpful for students in a rush. Many universities have transport across campus and Fordham is no different. Fordham's ram van's social media is really interactive and gives live updates for whoever can't take the stress of not knowing the possible threat of a delay. Also Fordham IT is always on twitter responding to students desperate to hand in a last minute assignment on a black board that keeps crash. So we embedded the twitter timeline for these two University services to help any visitors in a rush.
Built With
- google-ai
- google-bigquery
- google-cloud
- google-datalab
- html5
- javascript
- python
- sql

Log in or sign up for Devpost to join the conversation.