Inspiration
Every offseason, coaching staffs and fans watch hundreds of players enter the transfer portal with almost no systematic way to evaluate fit. As a big college basketball fan, I wanted to build something that actually used statistical analysis to create data-driven matches for teams and players.
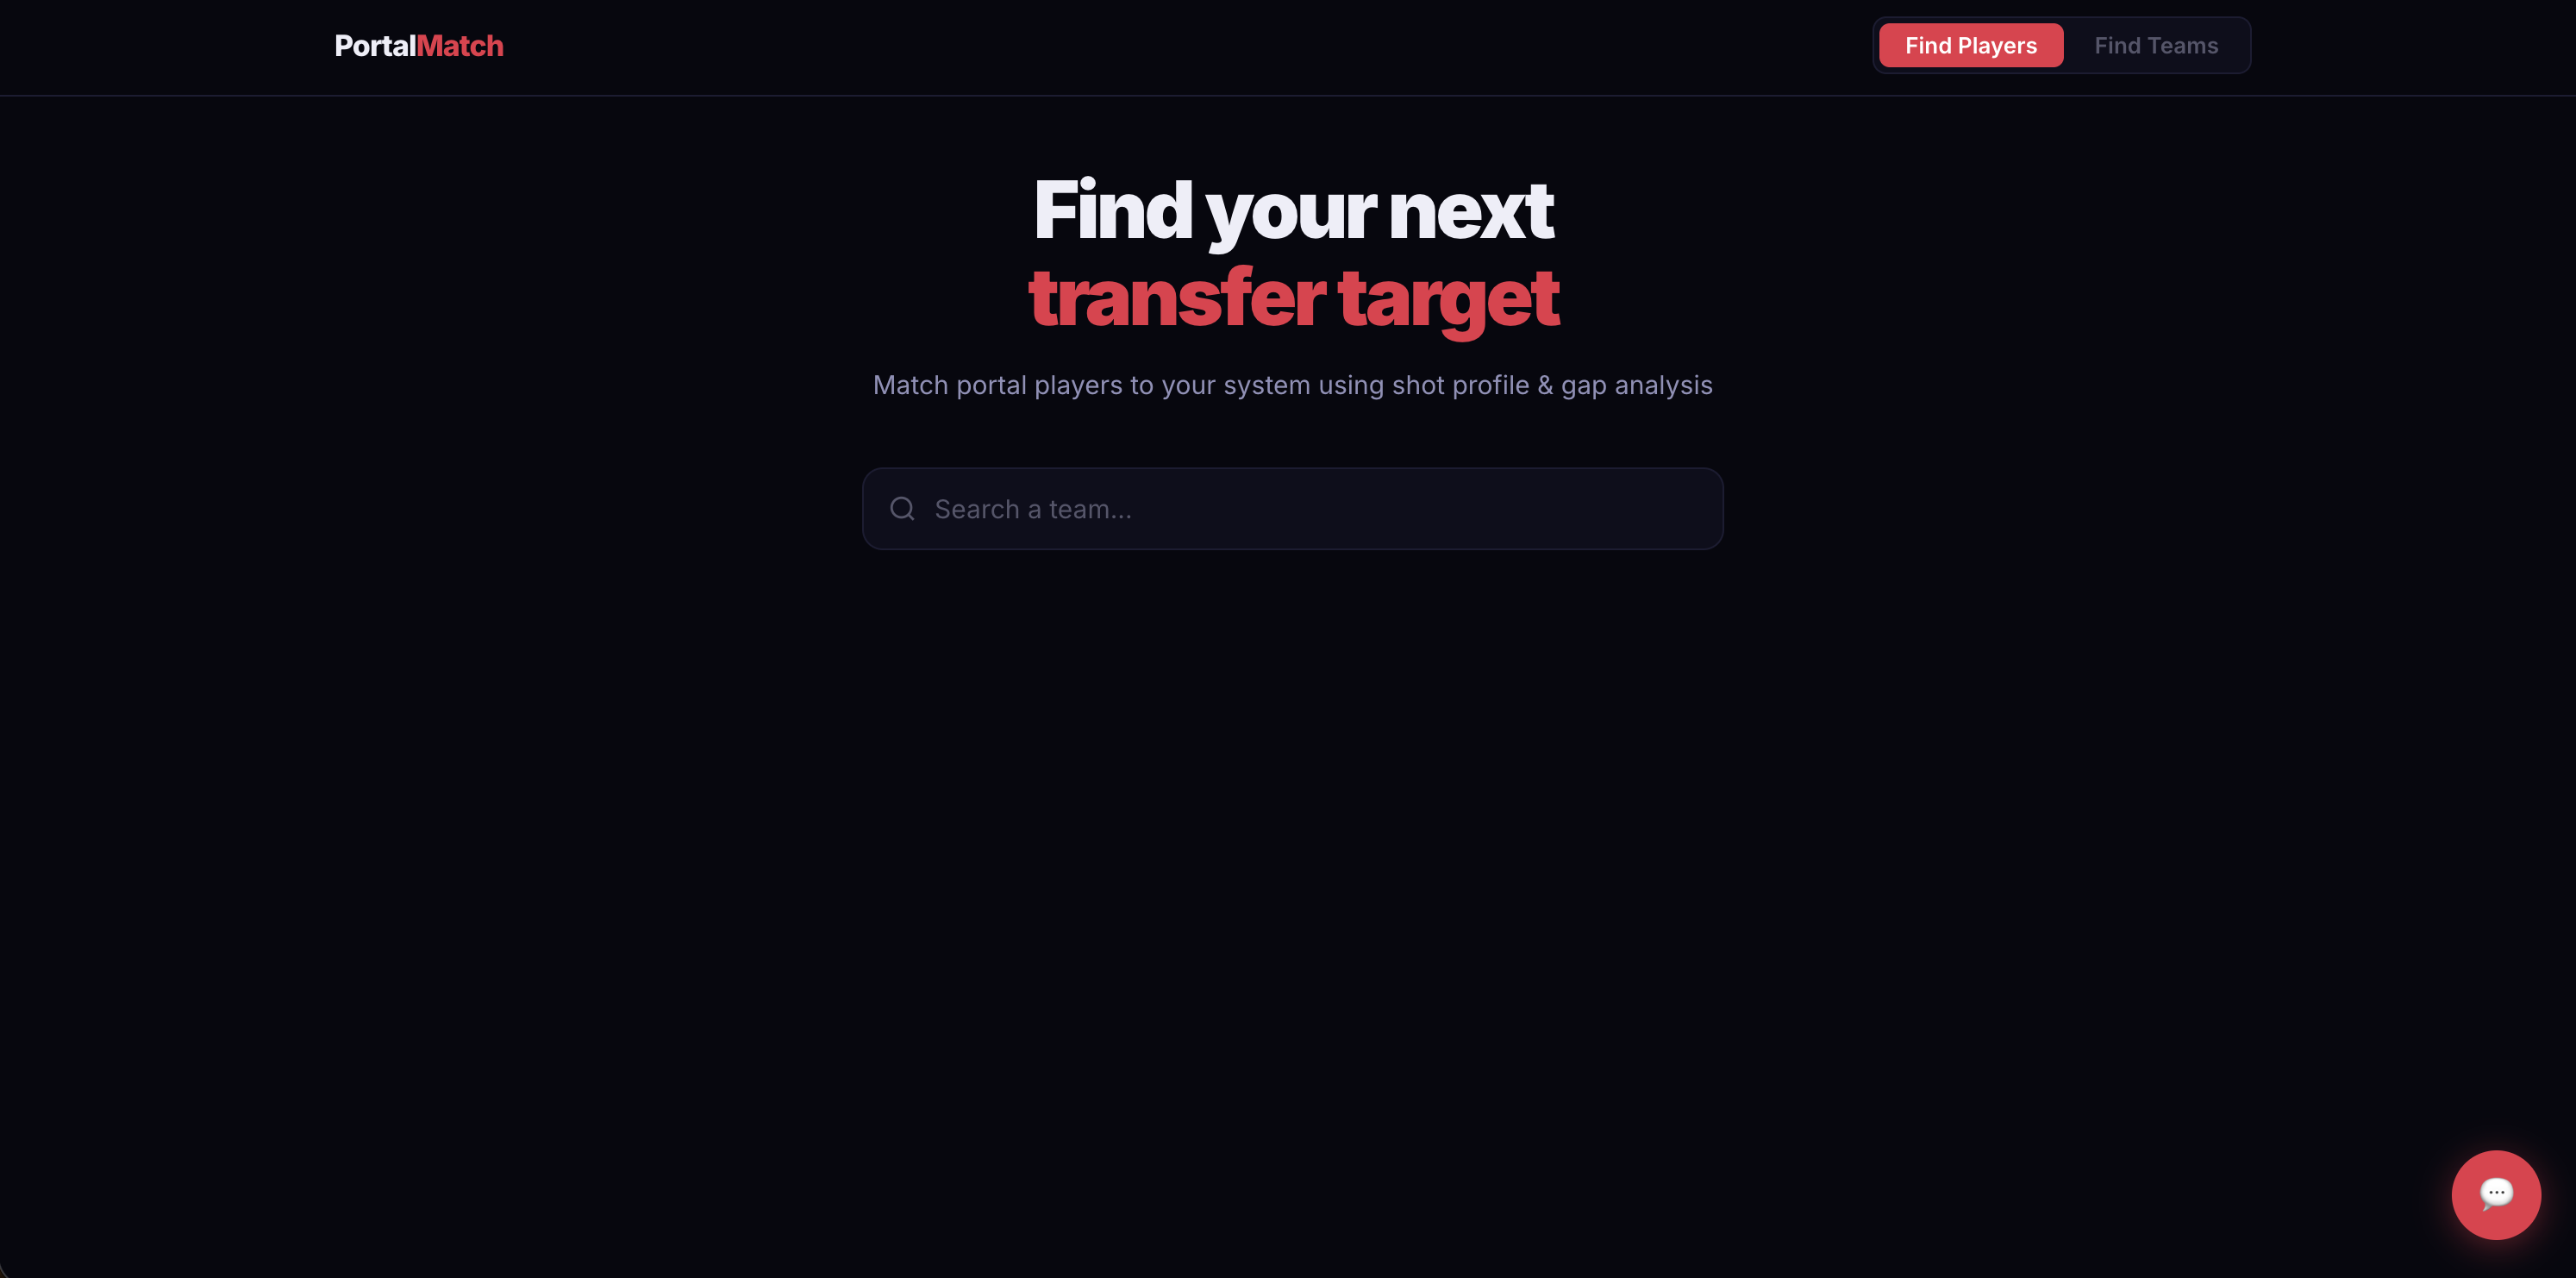
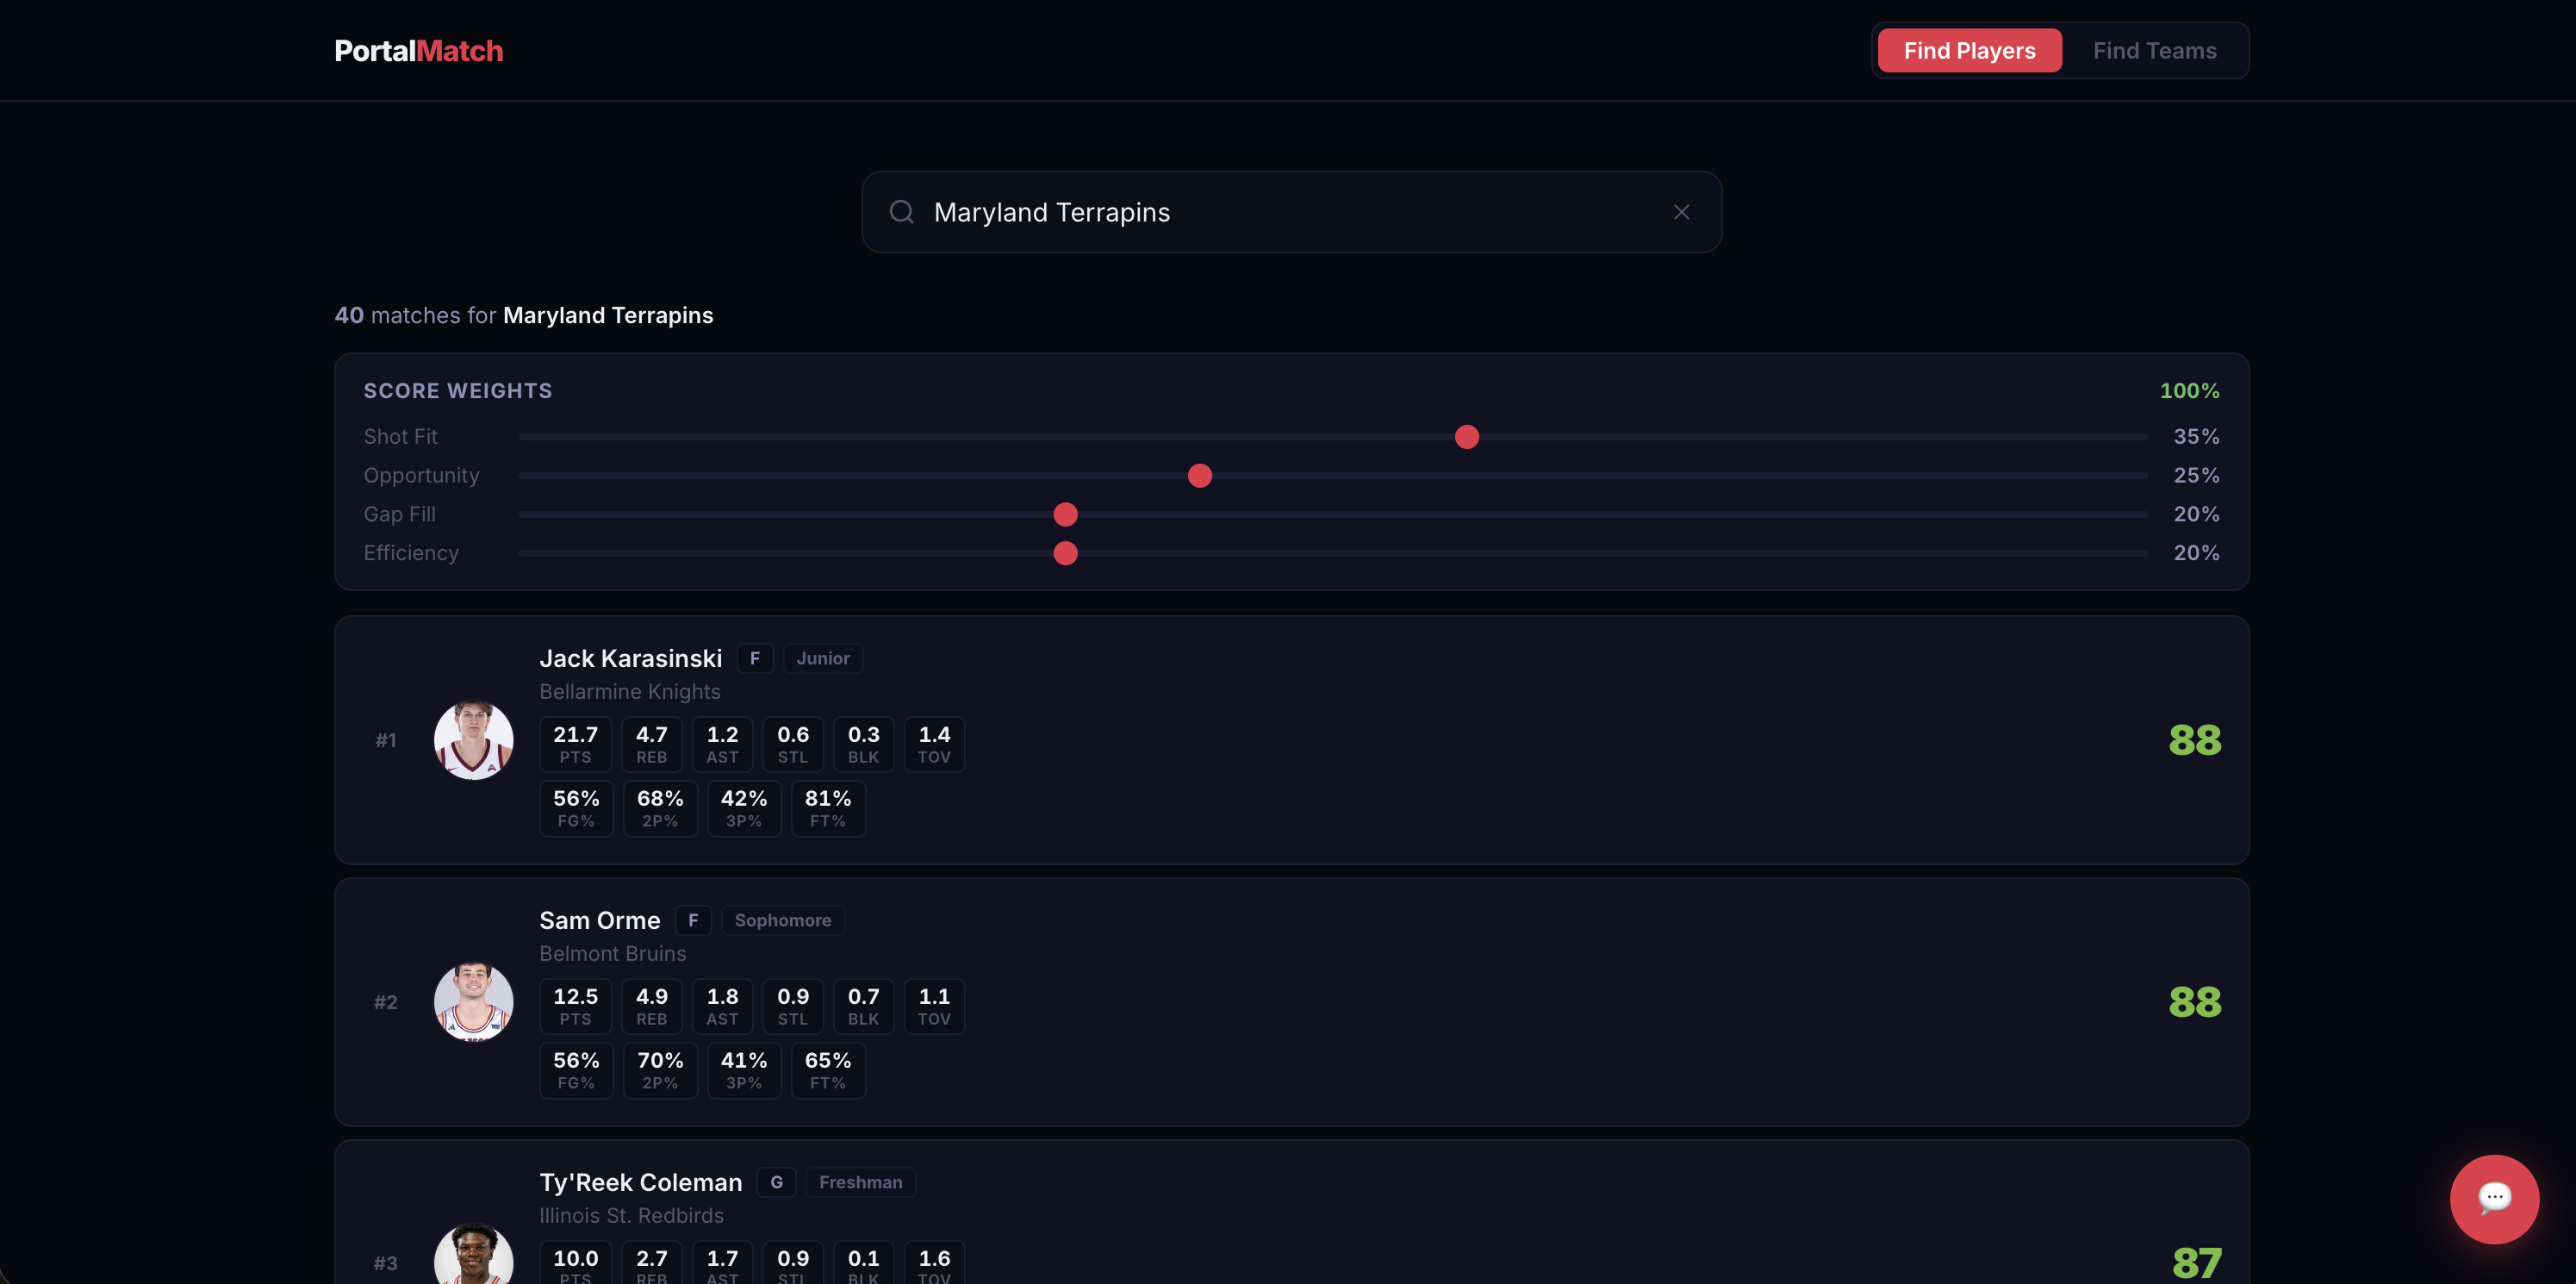
What it does
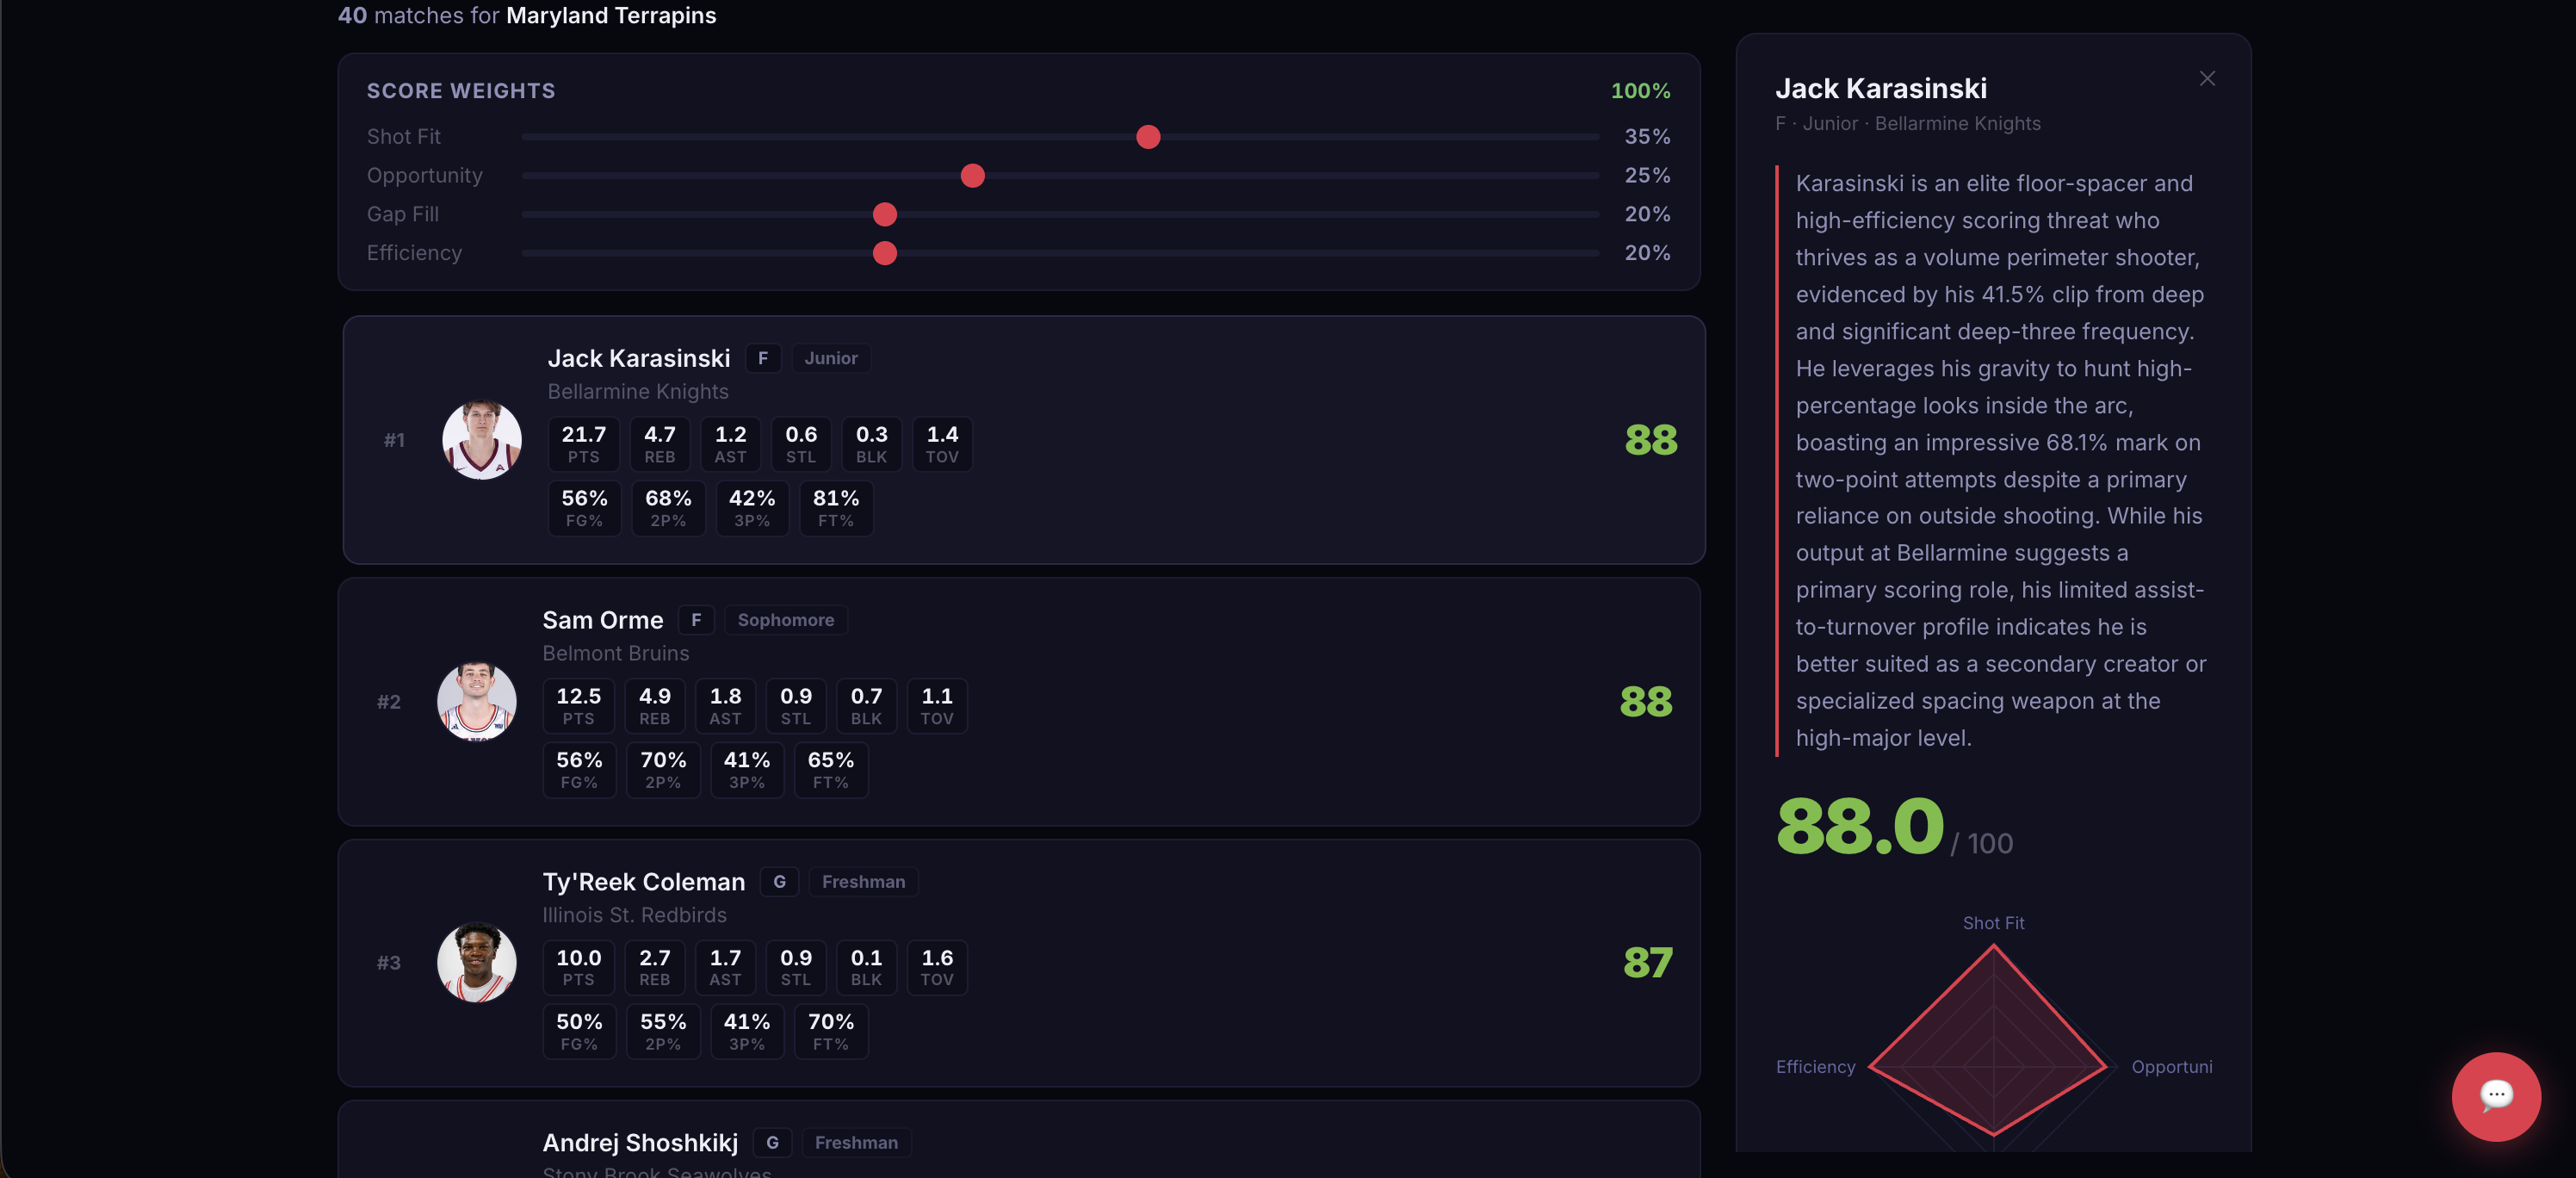
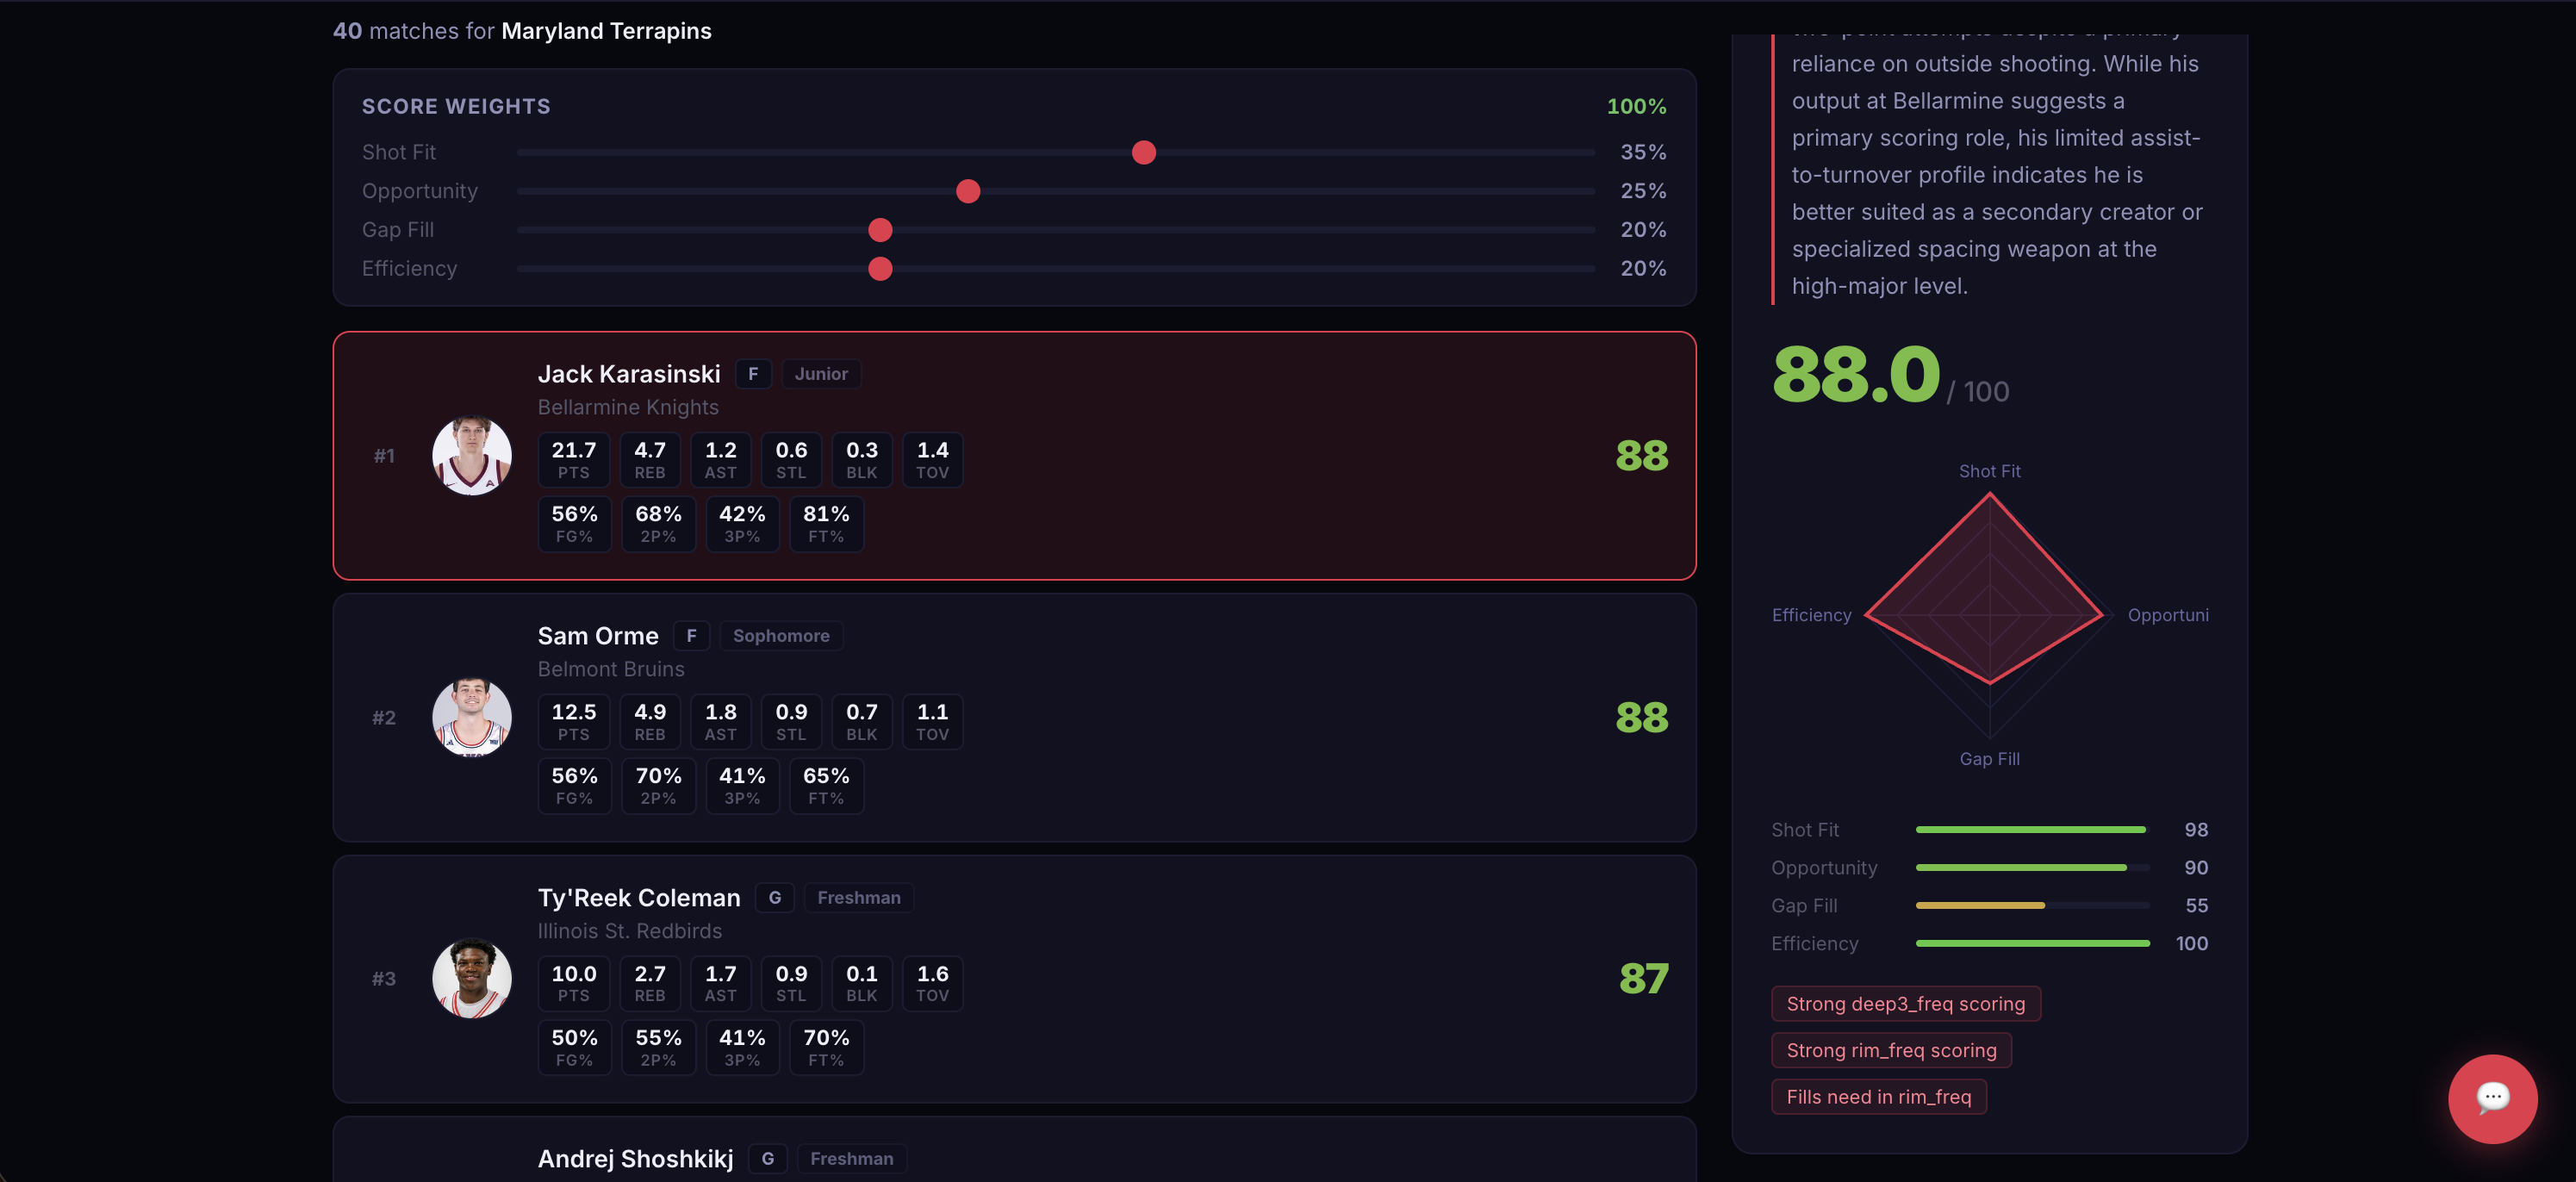
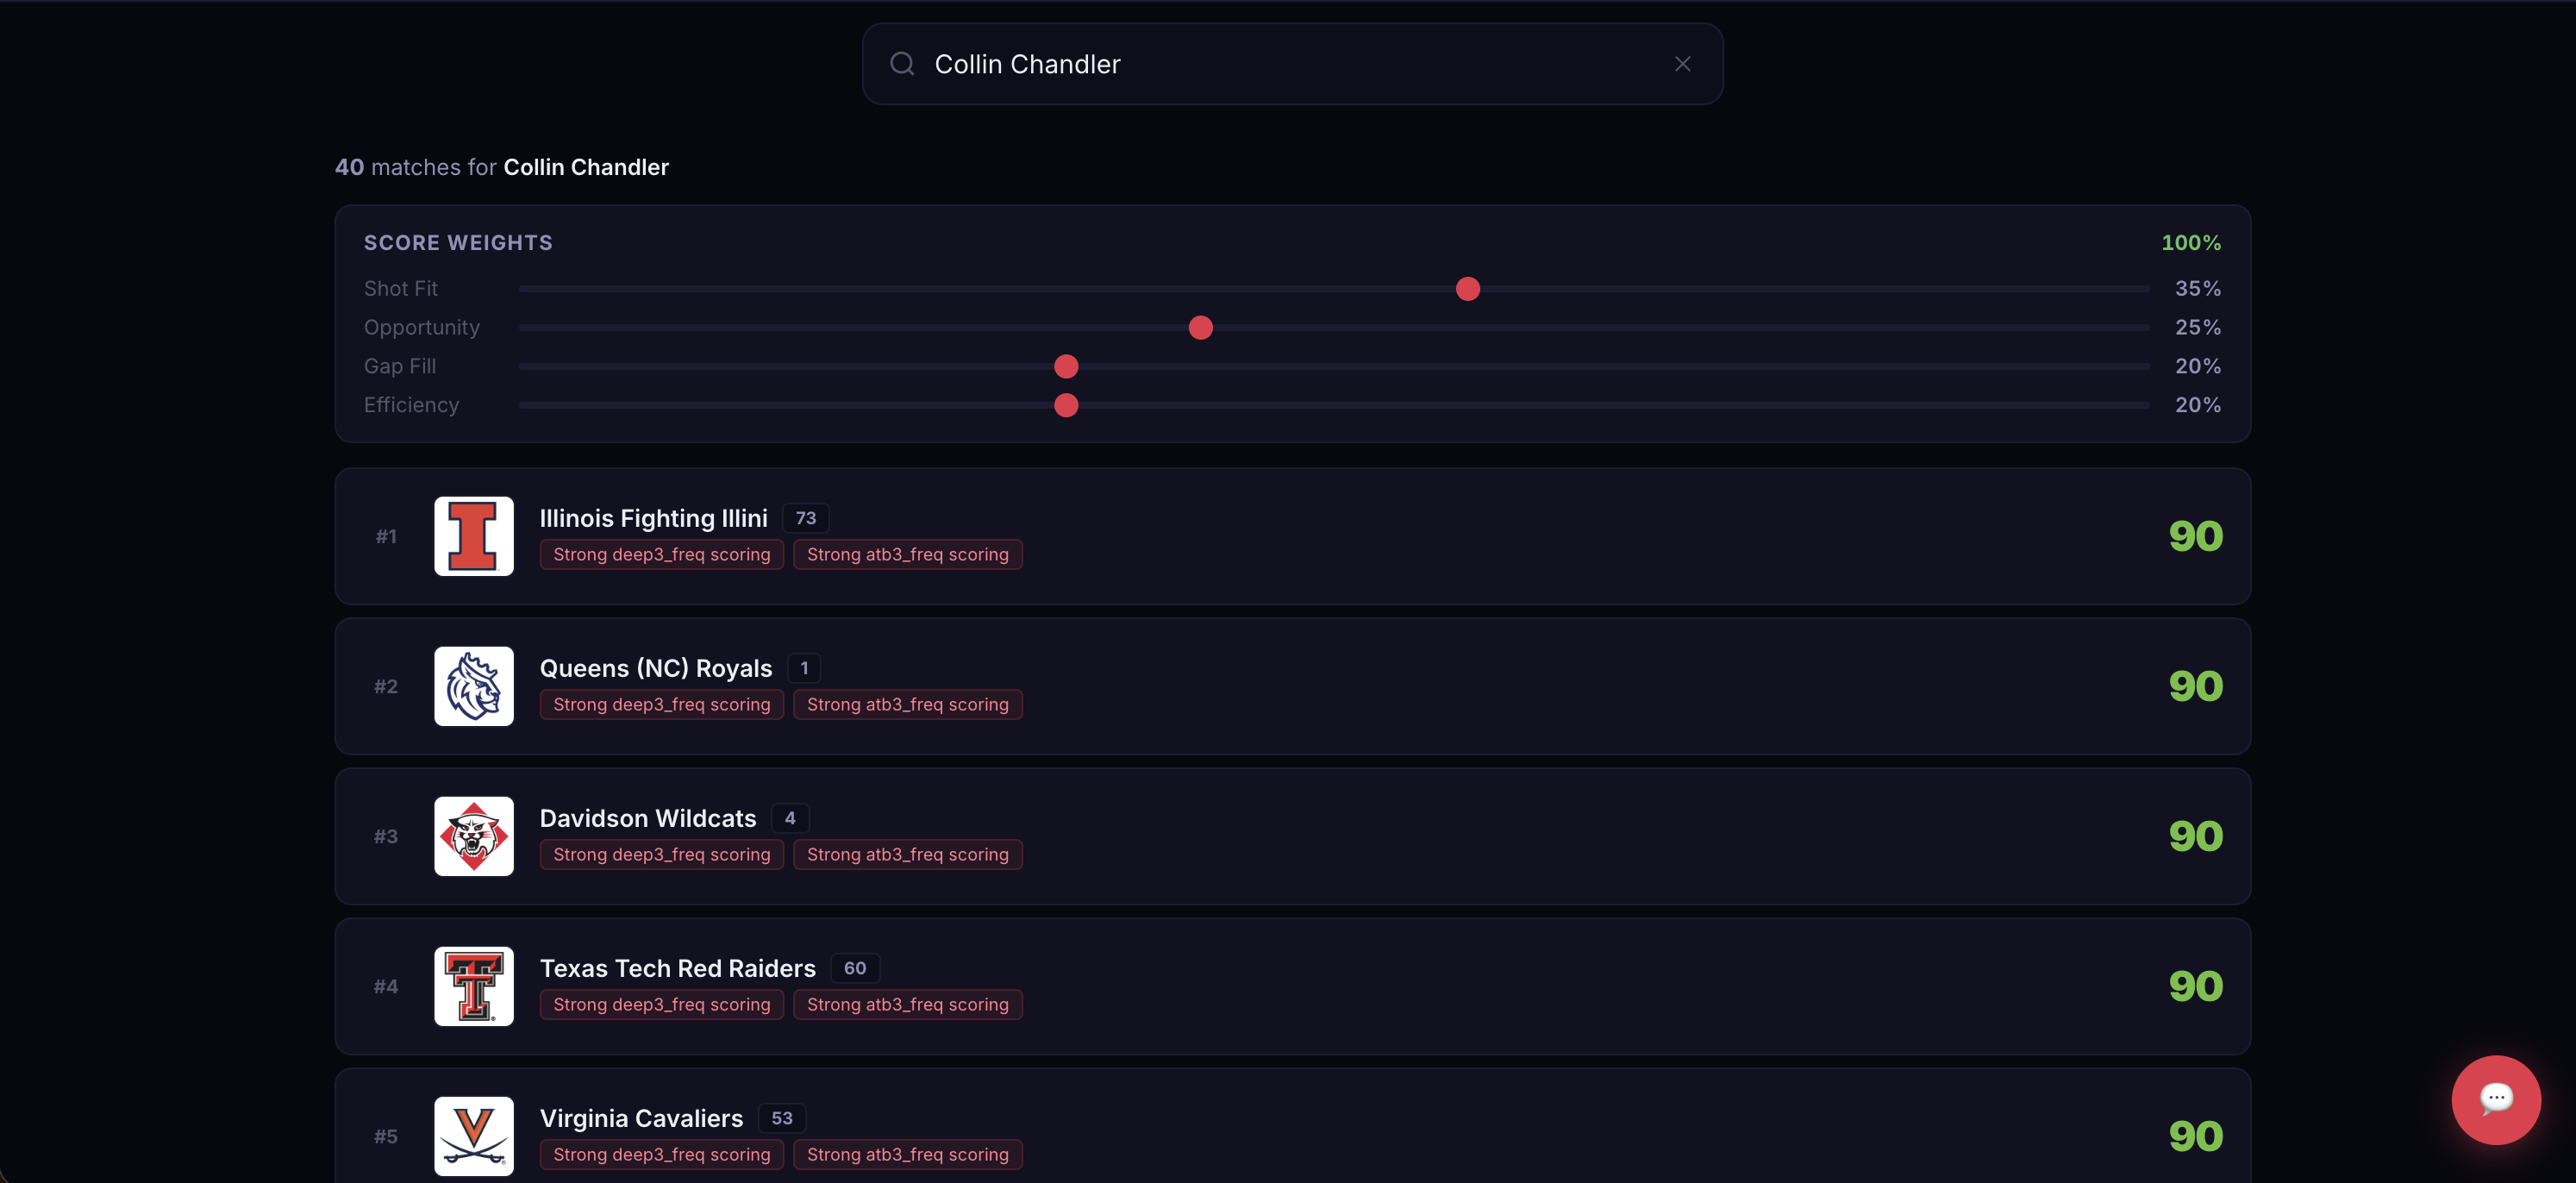
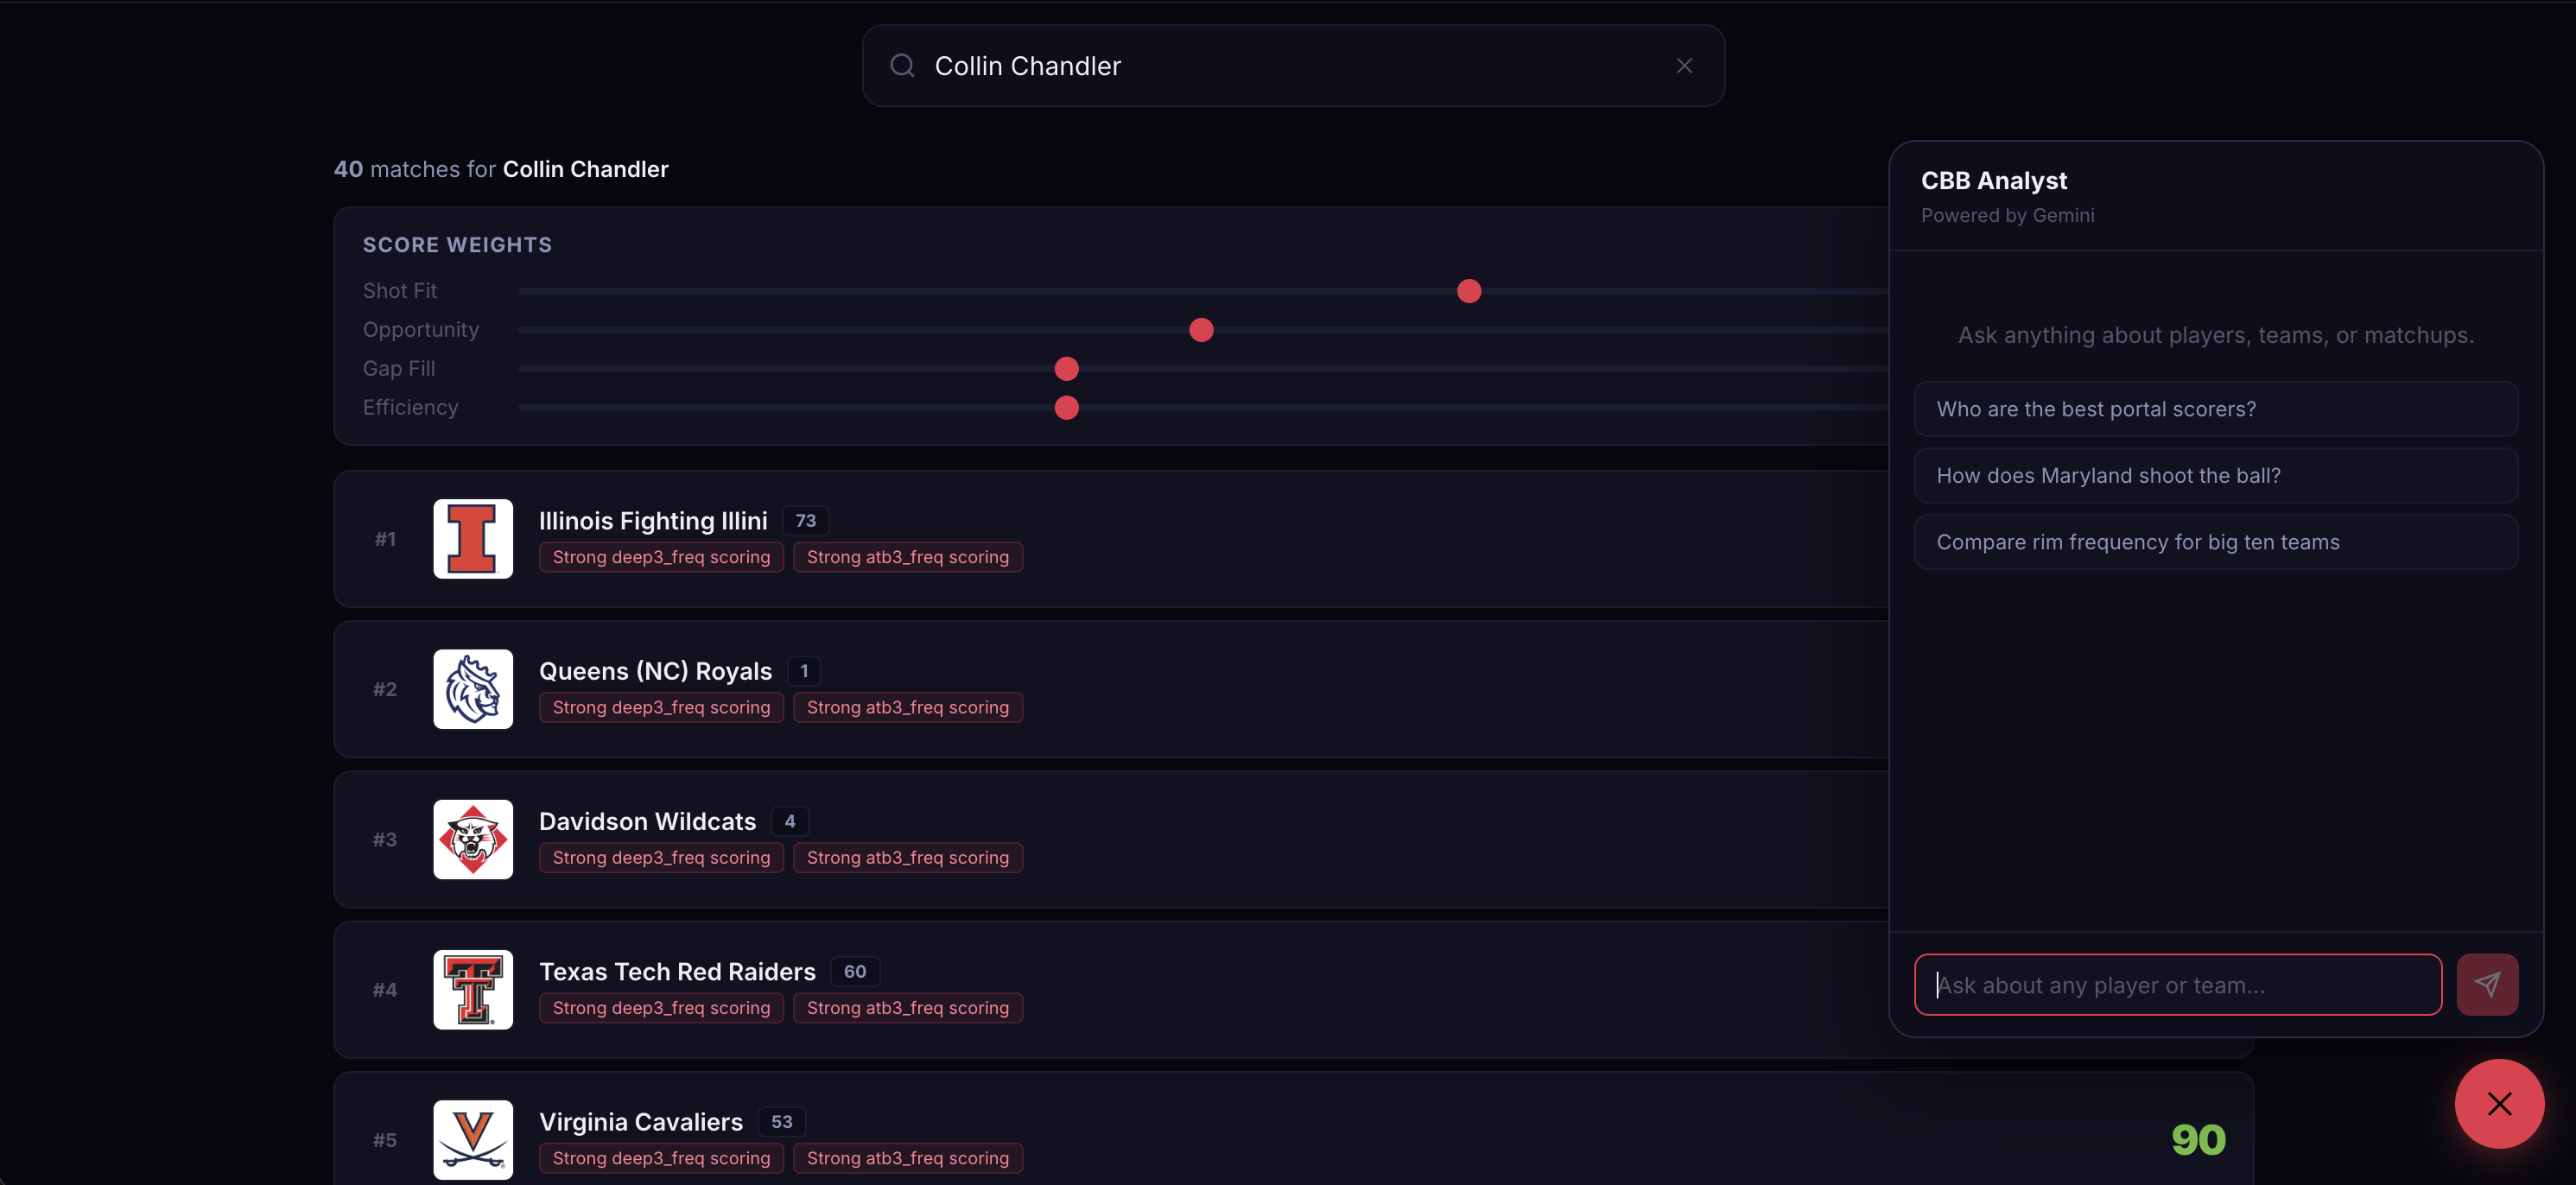
It is a two-way transfer fit engine for college basketball. Search any D1 team and get a ranked list of portal players scored on how well their shot profile matches the team's system, how much they fill the team's specific vacancy left by departing players, and how efficiently they score. Search any portal player and see which programs fit their game best. Every match comes with a breakdown of individual fit scores, a radar chart, and an AI-generated scouting report. A built-in analyst chatbot can answer questions about any player or team using season data and stats.
How we built it
Backend: Built with Flask, the backend fetches live play-by-play and aggregate stats from a college basketball API at startup and holds everything in memory for fast scoring. For each player-team pair it uses a 6-dimensional shot profile vector normalized to form a true probability distribution. The match score combines four components: cosine similarity between the player and team shot distributions (shot fit), histogram intersection measuring how much of the player's shot volume falls in zones the team already uses (opportunity fit), a gap profile built from the MPG-weighted shot tendencies of the team's portal departures and seniors that captures what the roster actually lost (gap fit), and eFG% weighted by the player's own shot selection rather than a naive FG% blend (efficiency). An agentic Gemini endpoint handles the chatbot, running a tool-calling loop against live stats APIs to answer natural language questions.
Frontend: Built in React with Recharts, the UI has two search modes: find portal players for a team, or find best-fit programs for a player. It has an autocomplete driven by live backend data. Player cards show headshots, per-game stats, and shooting splits pulled from a separate stats endpoint and merged at startup. Clicking a card opens a detail panel with a radar chart across all four fit dimensions, animated score bars, an AI scouting report generated on demand by Gemini, and live weight sliders that instantly re-rank results by reprioritizing the fit components client-side without a server round trip.
Challenges we ran into
Getting the fit scoring statistically right was harder than expected. I spent a lot of time trying to come up with an optimal formula that factored in everything a team or player could be looking for when looking for a new fit.
Accomplishments that we're proud of
Working with various APIs and libraries along with integrating AI features into the dashboard.
What we learned
This was my first time integrating an LLM into an app so I learned how to set it up and give it access to tools to get the right context to answer questions from users.
What's next for College Basketball Transfer Match
Adding defensive profiling, integrating an NIL value prediction or filtering feature.

Log in or sign up for Devpost to join the conversation.