-
-
-
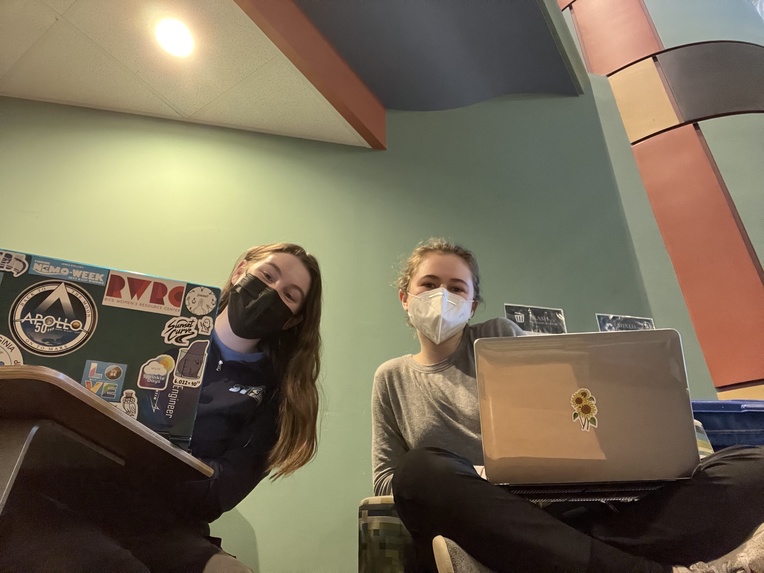
Working hard!
Inspiration
We were inspired by Cognite's presentation. We thought the specific challenge was really interesting, and the data we would analyze would be particularly unique.
What it does
We created an interactive dashboard that displays a variety of analyses for the viewer. These include time series plots for a chosen weather station, as well as daily average values, for wind speed and direction. We use both time series and polar plots to best demonstrate our findings.
What we learned
We both learned so much about how best to harness jupyter notebook as a tool for data analysis as well as user interaction. We improved our data science and coding skills, and we also learned a lot about offshore wind patterns!
Built With
- jupyter-notebook
- python


Log in or sign up for Devpost to join the conversation.