Most tools tell you whether you got the answer. Cogniscope tells you what your process says about your reasoning.
Inspiration
Self-learners drown in answer-checkers. Khan Academy tells you correct ✓ or try again ✗. LeetCode tells you Accepted or Wrong Answer. Both miss the part that actually matters: the thirty seconds you stared at the screen before typing, the two attempts you abandoned, the moment you tabbed away to Google.
When a great human tutor watches a student work, they don't grade the final answer first — they watch the pencil. They notice the long pause after step one. They notice when the student erases and starts a new approach. They notice when the student copies a formula off another tab. That is where the diagnosis lives.
We wanted to build a tool where a self-learner — with no tutor, no study group, no professor — could get a tiny slice of that experience. Solve a problem. Get back a trace of how you actually solved it, plus a short, honest written diagnosis: "You committed to a sign-error pattern early and didn't revisit it. You abandoned the right approach at \(t = 0:42\)."
That's Cogniscope.
What it does
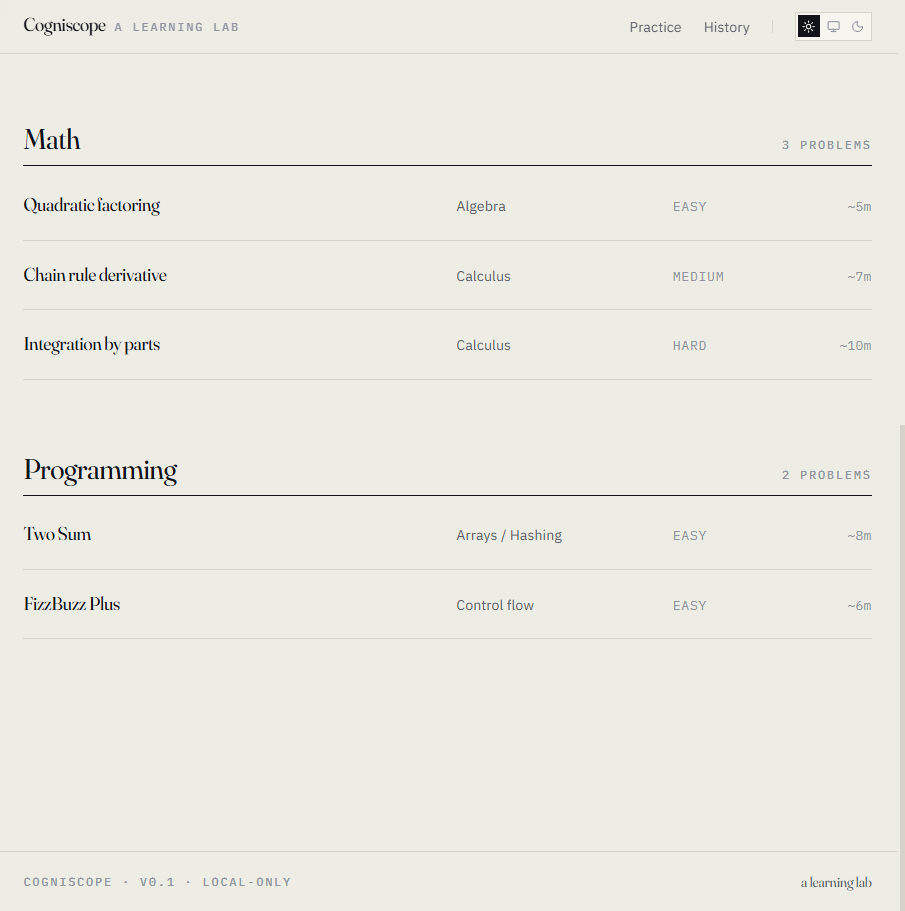
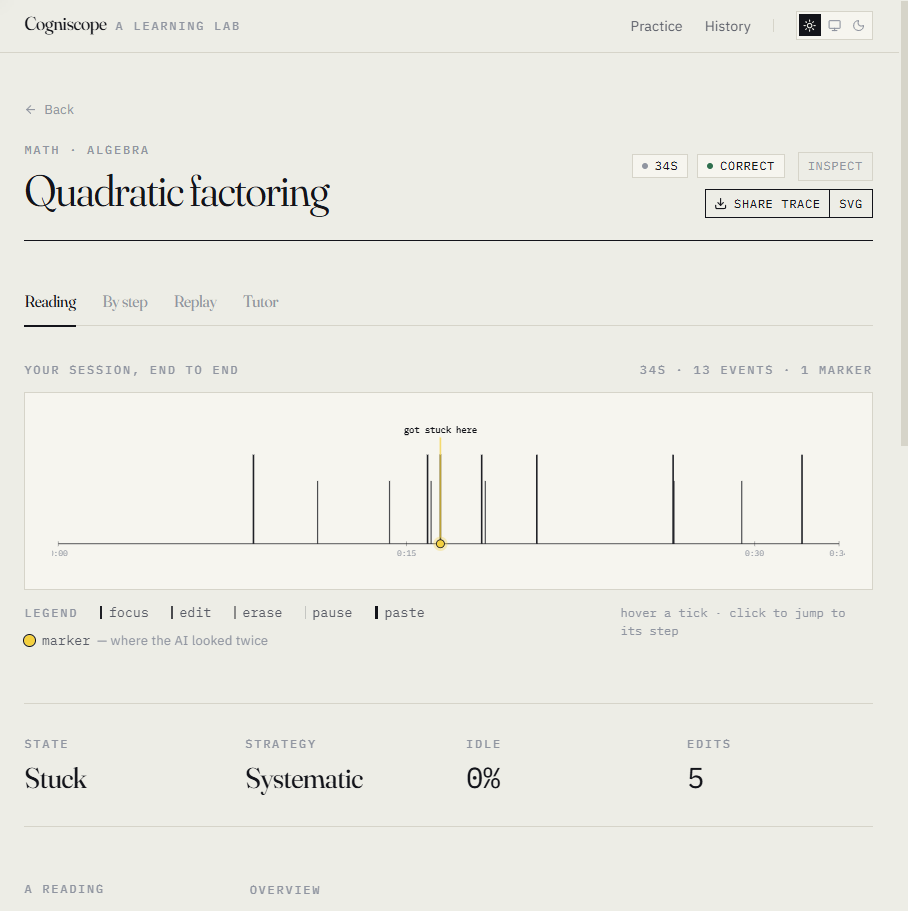
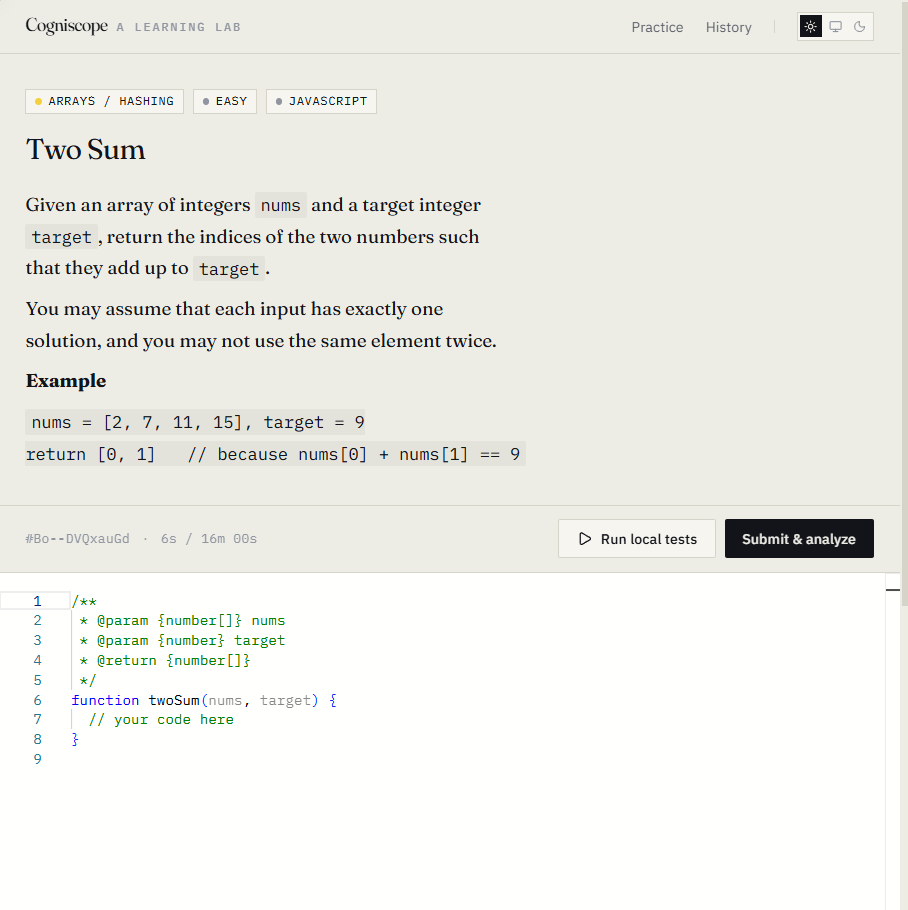
You pick a problem (math like quadratic factoring, or programming like two-sum). You solve it in the browser. While you do, Cogniscope records every keystroke, pause, paste, erase, and tab-switch via rrweb. When you submit, you get back a report with four tabs:
- Reading — a written diagnosis: what your process suggests about your reasoning, root causes, and one concrete next drill.
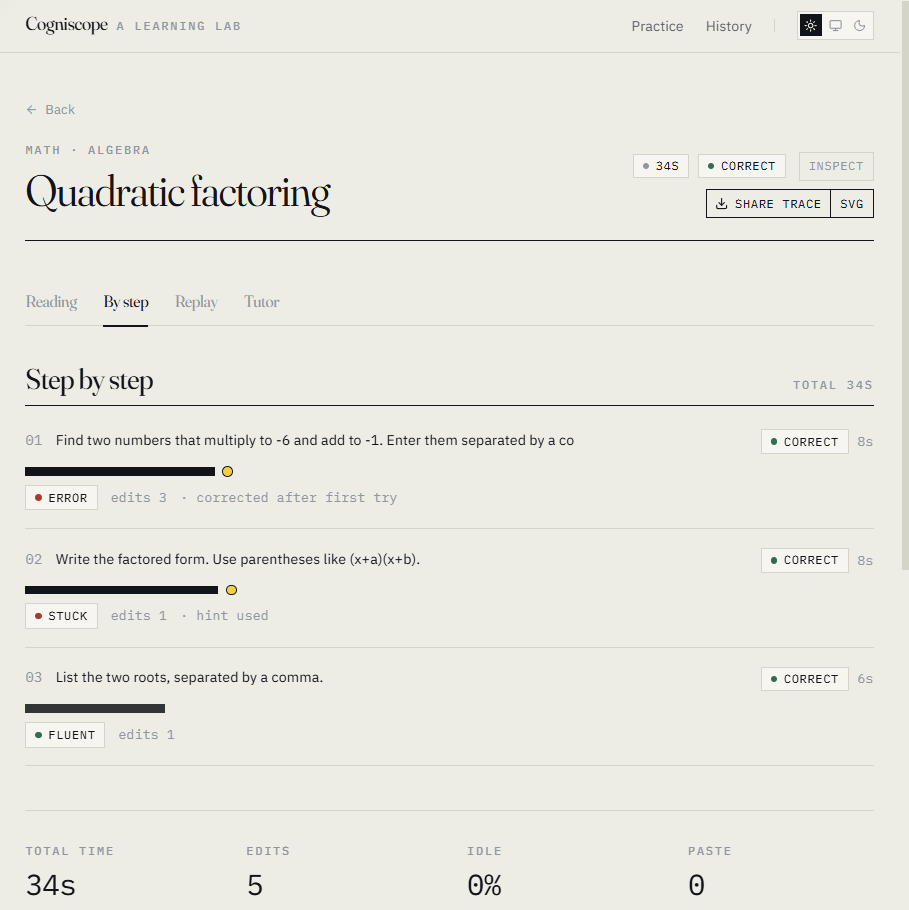
- By step — your work, broken into the steps the problem defined, with timing and edits.
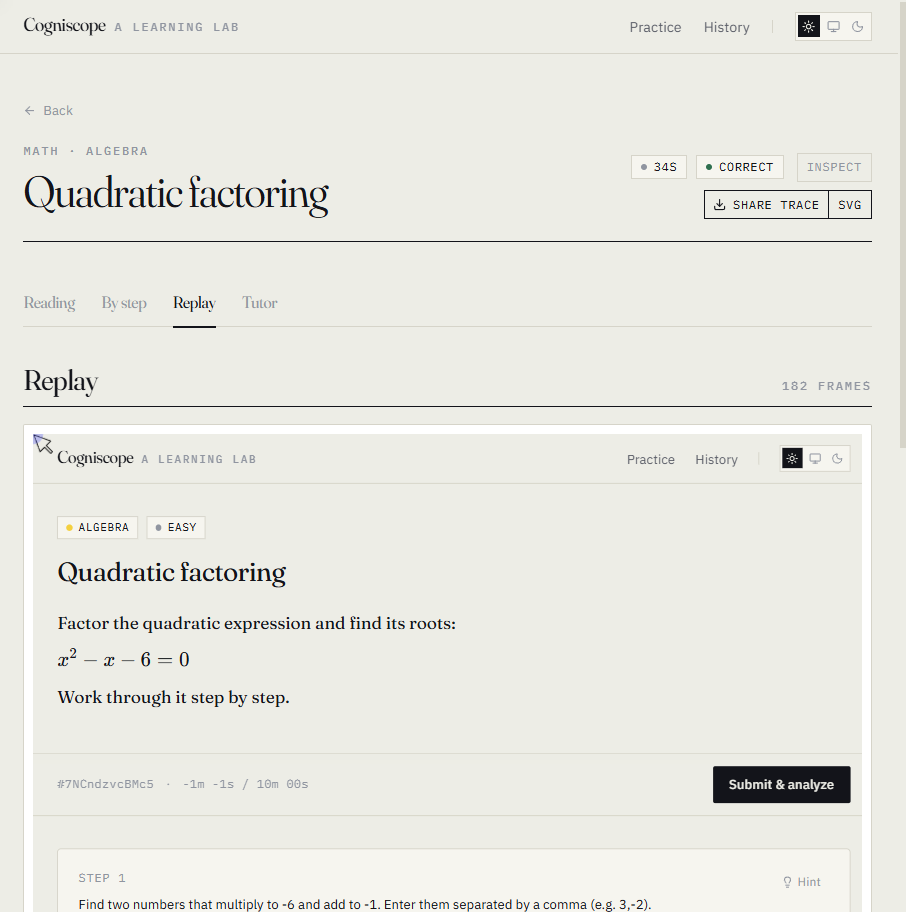
- Replay — a literal video-like replay of your solving session, scrubbable.
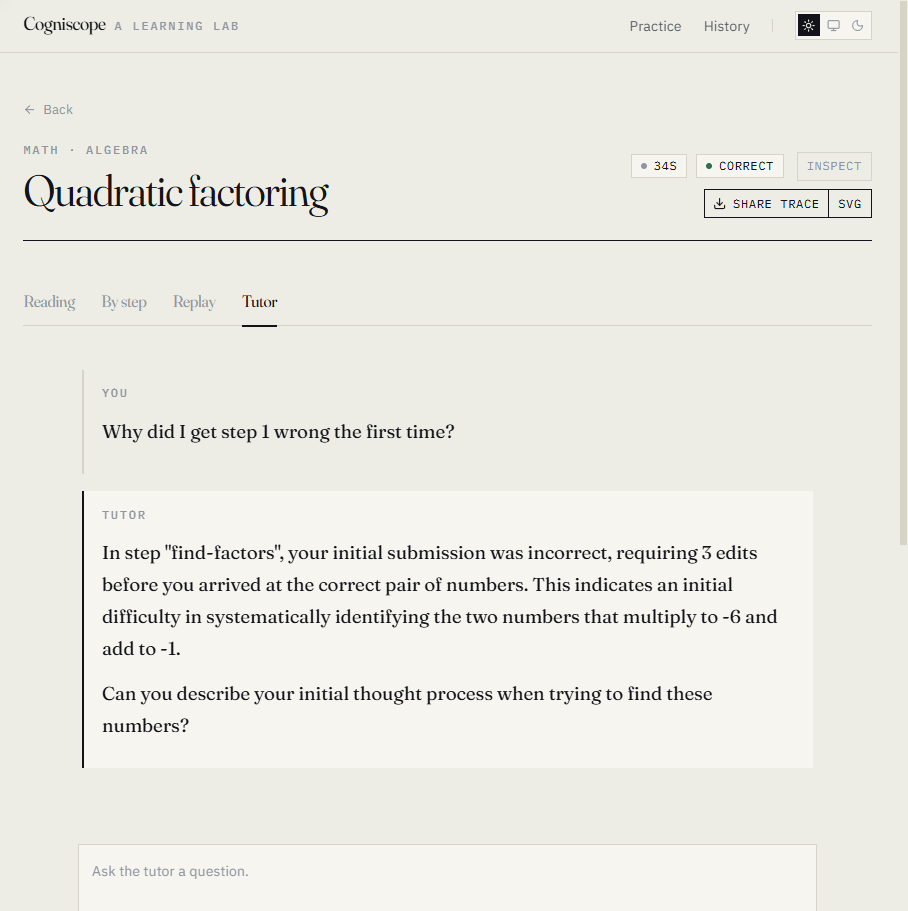
- Tutor — chat about your own trace. "What did I get wrong? Where did I hesitate?"
Plus a Share trace button that produces a server-rendered PNG of your timeline. One image, no login, share it anywhere.
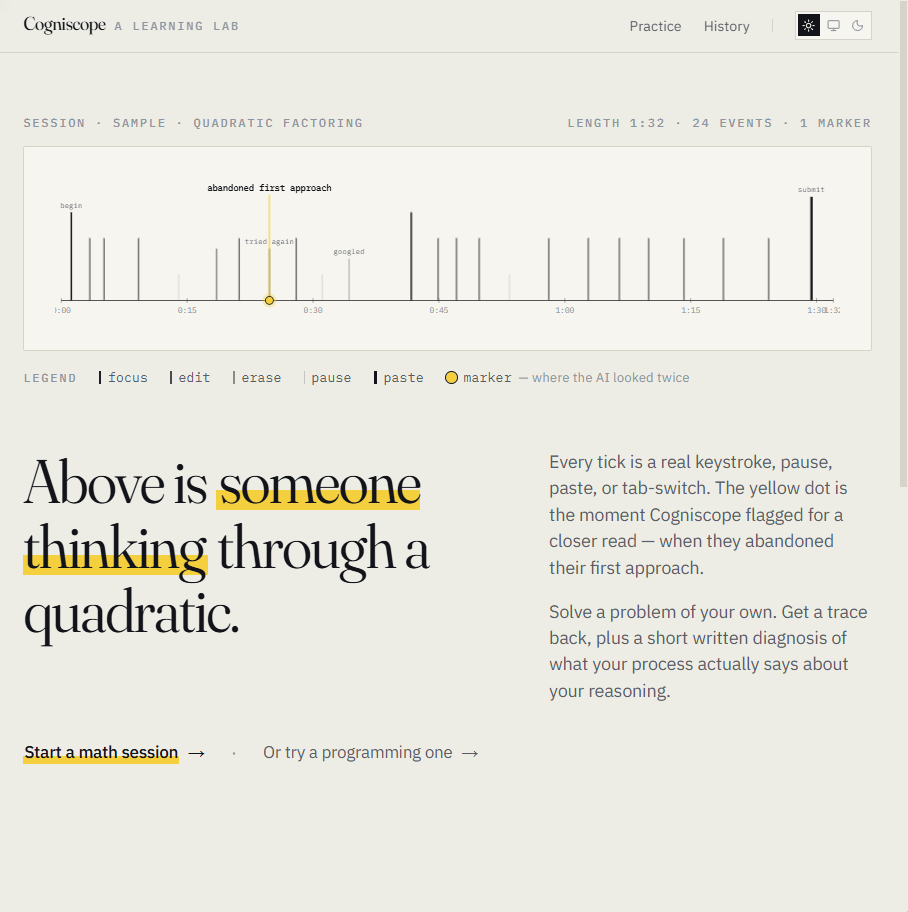
The hero on the landing page is a real example trace:
Every tick is a real keystroke, pause, paste, or tab-switch. The yellow dot is the moment Cogniscope flagged for a closer read — when they abandoned their first approach.
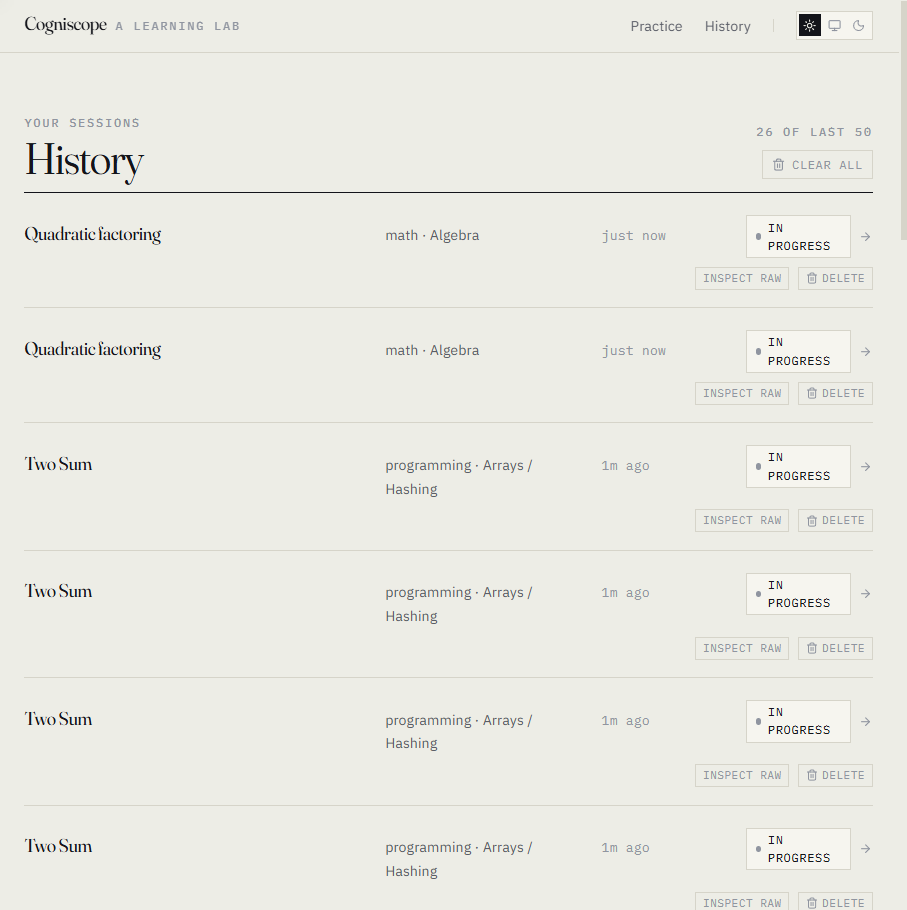
Everything is local. SQLite on disk, rrweb recordings as .jsonl next to it. Your traces are yours, and one button wipes them all.
How we built it
The data flow:
- Browser captures rrweb events while you solve.
- Next.js API persists them — metadata into SQLite, raw event stream into a per-session
.jsonlfile. - On submit, a feature extractor turns the raw event stream into a small structured summary (focus runs, edit bursts, erase clusters, paste markers, long pauses).
- The summary plus your step-by-step text goes to an LLM router that talks to Gemini, Qwen (via Alibaba DashScope's OpenAI-compatible endpoint), or a deterministic Mock provider — selectable with one env var.
- The model returns a strict
DiagnosisJSON, validated against azodschema, persisted, and rendered in the report.
Stack
| Layer | Choice | Why |
|---|---|---|
| App | Next.js 14 (App Router) + TypeScript | Server actions + RSC keep the surface small |
| Storage | better-sqlite3 + flat-file rrweb logs |
Zero-config, local-only persistence |
| Capture | rrweb 2.0.1 |
DOM-level events with paste & tab-switch hooks |
| LLM | Gemini · Qwen (DashScope) · deterministic Mock | Plug-and-play via a single env var |
| Validation | zod schemas at every boundary |
LLM JSON drifts; we never trust it raw |
| Share | Pure-SVG renderer → PNG via resvg |
No headless browser; runs on any host |
The diagnosis schema
The model never sees raw rrweb events. We compute features first, then ask it to return a strict shape:
$$ \text{Diagnosis} = {\,\text{summary},\ \text{rootCauses}[\,],\ \text{nextDrill},\ \text{evidence}[\,]\,} $$
const Diagnosis = z.object({
  summary: z.string(),
  rootCauses: z.array(z.object({
    label: z.string(),
    description: z.string(),
    evidence: z.array(z.string()),
  })),
  nextDrill: z.string(),
});
We validate, store, and render. If the model misbehaves, the schema rejects it and we re-prompt once before falling back to the mock provider so the UI never breaks.
The share image
The trace PNG took the most design iterations. Early versions were just a timeline, and viewers had no idea what they were looking at. Final layout, \(1200 \times 700\):
- An outcome chip — correct / incorrect / submitted / in-progress
- An italic takeaway pulled from
rootCauses[0].description - A legend strip explaining each tick type
- A yellow marker dot at the AI's flagged moment
One image, fully self-explanatory, no caption needed.
What we learned
- The interesting data is between the keystrokes. A cold count of edits says nothing; the shape of the edit pattern — burst, pause, erase, restart — is the whole signal.
- Trust LLM outputs only at boundaries. Schema-validate, then schema-validate again. Treat every JSON parse as adversarial.
- Local-first changes the product, not just the architecture. When data never leaves the laptop, you can show users their trace without the privacy-warning prelude. That changes how candidly people use the thing.
- Replay is the killer feature people don't know they want. Once someone watches their own solving session play back, they instantly notice things they couldn't articulate before.
rrweb-playerwas a trap. See below.
Challenges we faced
The rrweb-player package is broken in ESM. We spent half a day on a white-blank Replay tab. After tracing into the bundled Svelte component, we found that replayer is declared as a prop but never instantiated, and the controller's play / pause are empty stubs. Fix: bypass the player entirely, mount rrweb.Replayer ourselves into a div, and build a custom scrubber + play/pause + time readout. The Replay tab is now ~80 lines of our own code, and it actually works.
rrweb's Replayer doesn't emit a usable time-update event. Subscribing to ui-update-current-time never fired in our setup. Solution: a requestAnimationFrame loop polling replayer.getCurrentTime(). Pragmatic, costs nothing, drives the slider smoothly.
The recorded viewport doesn't match the report column. rrweb captures the original document size. To embed it in our narrower report column we apply a CSS transform: scale(0.427) plus a width/height correction so the iframe content fits cleanly. This is also what makes mobile Replay viable.
LLM latency is non-deterministic for a demo. A real Submit & analyze call takes \(10\) to \(30\) seconds. We added a deterministic mock provider that returns a hand-crafted Diagnosis for each problem, and seeded sessions on disk, so the demo flow is reproducible offline.
Cleanup as a first-class feature. Recordings persist forever by default — that felt wrong for a tool that's about your thinking. We added per-session Delete and a Clear all button on the history page, both two-step confirms with auto-disarm, both wired through the same DB-cascade-and-unlink helper. Privacy by default, and the user is in control.
Mobile. Tracking eyebrows, replay scaling, history rows — all needed work below the sm breakpoint. We audited every page at \(375\,\text{px}\) and shipped the fixes inline.
Built With
- gemini
- next.js
- qwen
- rrweb
- sqlite
- tailwind
- typescript

Log in or sign up for Devpost to join the conversation.