-
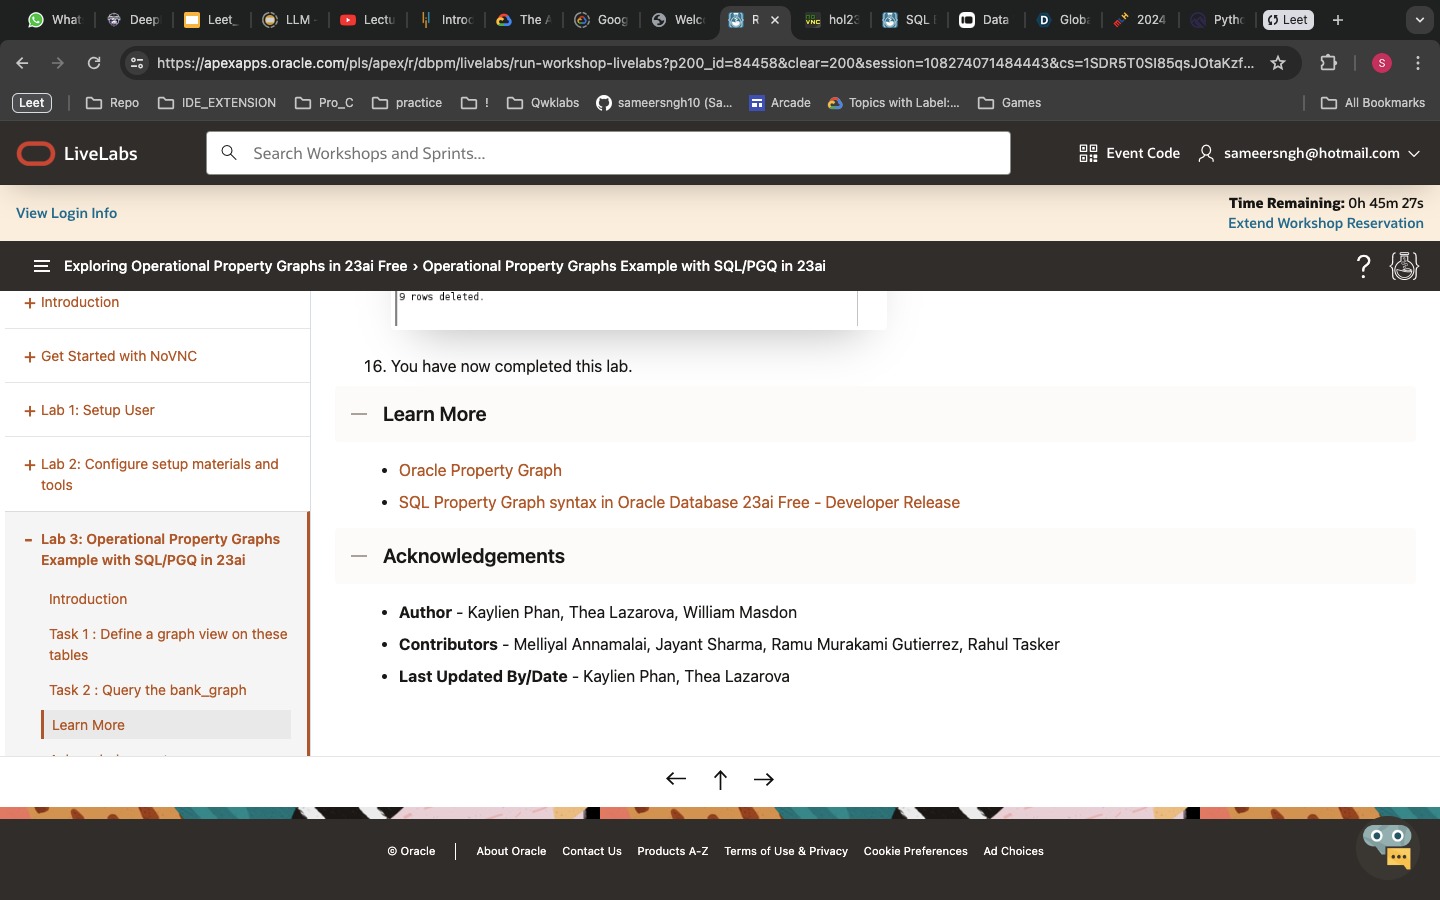
The lab challenge completes
-
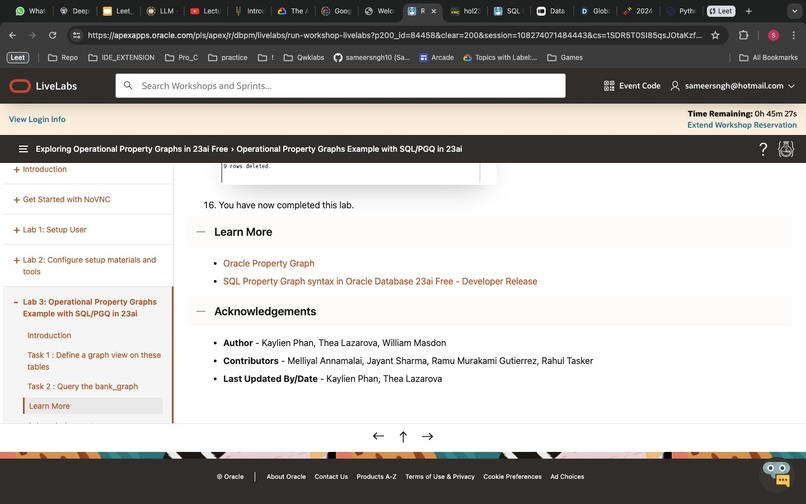
Lab completion Point

Inspiration
The inspiration for this project comes from the potential of operational property graphs in Oracle Database 23ai. By leveraging the capabilities of property graphs, developers and data analysts can gain valuable insights into complex relationships within their data.
What it does
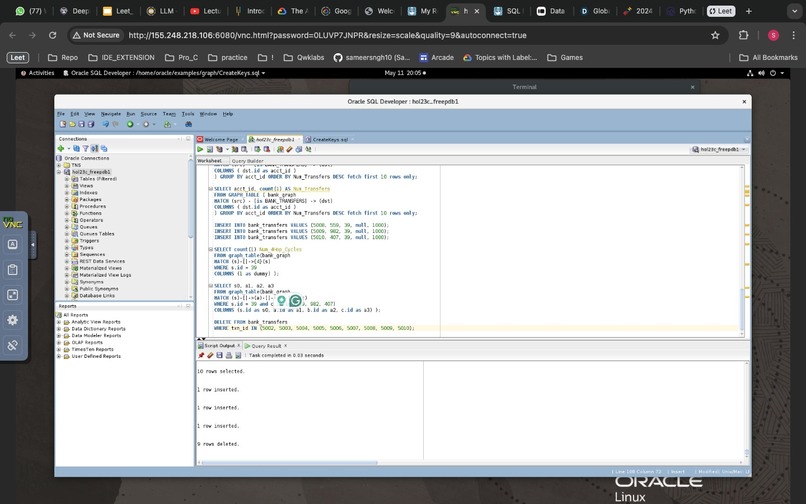
The project focuses on exploring operational property graphs with Oracle Database 23ai. It involves creating a graph from bank account and transaction tables and then running graph pattern queries in SQL to uncover various relationships within the data.
How we built it
The project likely involved setting up Oracle Database 23ai and importing relevant data tables containing bank account information and transaction details. Then, using SQL queries with the GRAPH_TABLE function and MATCH clause based on the SQL:2023 standard, the team built graph patterns to analyze connections in the data.
Challenges we ran into
Some challenges encountered during the project might include understanding the concept of property graphs, learning how to model data as a graph, and mastering the syntax and functionality of graph pattern queries in SQL.
Accomplishments that we're proud of
likely achieved several accomplishments throughout the project, such as successfully creating a graph from the provided data, running complex graph pattern queries, and gaining valuable insights into relationships within the data that were previously challenging to identify.
What we learned
Participants likely learned a great deal about operational property graphs, the capabilities of Oracle Database 23ai for graph analysis, and the SQL:2023 standard for writing graph pattern queries. They also gained practical experience in applying these concepts to real-world data.
What's next for Coding Challenge 1 Graphs with Oracle
The project's next steps could involve further exploration of graph analysis techniques, experimenting with more complex graph patterns, or applying the knowledge gained to other datasets or use cases. Additionally, participants might consider sharing their findings and insights with others or incorporating graph analysis into their ongoing projects or business processes.

Log in or sign up for Devpost to join the conversation.