
Inspiration
Every hackathon participant here has to answer the same question judges ask: where exactly did Codex accelerate your workflow? I realized Codex CLI already answers that question for itself — every session is logged locally as structured JSONL, with timestamps, prompts, tool calls, and token usage baked in. Nobody was looking at it. So I built a tool that reads Codex's own logs and turns them into something you can actually see and measure.
What it does
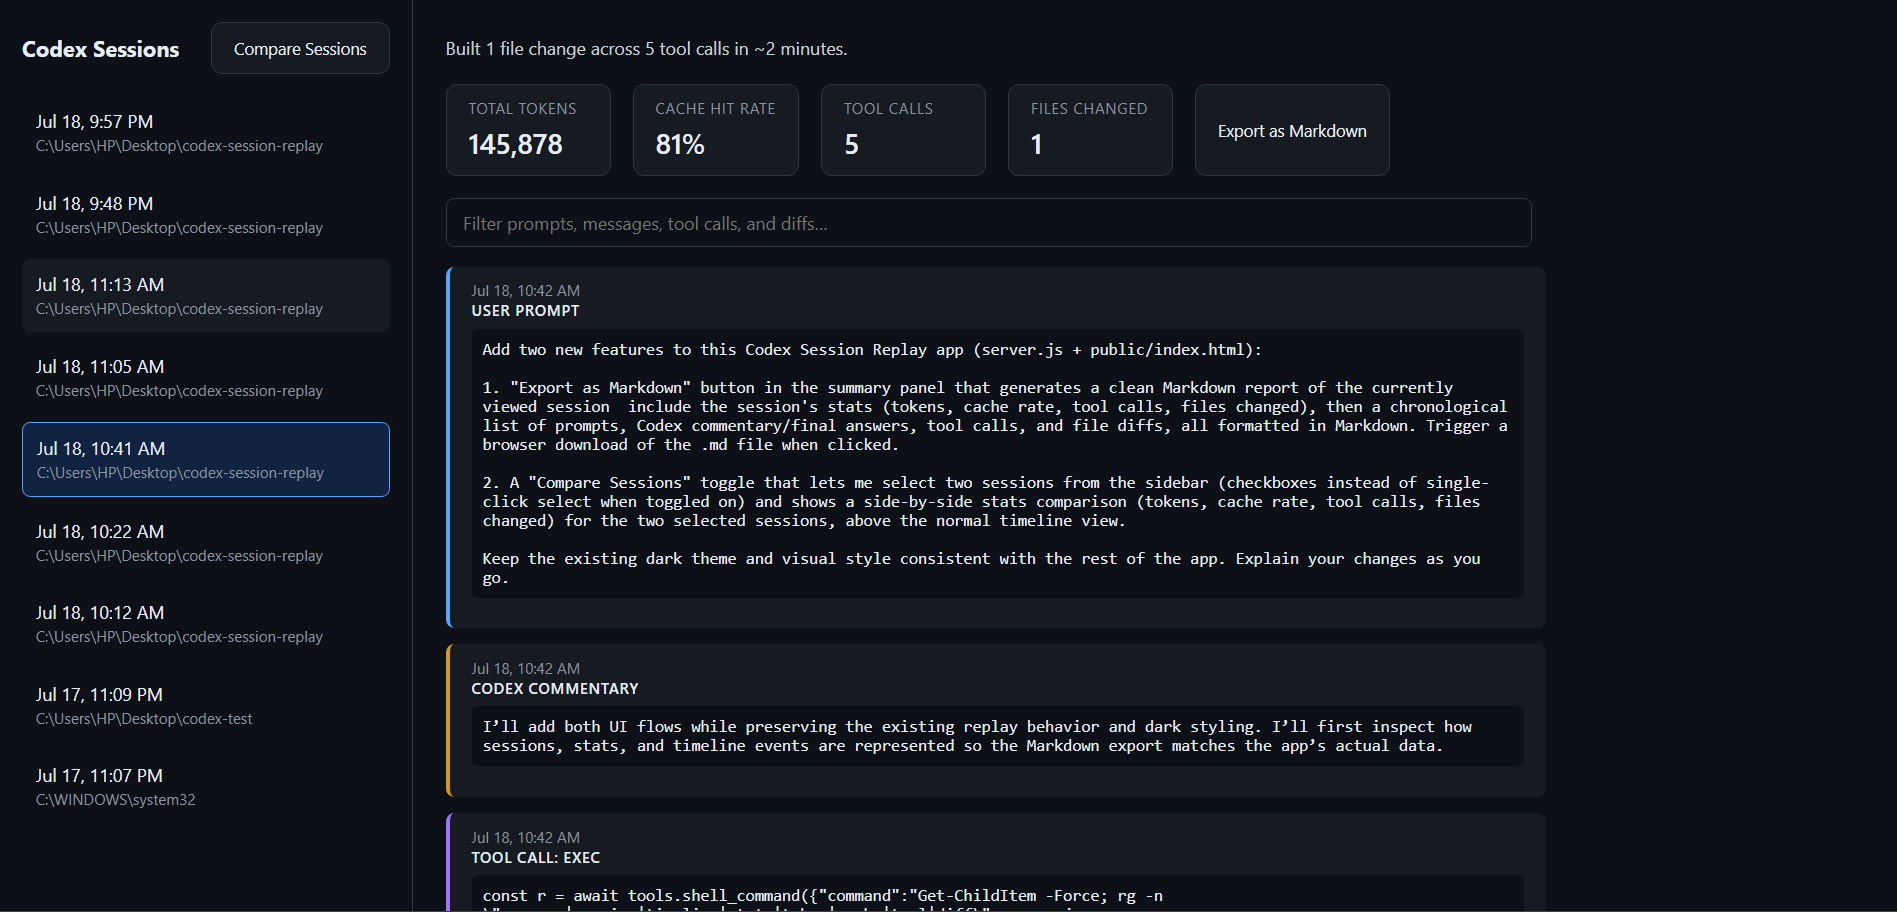
Codex Session Replay scans your local ~/.codex/sessions folder and renders any session as a visual timeline, your prompts, Codex's commentary and final answers, its tool calls, and the actual file diffs it made, with syntax highlighting and GitHub-style diff coloring. Alongside that, it shows a live efficiency dashboard: total tokens used, cache hit rate, tool call count, and files changed, plus a plain-language summary like "Built 2 file changes across 8 tool calls in ~3 minutes."
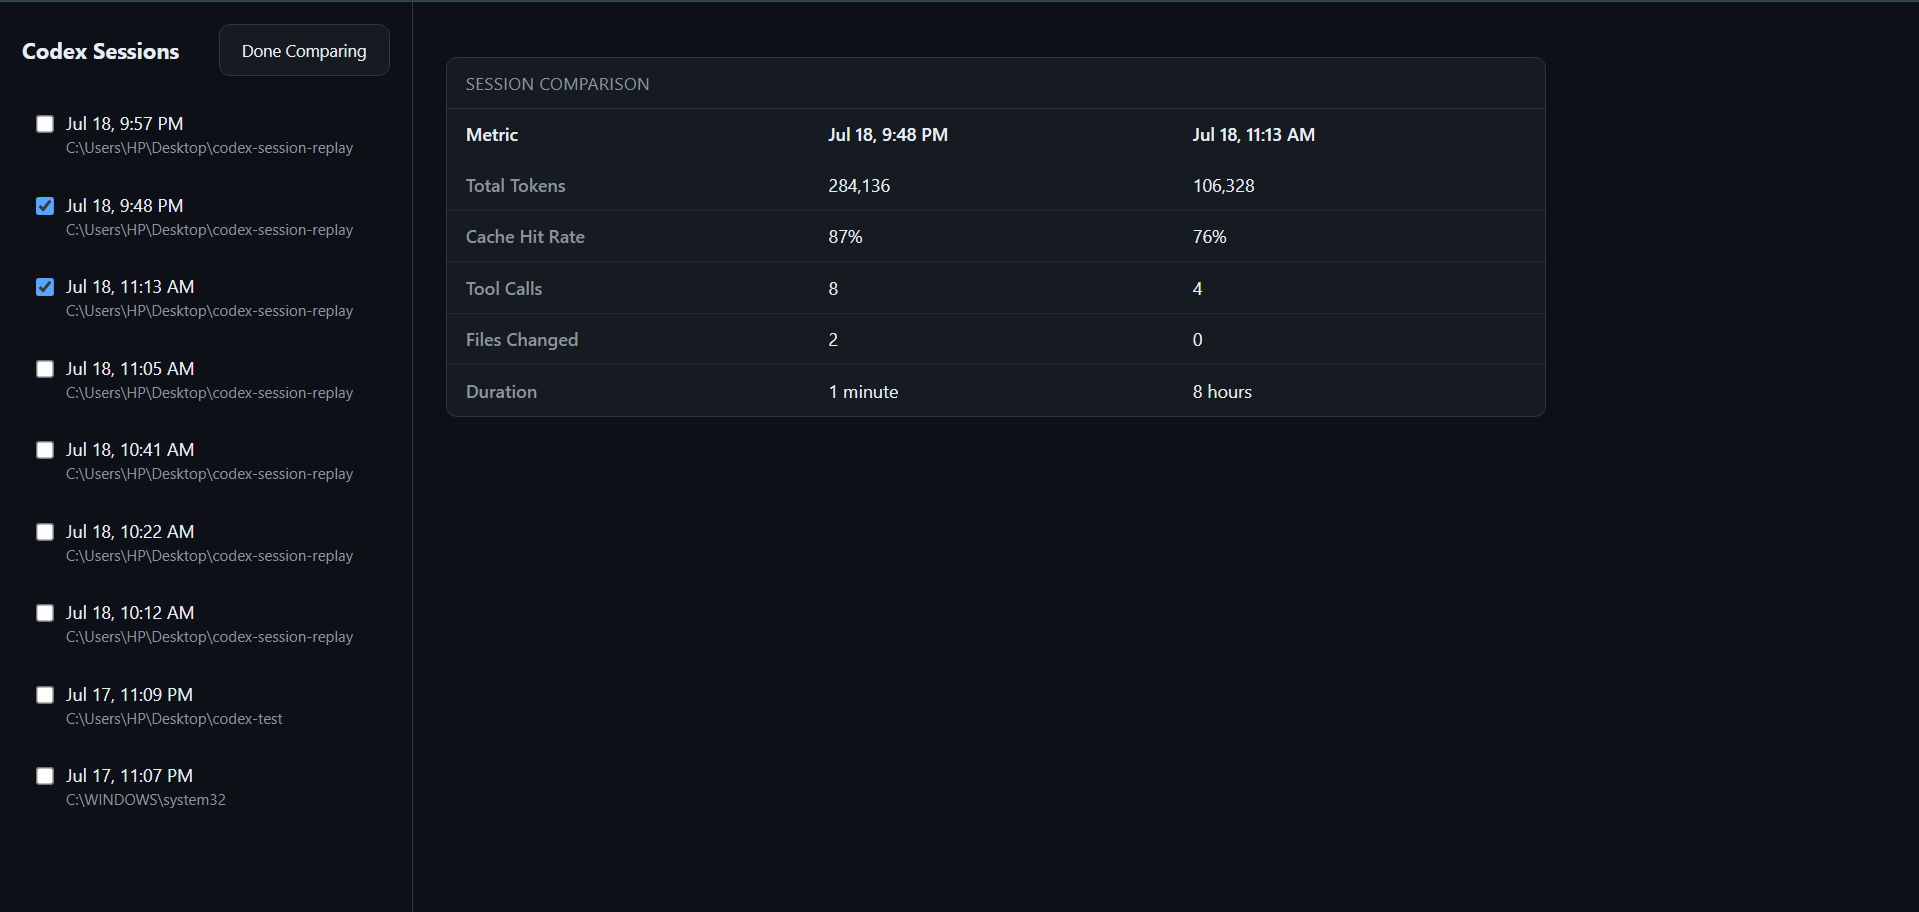
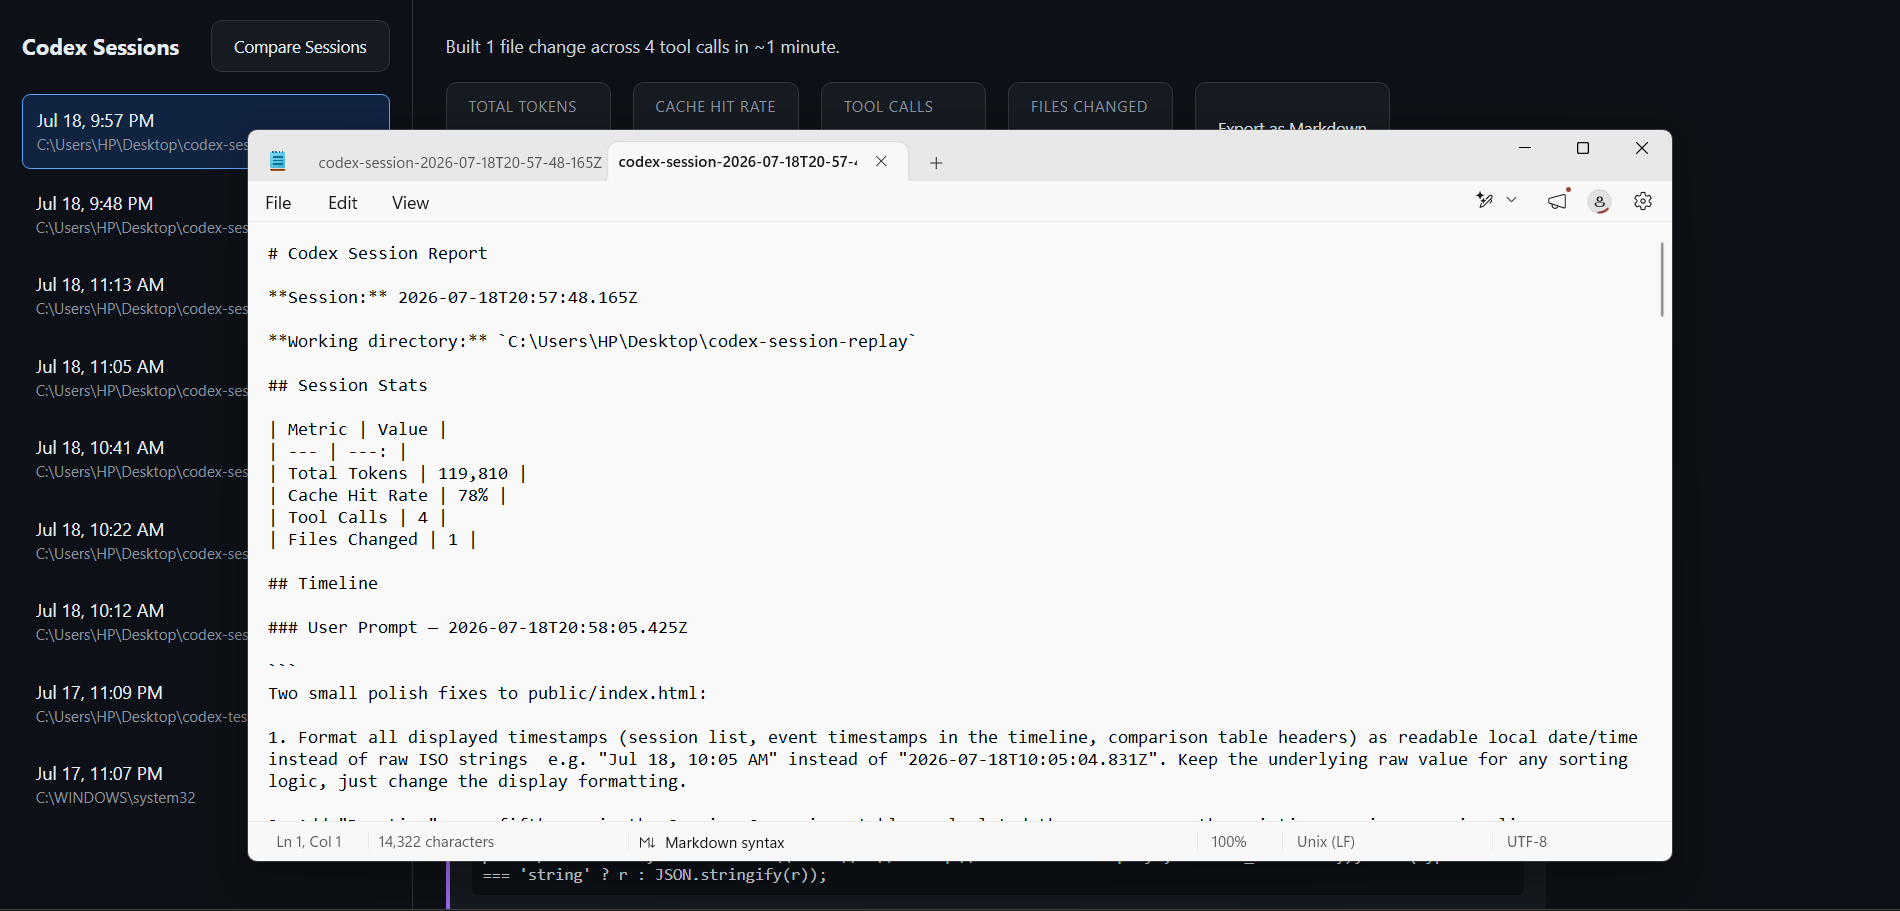
You can search across a session instantly, compare two sessions side by side to see efficiency trends over time, and export any session as a clean Markdown report.
It's entirely local, no API keys, no external services, nothing leaves your machine.
How I built it
I built this with Codex CLI running GPT-5.6, directly in the project folder. I gave Codex one detailed prompt describing the app's purpose and the JSONL data shape, and it built the Express backend (recursive session discovery, parsing, REST endpoints) and the core frontend timeline renderer from scratch.
From there I iterated with Codex across several follow-up sessions: adding live search/filtering, built-in syntax highlighting with no external library, GitHub-style diff coloring, a session comparison view, and Markdown export. A later session added UI polish and styled buttons, an inline SVG favicon, the plain-language overview line, and collapsible long code blocks.
Challenges I ran into
The most interesting one: a real state-management bug appeared where the comparison view and the single-session view were both rendering on top of each other instead of one replacing the other. I described the exact broken behavior to Codex without diagnosing it myself, and Codex inspected its own prior rendering logic, found the root cause, and fixed it, genuinely debugging its own earlier work.
Separately, working across a PC (my usual laptop was in repair) meant fighting through Node, Git, and PATH issues before I could even start building, a good reminder that environment setup is its own real cost on hackathon day.
What I learned
That Codex's own session logs are a genuinely underused source of insight. Token efficiency, cache reuse, and decision points are all sitting there in plain JSONL, and almost nobody looks at them directly. Also, that having Codex debug its own prior output, rather than me debugging its code by hand, is a workflow worth using more.
What's next
Support for other coding agents' log formats (not just Codex), team-wide dashboards aggregating efficiency across many sessions, and cost tracking tied to real token pricing.
Built With
- codex
- codex-cli
- css
- express.js
- gpt
- html
- javascript
- node.js

Log in or sign up for Devpost to join the conversation.