-
-
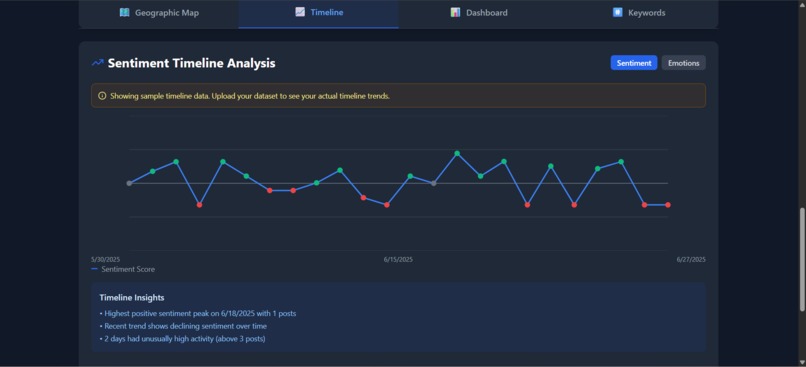
Sentiment Timeline analysis with insights.
-
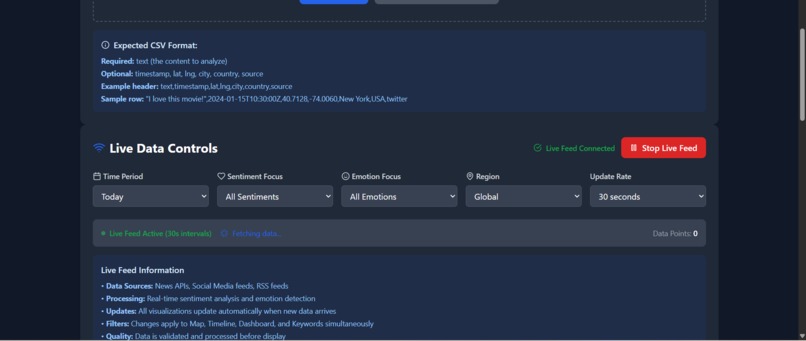
Live feed option to fetch real time data from X and other resources.
-
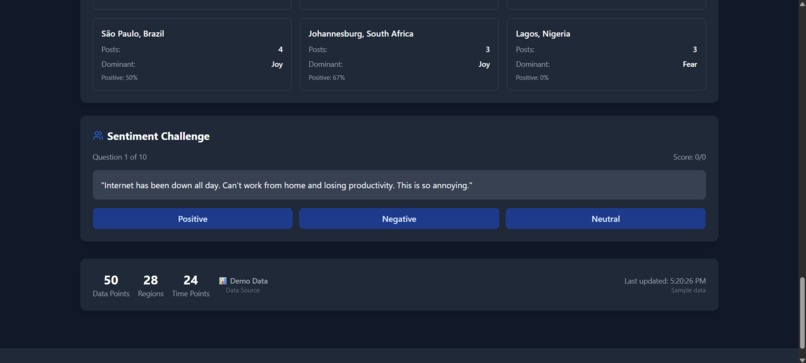
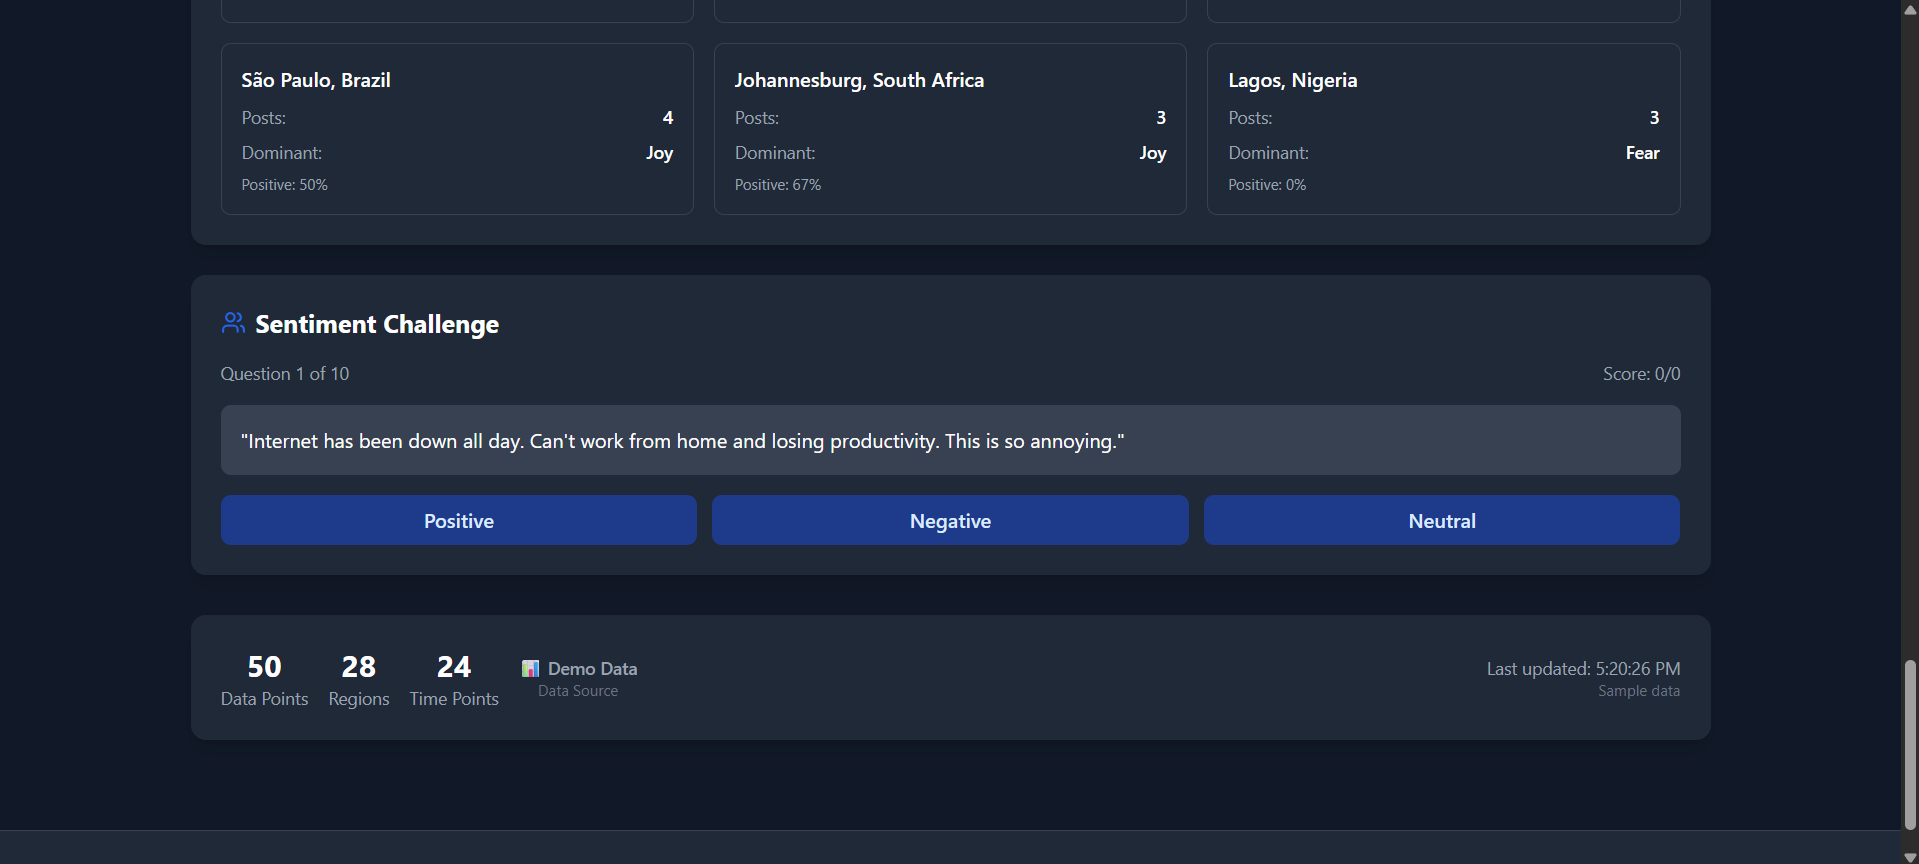
A small interactive game.
-
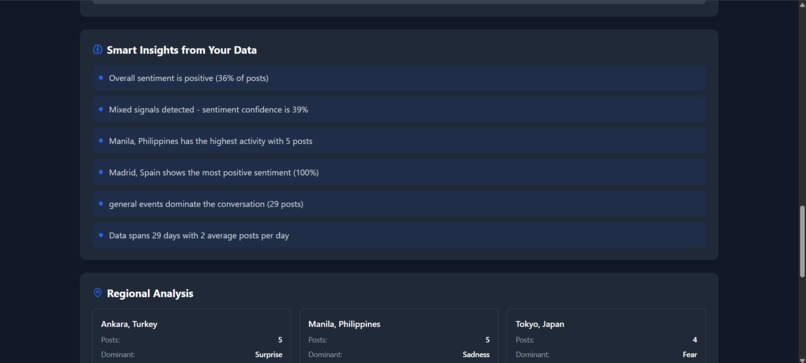
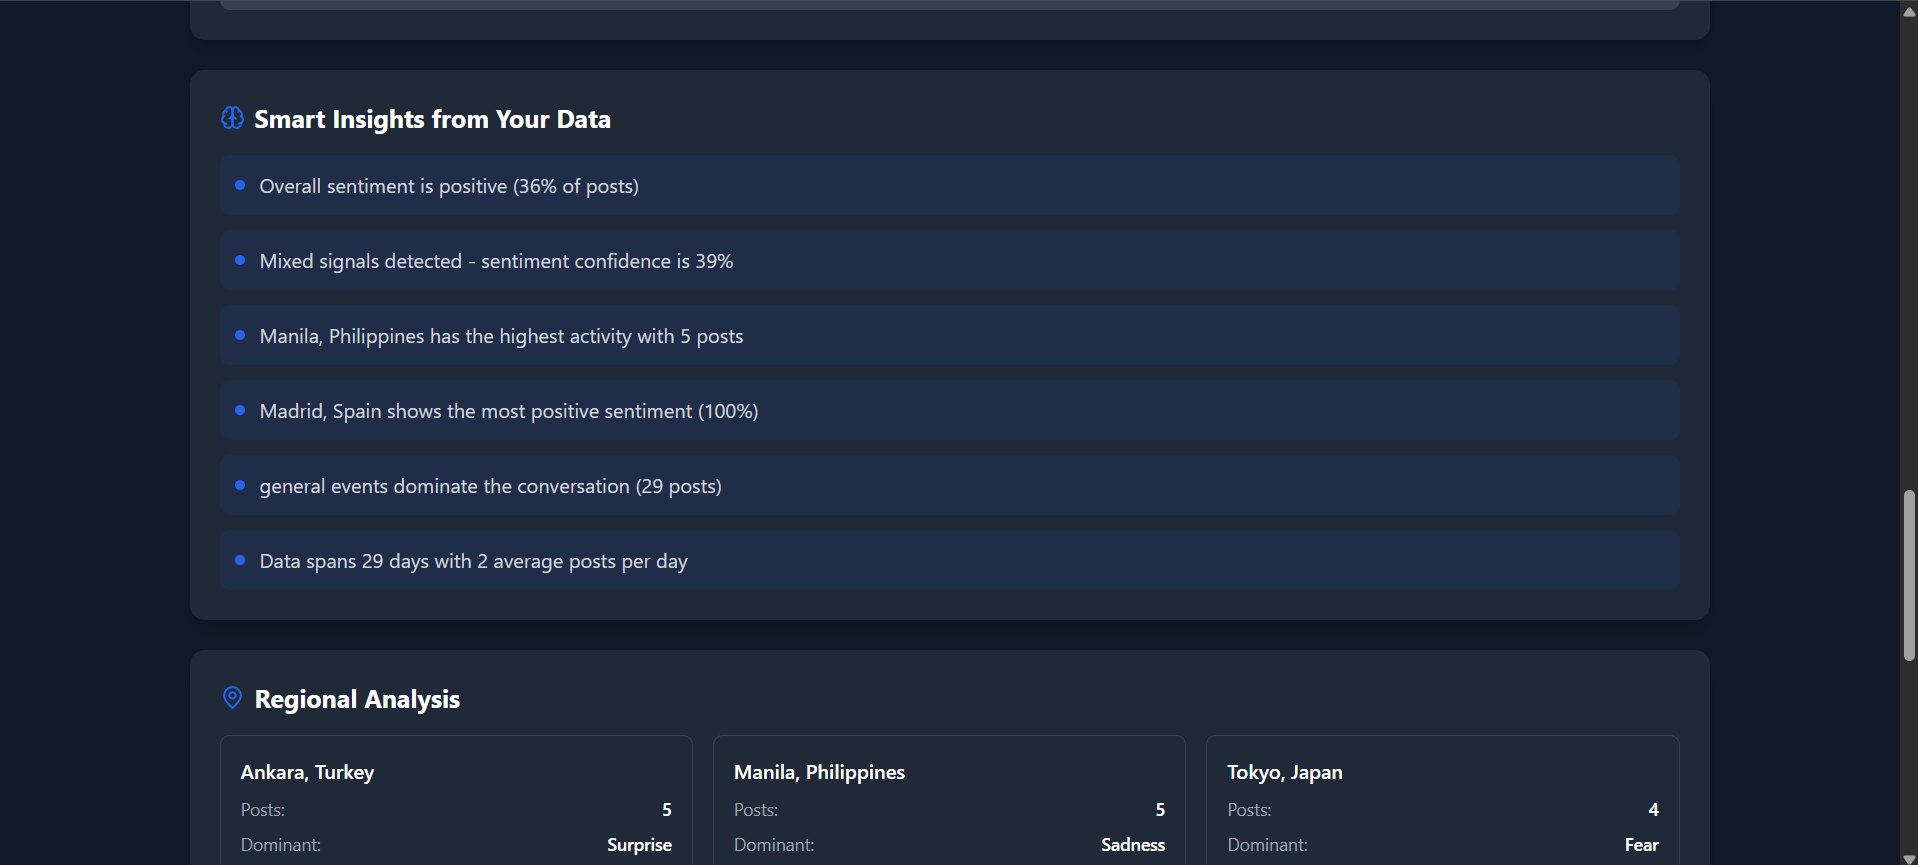
Smart insights obtained.
-
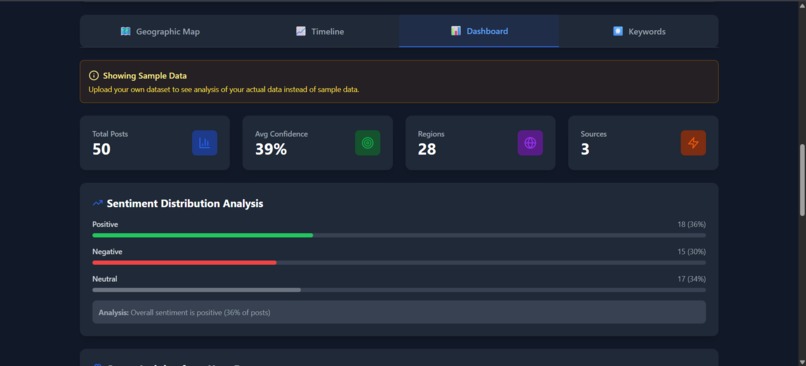
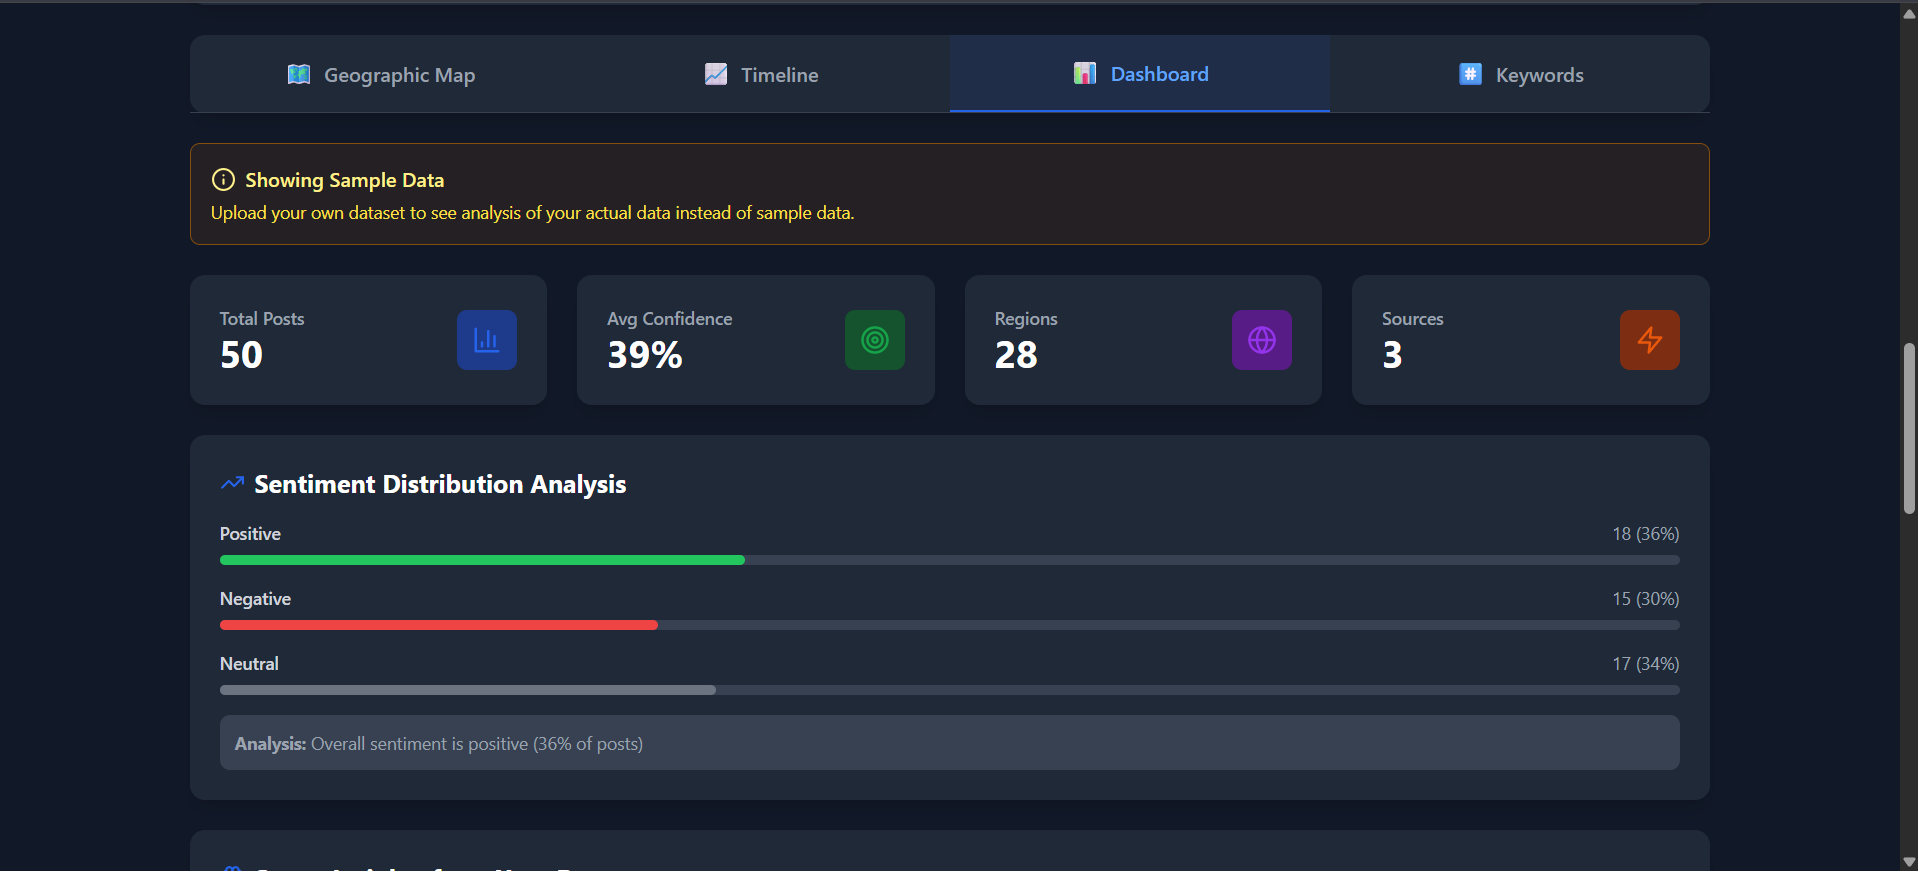
The dashboard providing the in depth analysis.
-
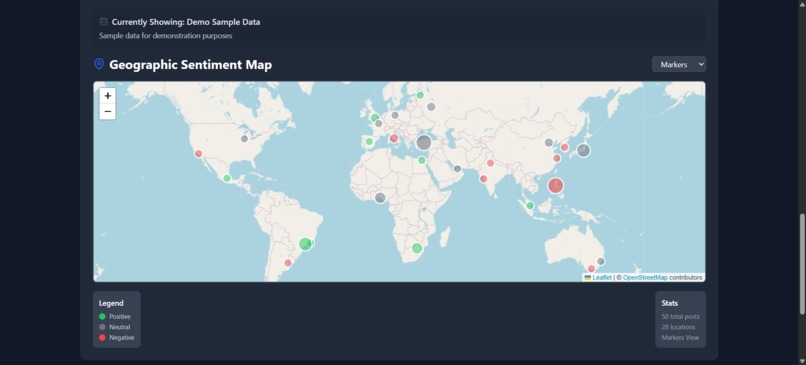
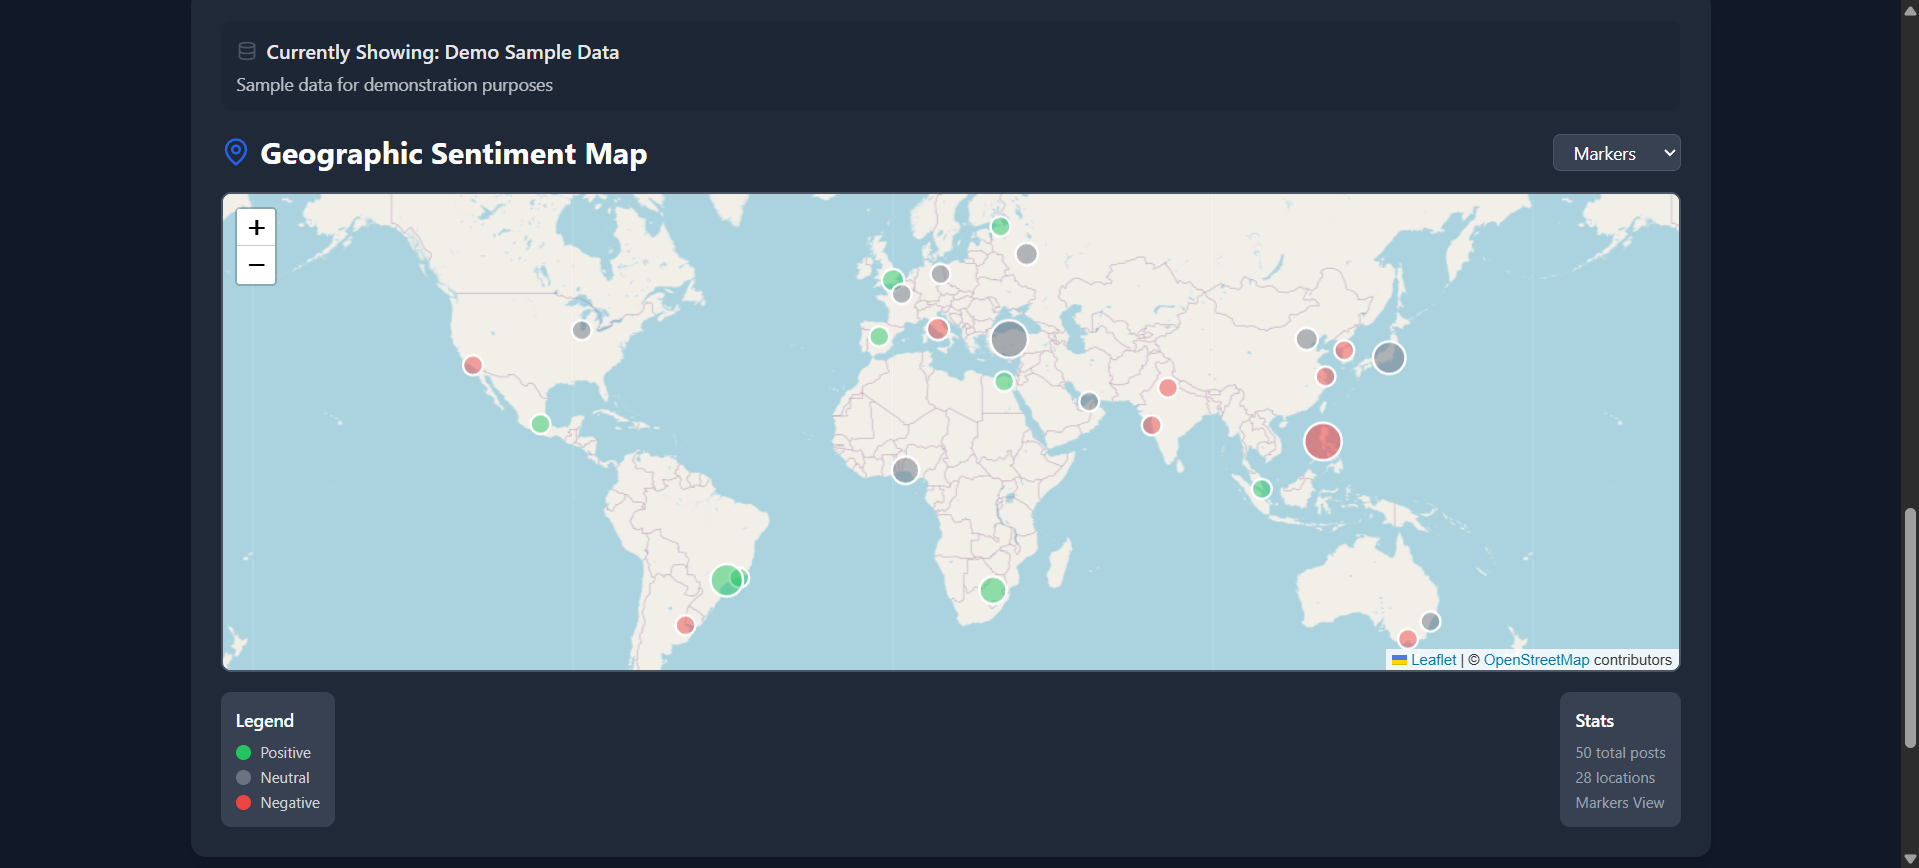
The Geographic map showing the sentiment analysis in various regions.
-

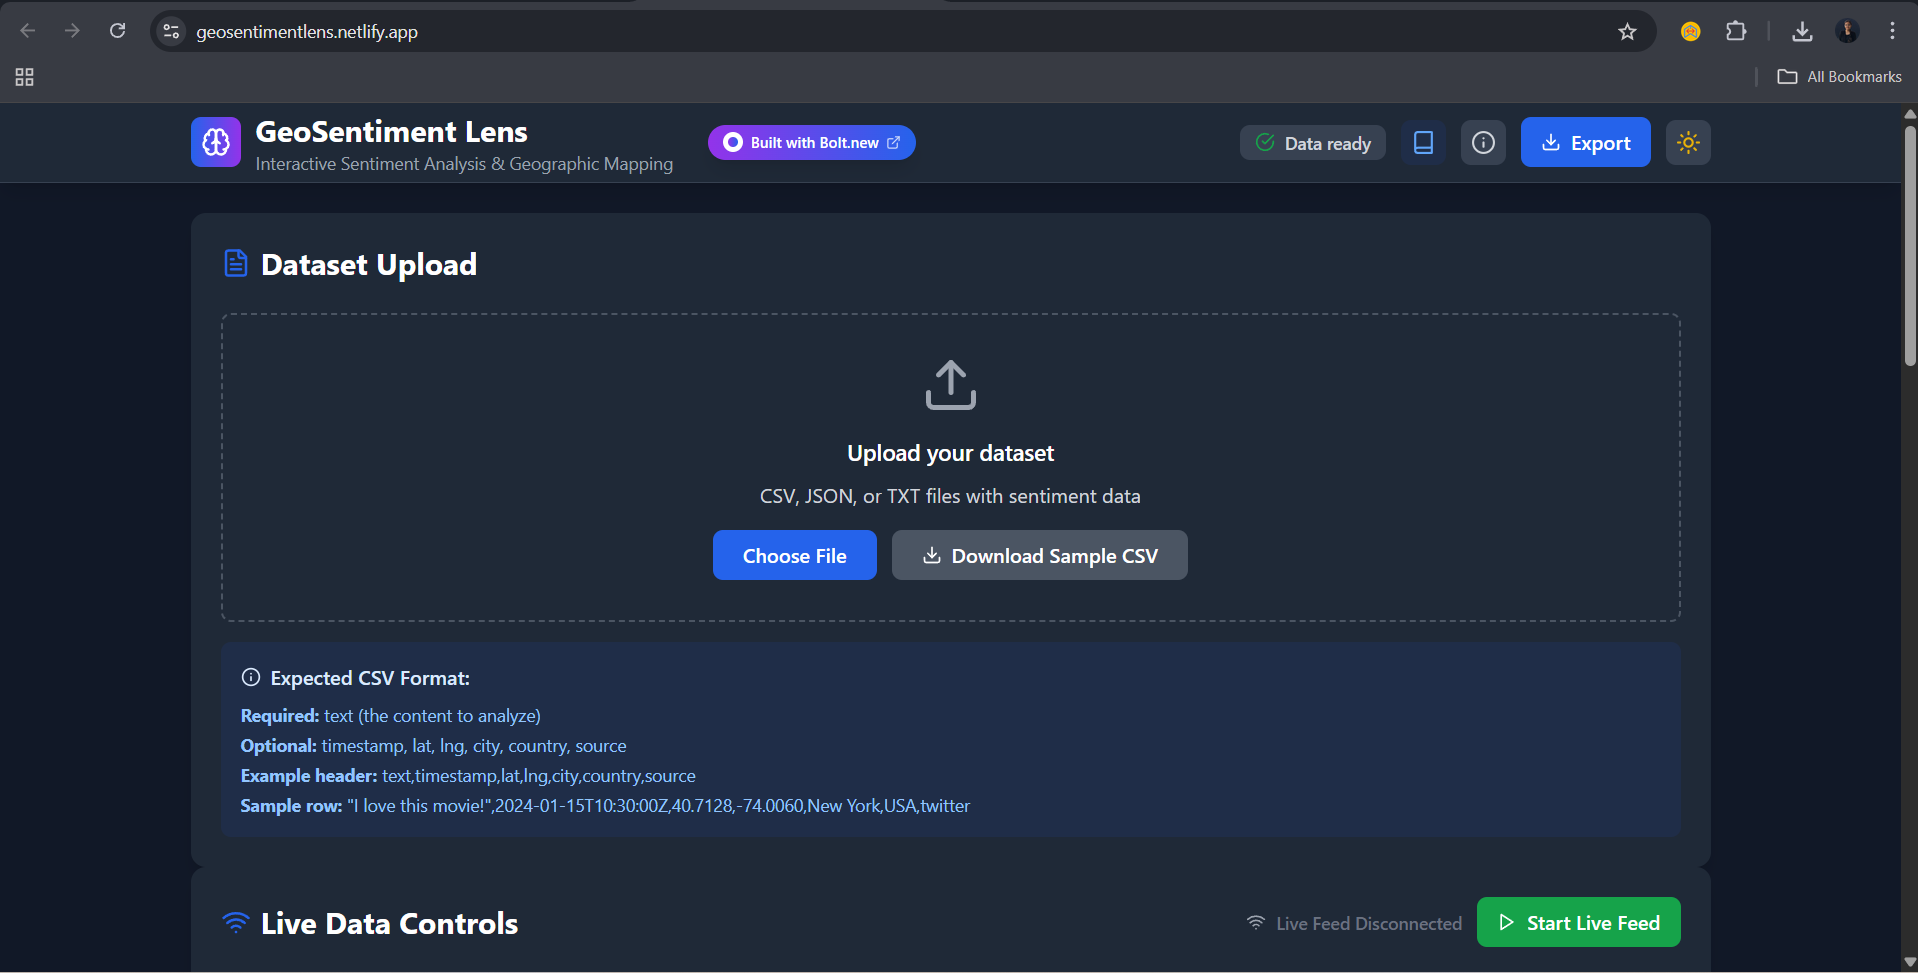
The Landing Page where user can either upload a dataset or use live data fetching option.
-
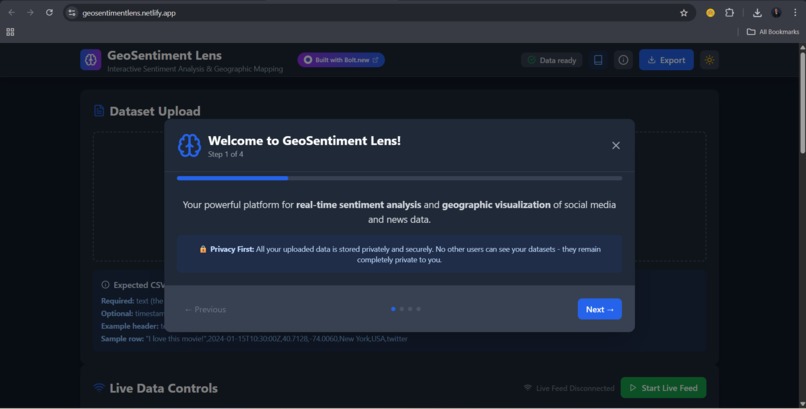
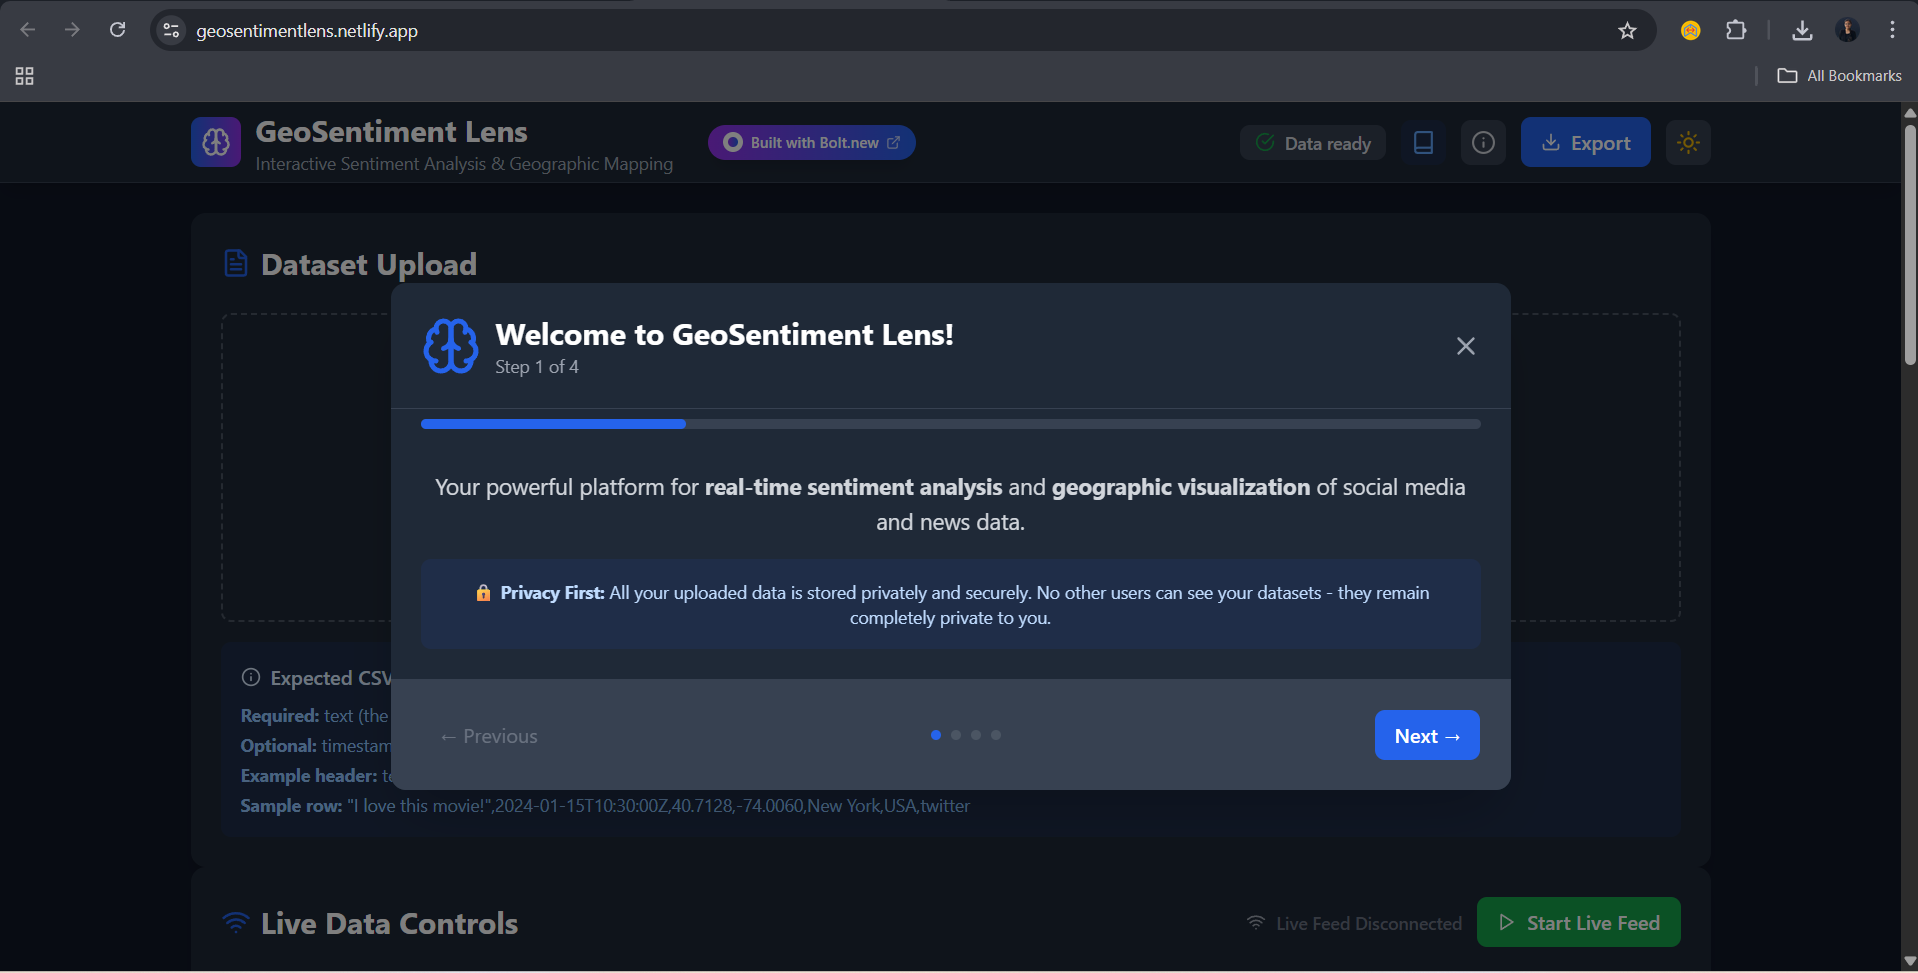
The Opening Page where the user is given information about the website.


Inspiration
Understanding how public sentiment shapes global narratives has become more critical than ever. I wanted to build a platform that doesn't just process text sentiment but shows how emotions, opinions, and trends evolve geographically and over time. Existing tools often lacked either real-time data, clear geographic visualization, or accessibility — that gap inspired me to create GeoSentiment Lens.
What it does
GeoSentiment Lens is an interactive, AI-powered platform that:
- Analyzes real-time sentiment from social media and news sources.
- Maps global sentiment patterns using Leaflet, an interactive world map library, with emojis, markers, and heatmaps.
- Detects emotions like Joy, Sadness, Anger, Fear, and Surprise.
- Shows sentiment trends over time through interactive timelines.
- Tracks keyword and hashtag trends globally.
- Provides a comprehensive dashboard to visualize sentiment scores, emotion breakdown, trend graphs, and data insights.
- Allows users to upload custom datasets and generate sentiment insights.
- Fetches live data using Twitter API and News API integrations.
How we built it
- The app was built entirely using Bolt AI, leveraging its no-code capabilities for rapid development.
- Supabase was integrated for secure, persistent dataset storage and user authentication.
- Twitter API and News API were connected on the backend to fetch live data.
- Prompt engineering within Bolt was used to automate logic for sentiment analysis and data visualization.
- Sentiment and emotion detection are handled using AI models integrated through Bolt, with processing logic secured in the backend.
- Leaflet was used to build an interactive, zoomable, global map that displays sentiment patterns visually.
- The dashboard provides real-time summaries, graphs, and interactive components for easy sentiment monitoring.
Challenges we ran into
- Configuring live API integrations and ensuring smooth real-time updates.
- Ensuring dataset uploads persist in the system rather than disappearing after refresh.
- Handling accurate sentiment and emotion detection without overcomplicating the user interface.
- Managing map markers, heatmaps, and emojis to reflect live and analyzed data properly on the Leaflet map.
- Structuring prompt instructions to make Bolt perform exactly as intended.
- Designing a dynamic and intuitive dashboard that updates with real-time and processed data.
- Navigating API rate limits, especially with Twitter's free tier.
Accomplishments that we're proud of
- Successfully built a fully functional, real-time sentiment and geo-mapping platform without extensive manual coding.
- Integrated live Twitter and news data into the system securely through backend logic.
- Enabled users to upload their own datasets and see meaningful sentiment analysis.
- Implemented an interactive world map using Leaflet for geographic sentiment visualization.
- Designed a comprehensive dashboard with real-time charts, graphs, and emotion breakdowns.
- Learned how to leverage prompt engineering to control app logic effectively within Bolt.
What we learned
- How powerful no-code platforms like Bolt AI can be when combined with good backend planning.
- Effective use of Supabase for data storage and authentication.
- How to integrate external APIs for live data processing.
- Using Leaflet to build interactive, zoomable maps for geographic data visualization.
- The importance of structuring prompts clearly to guide AI behavior.
- Basics of real-time data handling, dashboard design, and interactive visualizations.
- Practical challenges of working with live social media data and news feeds.
What's next for GeoSentiment Lens - Interactive Sentiment & Geo-Mapping
- Expanding to support additional live data sources beyond Twitter and News API.
- Improving emotion detection with more advanced AI models.
- Adding deeper filtering options for the map and dashboard.
- Enhancing timeline visualizations to show more detailed trends.
- Optimizing performance for large datasets.
- Adding advanced features to the dashboard like comparison charts and user-customizable reports.
- Exploring mobile-friendly versions for on-the-go sentiment tracking.
- Making the platform accessible to non-technical users through further UI improvements.
Built With
- and-lucide-react-for-icons.-development-tools:-vite-as-the-build-tool-and-development-server
- and-sql.-frontend-framework/libraries:-react-for-the-user-interface
- css
- eslint
- eslint-for-code-linting
- html
- javascript
- leaflet-and-react-leaflet-for-interactive-maps
- leaflet.js
- luicde-react
- postcss
- postgresql
- react
- react-leaflet
- sql
- supabase
- tailwind
- tailwind-css-for-styling
- typescript
- vite

Log in or sign up for Devpost to join the conversation.