-
Demo
Inspiration
We are inspired by the importance of oil and gas in the present time, and a desire to innovate new ways to show data.
What it does
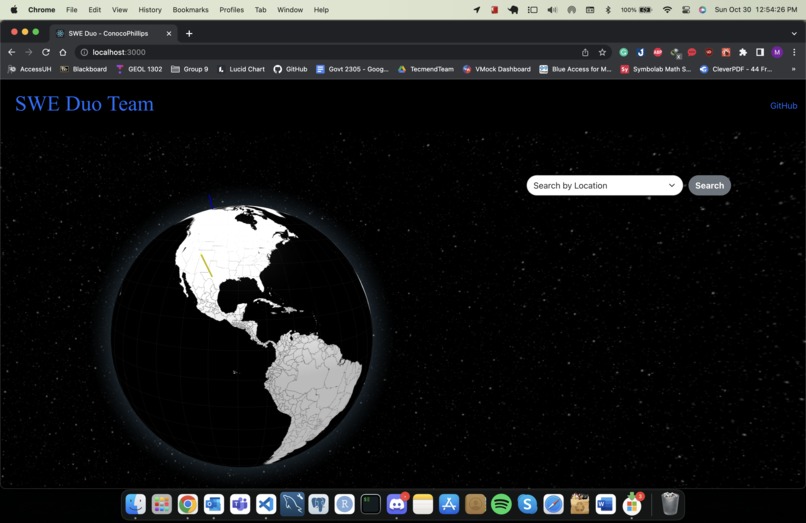
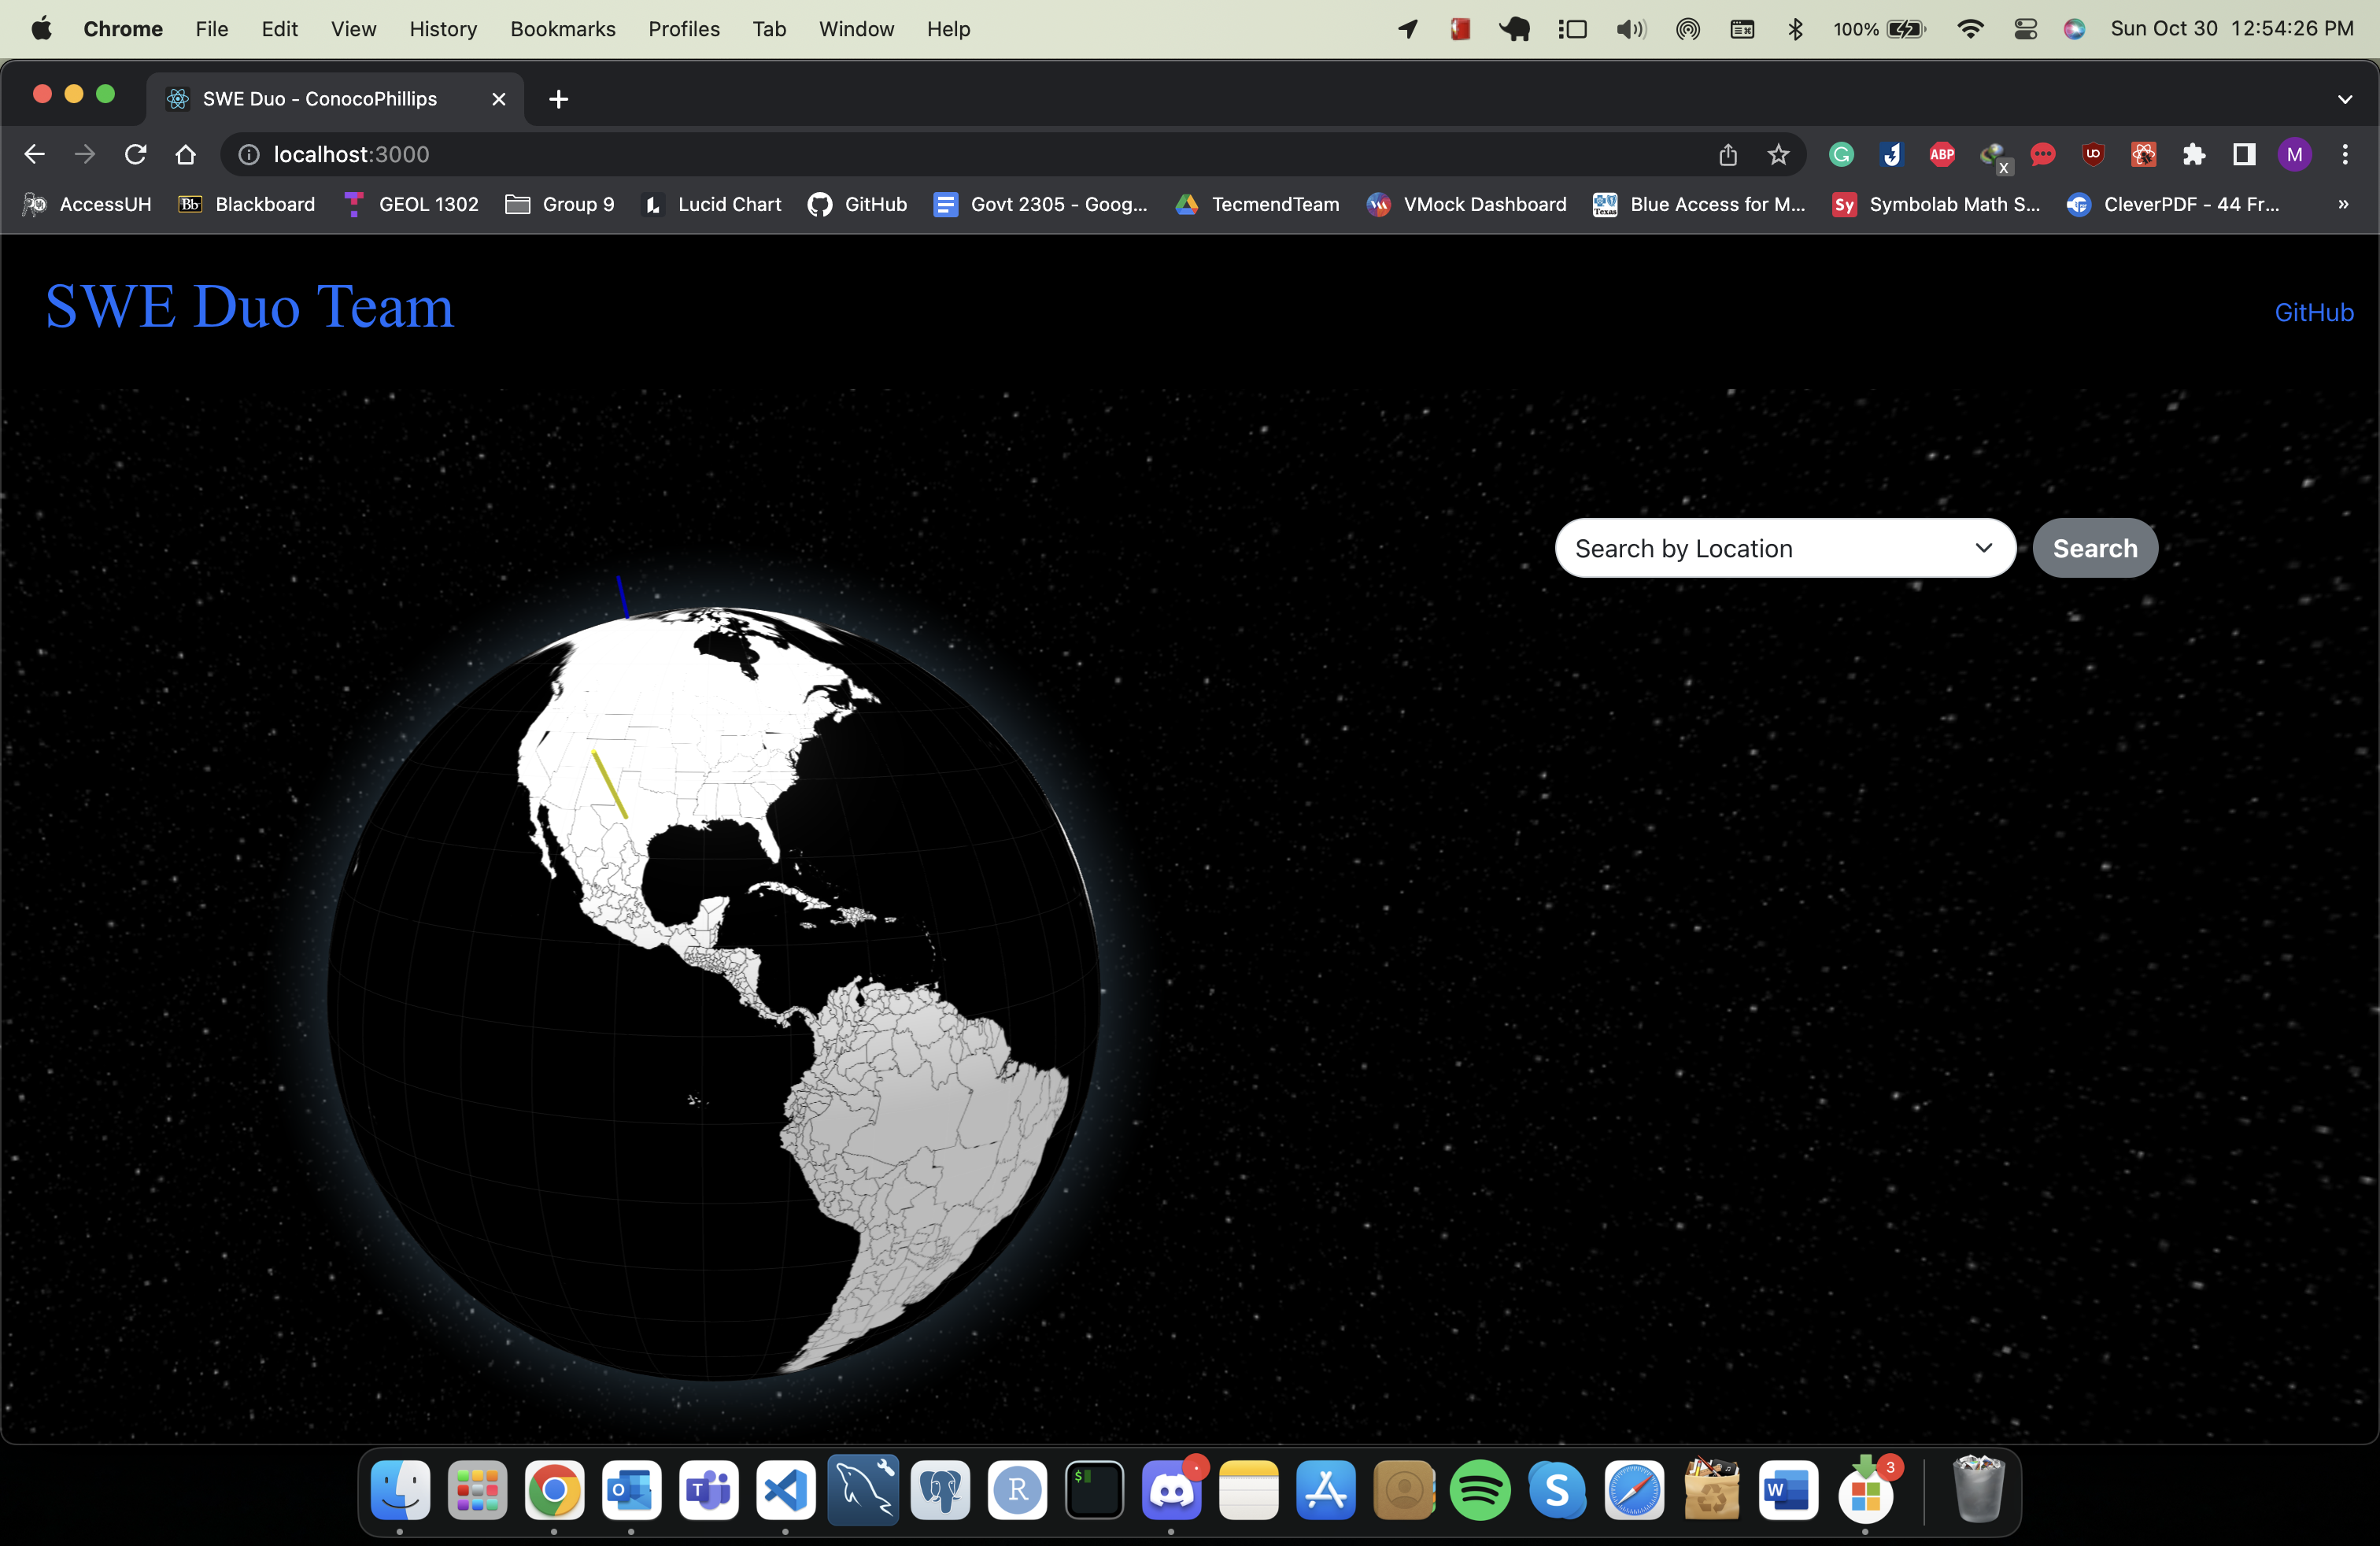
The website has a globe with interactive points, each representing an individual or group of oil/gas wells in each region of the US, displaying total regional production, the share of total national production, companies, and barrels of oil equivalent (BOE).
How we built it
We utilize ReactJS and ThreeJS to create this interactive 3D website, with data extracted from JSON files.
Challenges we ran into
This is our first-ever attempt to make a website with 3D objects so we went through several problems with the globe, map display, and other elements.
Accomplishments that we're proud of
We have been working in such a short time yet able to deliver a satisfying UI/UX with informative data.
What we learned
How to cooperate as a team, work under pressure and learn new technologies quickly.
What's next for CodeRed_2022 - ConocoPhillips
We will keep working on this website to finalize it.

Log in or sign up for Devpost to join the conversation.