-
-
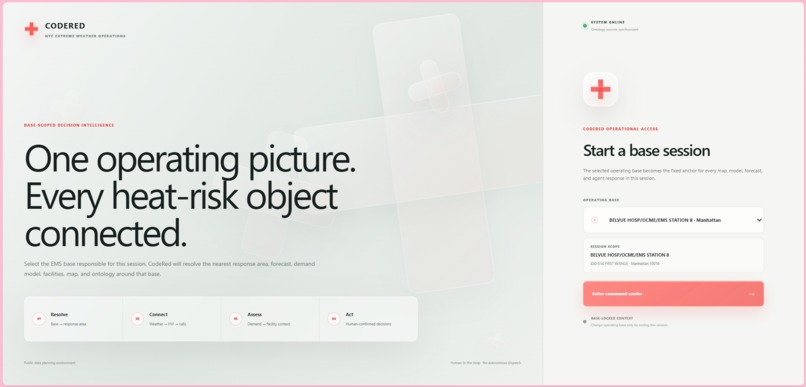
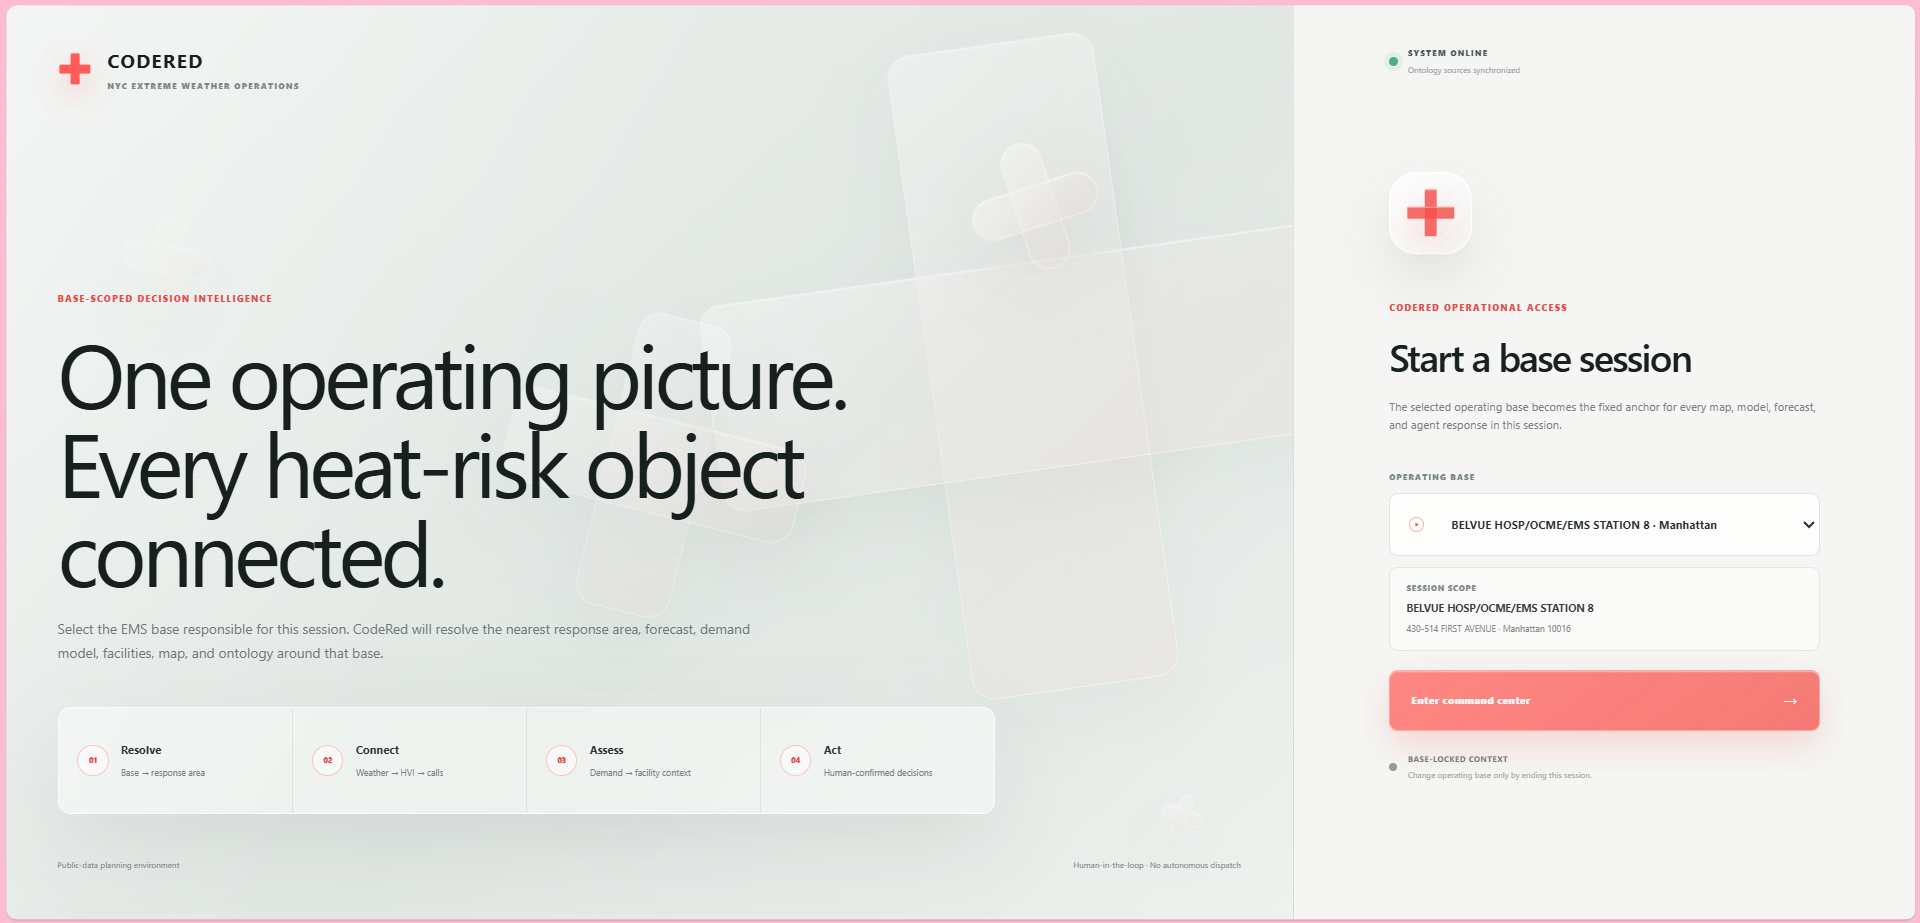
Login Tab
-
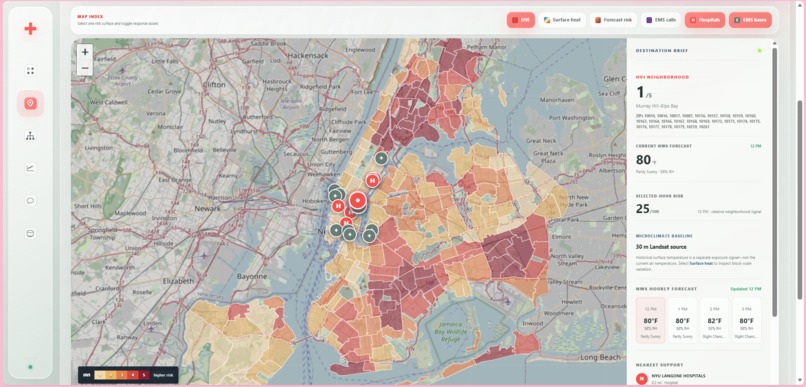
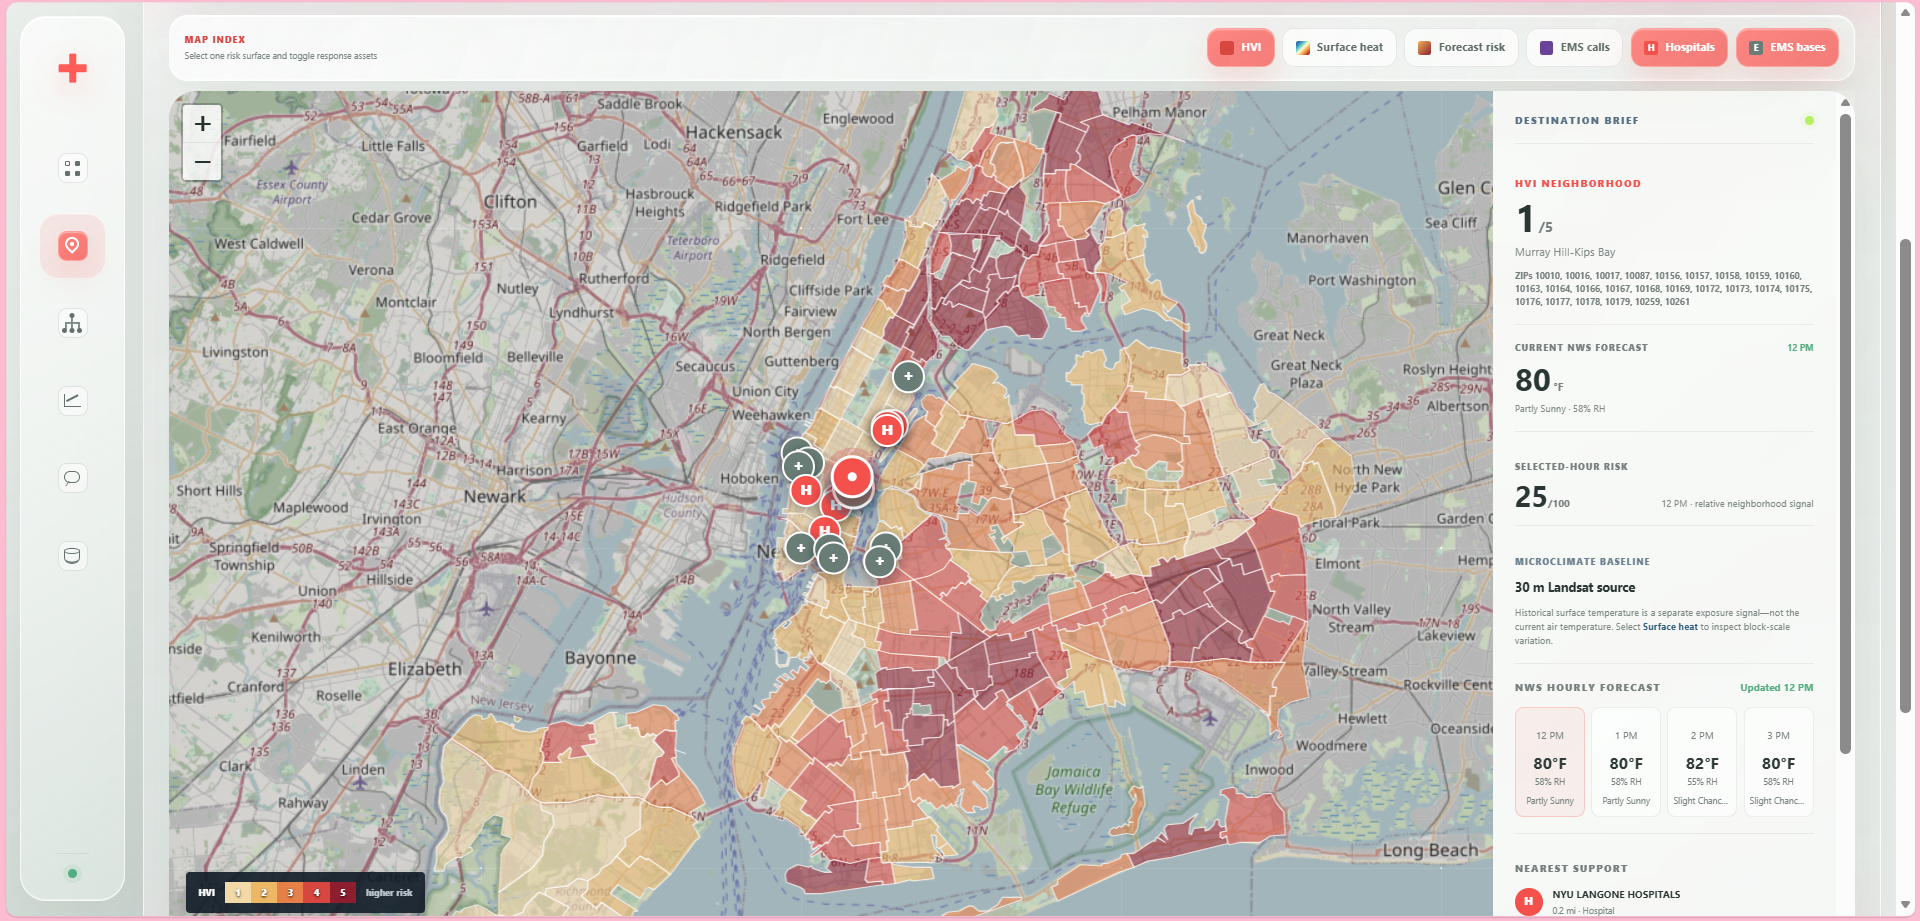
Heat Map Tab
-
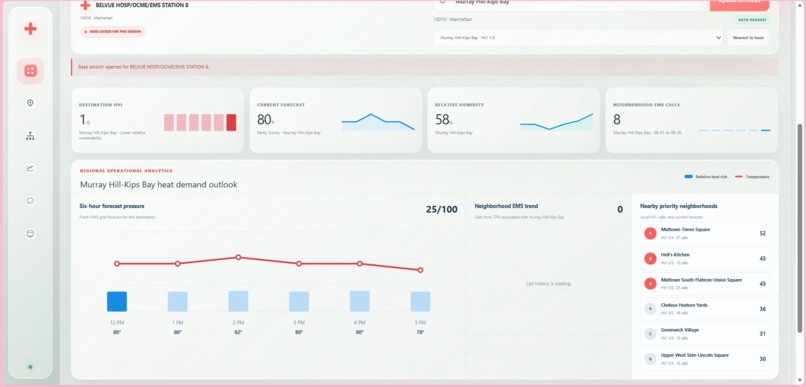
Operations Tab
-
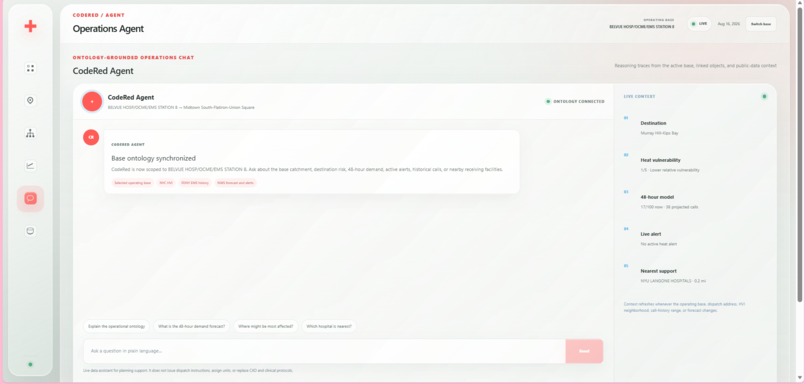
Agent Tab
-
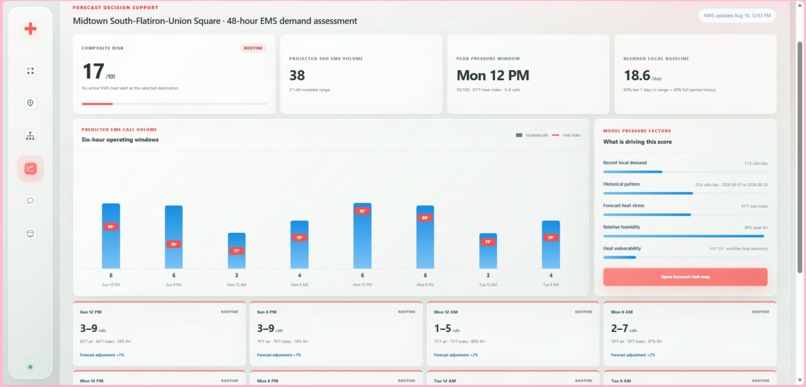
Risk Assessment Tab
-
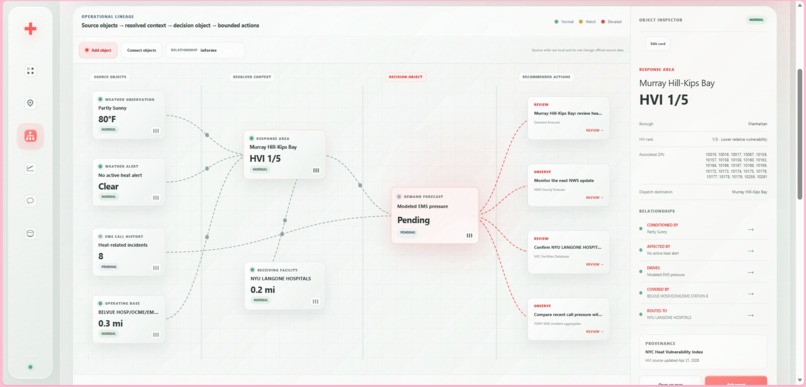
Ontology Tab
CodeRed NYC
Inspiration
Extreme heat does not affect every New York City neighborhood equally. The same temperature can produce very different medical risks depending on residents’ ages, chronic health conditions, housing quality, access to air conditioning, tree coverage, and existing emergency demand.
My experience as an EMS crew member made this challenge feel especially urgent. During extreme weather, responders need more than a citywide temperature reading. They need to understand where demand may rise, which communities are most vulnerable, and what resources are available near a specific incident.
I created CodeRed NYC as an operational decision-support dashboard that brings these signals into one location-centered view.
What it does
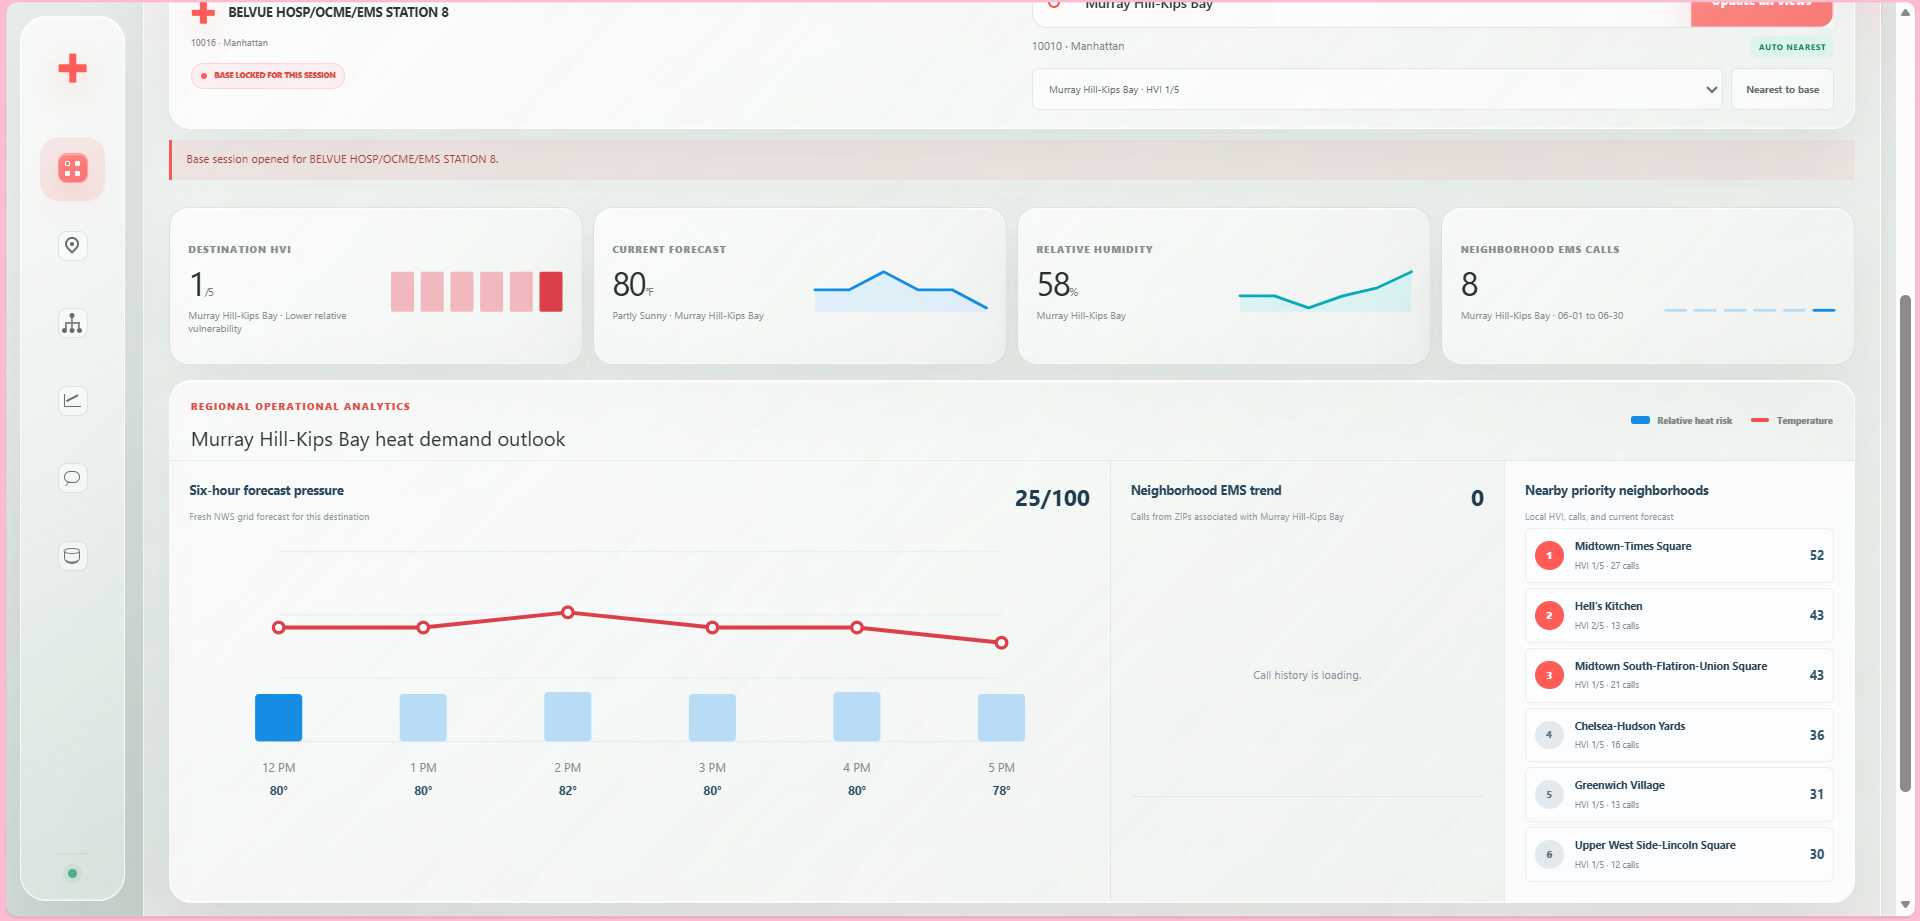
CodeRed helps EMS teams assess heat-related risk around an operating base, dispatch destination, or entered New York City address.
With CodeRed, users can:
- Select an EMS operating base to establish a fixed operational area.
- Enter an exact address, place, ZIP code, or neighborhood.
- Automatically identify nearby hospitals while retaining manual destination control.
- View a neighborhood-level map centered on the selected location.
- Toggle layers for the Heat Vulnerability Index, EMS call history, forecast risk, hospitals, and EMS facilities.
- Compare location-specific temperature, humidity, heat index, active alerts, and expected operational pressure.
- Rank nearby neighborhoods using vulnerability, recent demand, historical patterns, and forecast conditions.
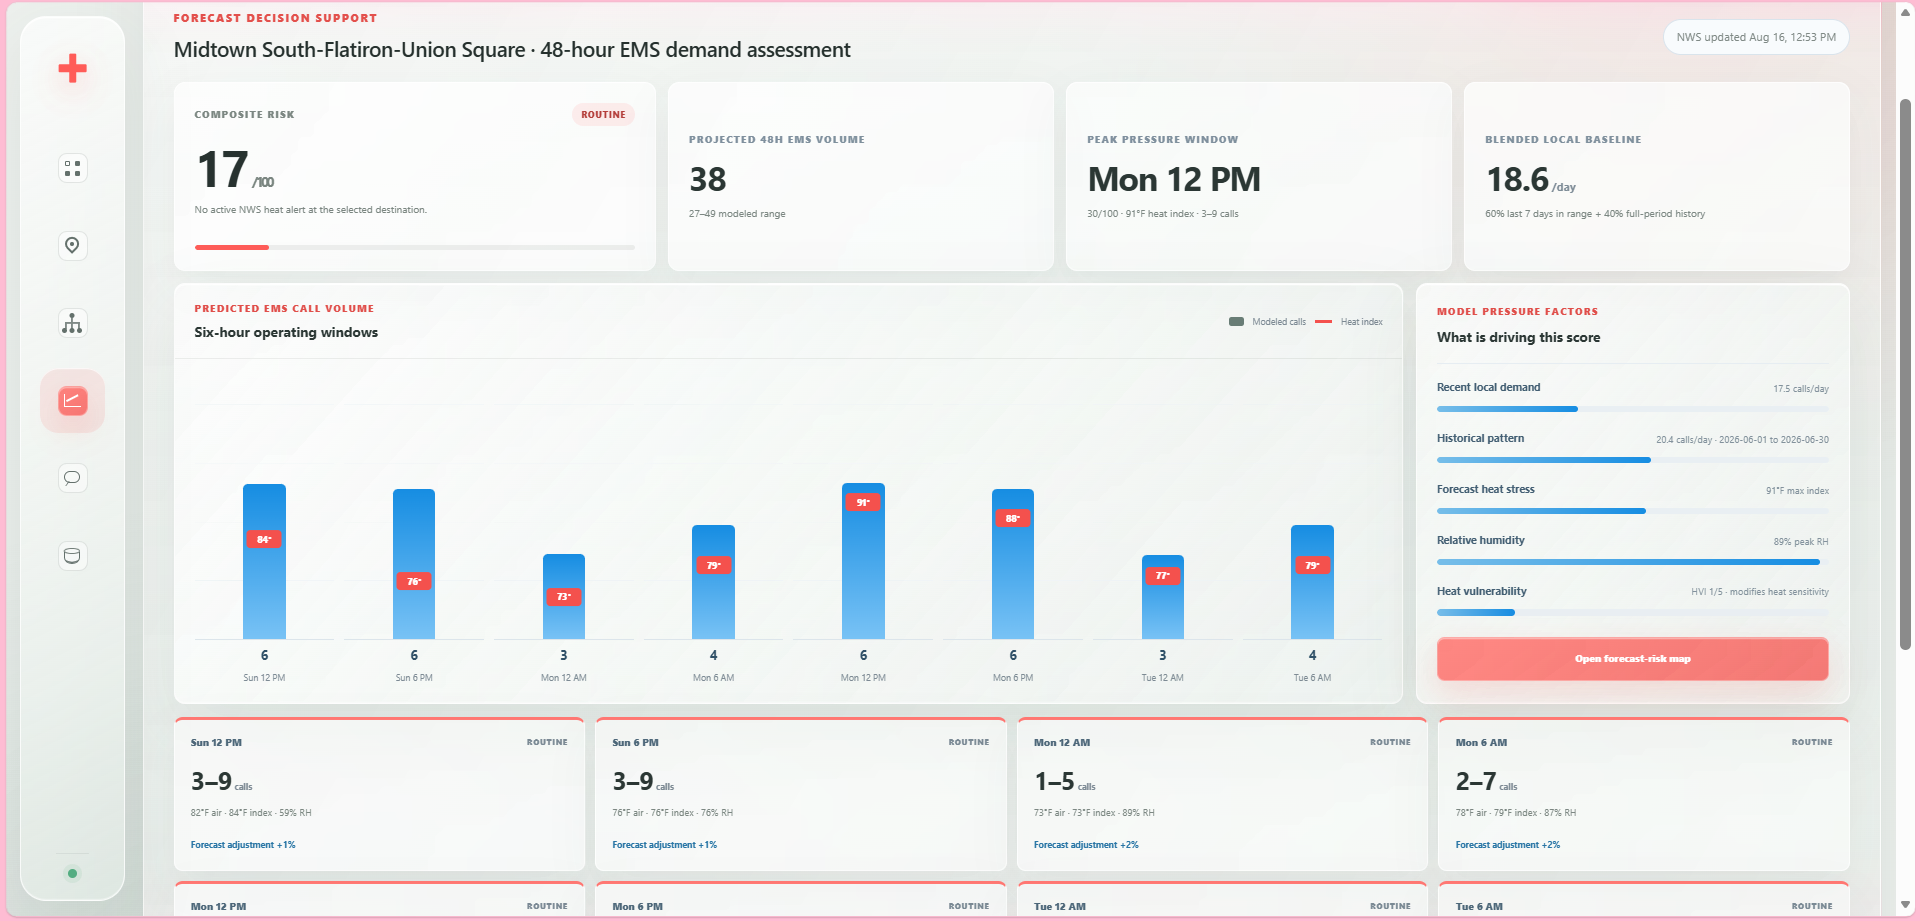
- Review a 48-hour EMS demand estimate divided into six-hour operational windows.
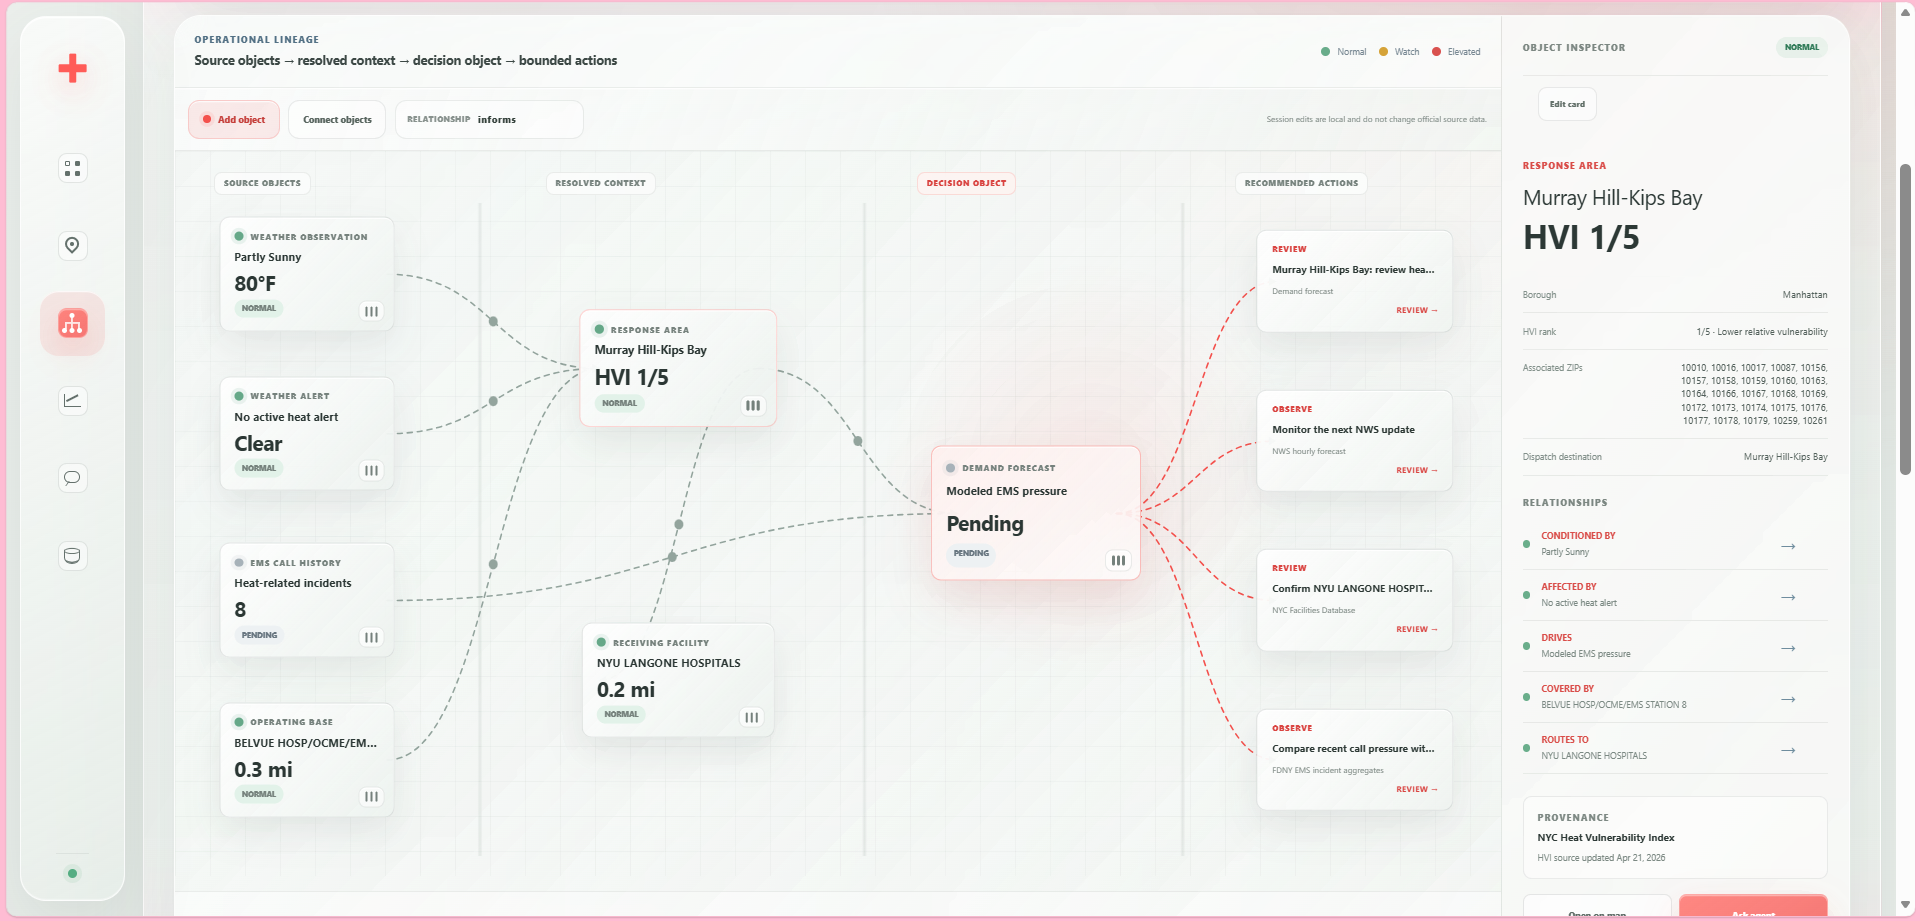
- Use an interactive ontology to examine how weather, vulnerability, call demand, facilities, and response areas are connected.
- Add, reposition, connect, and edit operational objects within the ontology workspace.
- Create operational tasks, mark them as complete, and review them in an archive.
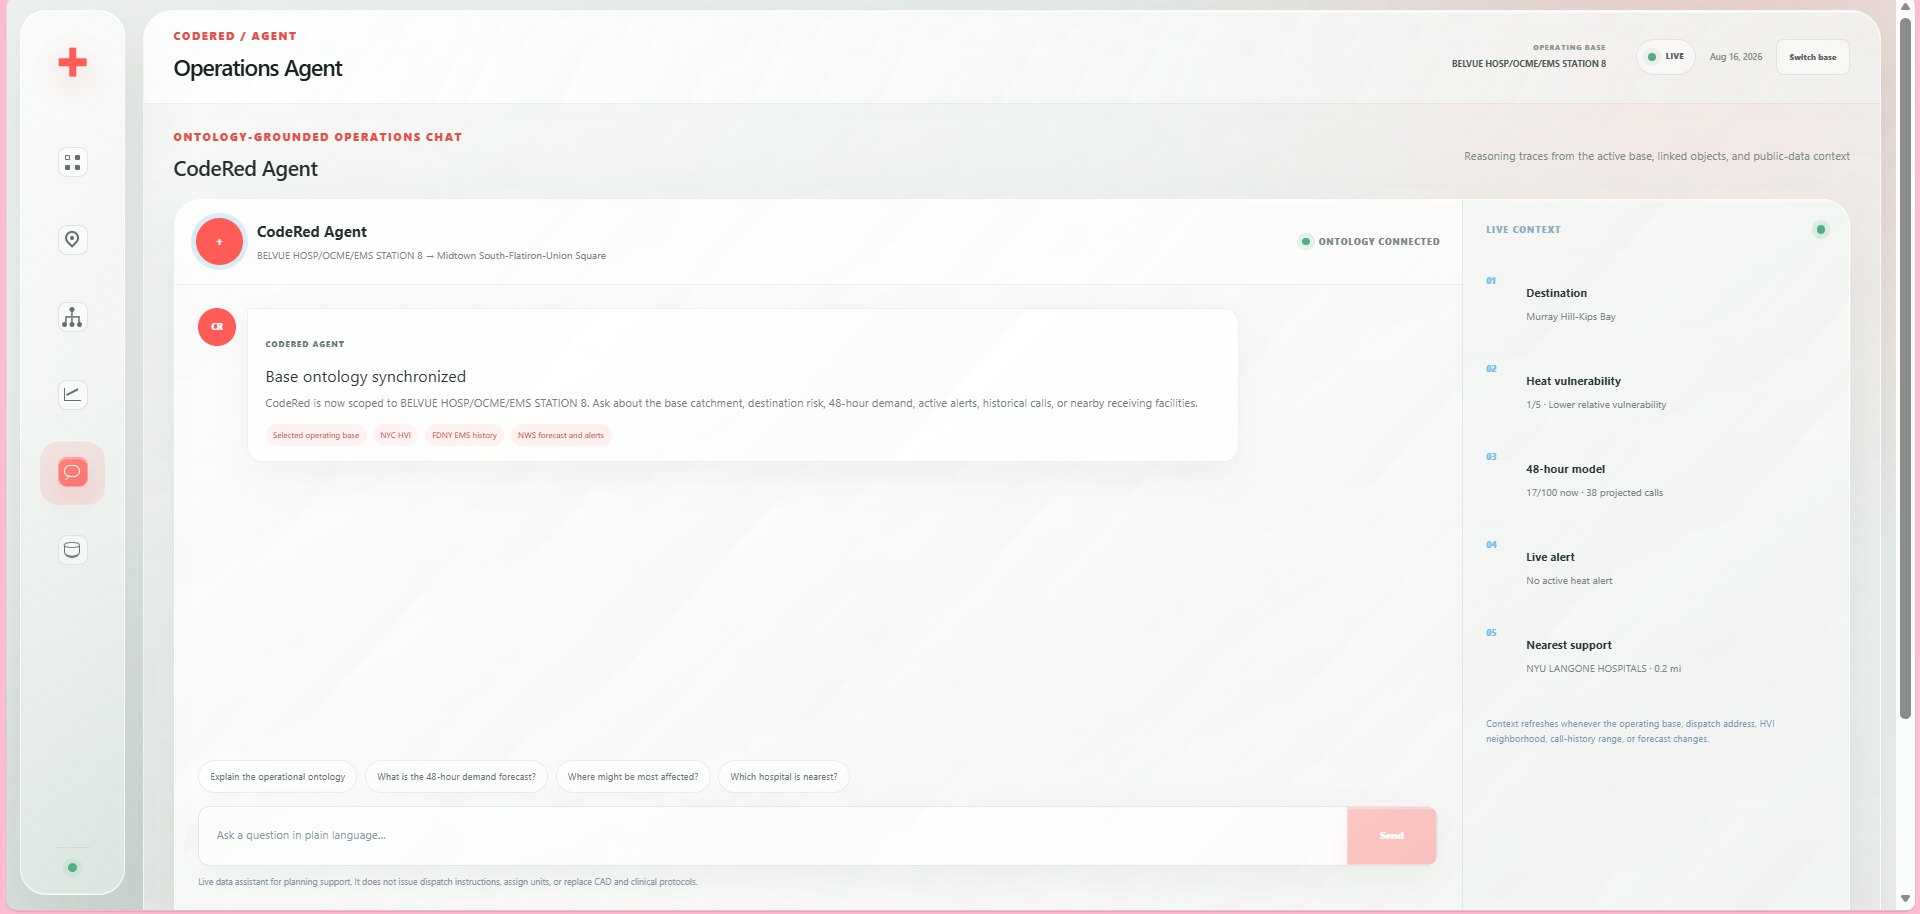
- Ask the CodeRed Agent questions such as “Where might demand be highest?” or “Which nearby neighborhood is most vulnerable?”
- Update the operations dashboard, map, graphs, risk assessment, and agent context simultaneously without being redirected to another section.
CodeRed is designed to support situational awareness and preparedness. It does not replace computer-aided dispatch, unit-status systems, clinical judgment, or official emergency protocols.
How I built it
I built CodeRed as a responsive TypeScript and React application with a modern command-center interface designed for information-dense EMS workflows.
The dashboard integrates several public data sources:
- NYC Heat Vulnerability Index: Neighborhood-level vulnerability rankings.
- FDNY EMS Incident Dispatch Data: Recent and historical EMS call aggregates.
- National Weather Service API: Location-specific hourly forecasts, humidity, precipitation probability, heat conditions, and active alerts.
- NYC Facilities Database: Mapped hospital and EMS facility locations.
- NYC Planning GeoSearch: Address and place geocoding.
- NYC neighborhood boundaries: Geographic visualization and neighborhood selection.
Leaflet and neighborhood boundary data power the interactive map. Selecting a neighborhood or entering an address updates the map, operational metrics, graphs, forecast, nearby facilities, risk assessment, ontology, and agent context through a shared location state.
Rather than estimating EMS demand from temperature alone, CodeRed uses a transparent composite model:
Predicted demand = (0.60 × recent demand + 0.40 × historical demand) × (1 + weather adjustment + HVI adjustment + time adjustment)
The model uses the following components:
- Recent demand represents recent local EMS activity.
- Historical demand represents the longer-term local baseline.
- Weather adjustment accounts for forecast heat index, humidity, and active alerts.
- HVI adjustment accounts for neighborhood heat vulnerability.
- Time adjustment accounts for time of day, day of the week, and weekend patterns.
I bounded each adjustment to prevent a single variable from producing unrealistic spikes. The resulting call-volume range is intentionally conservative and is presented as a directional planning estimate, not a guaranteed prediction.
Challenges I ran into
One of the largest challenges was connecting datasets that use different geographic units. Weather observations are returned by latitude and longitude, HVI values are organized by neighborhood, EMS incidents may be associated with ZIP codes or incident locations, and facilities are represented as individual coordinates. I developed mapping logic that connects these sources while clearly identifying whether a value is neighborhood-, ZIP-, or location-based.
Another challenge was preventing projected call volumes from becoming unrealistically high. Early versions allowed heat conditions to influence the model too strongly. I revised the calculation so that it begins with recent and historical local demand, caps unusual increases, and then applies limited adjustments for weather, HVI, and temporal patterns.
I also needed to keep every dashboard section synchronized. Changing an address now updates the operations view, regional forecast, charts, map focus, nearby facilities, risk model, ontology context, and CodeRed Agent without forcing the user into another section.
Designing the ontology workspace introduced an additional challenge. The cards needed to remain editable and draggable while their relationships updated visually. I also had to distinguish live public-data objects from temporary operator-created objects and ensure that recommendations remained advisory.
Finally, I worked to display dense emergency-planning information without making the interface feel cluttered. I used restrained colors, translucent surfaces, compact charts, clear status labels, and distinct operational sections while keeping the most important information visible.
Accomplishments I am proud of
- I created an address-driven EMS heat-risk dashboard rather than a static heatmap.
- I combined live weather, structural vulnerability, recent calls, historical demand, and nearby resources in one assessment.
- I developed forecasts and graphs that change according to the selected NYC region.
- I added automatic nearby-hospital identification with manual destination control.
- I built an interactive map with selectable neighborhoods, facility overlays, and call-history filtering.
- I created a transparent 48-hour demand model with visible contributing factors.
- I developed an editable ontology that connects weather, locations, facilities, demand, risks, and operational actions.
- I added task creation, completion, archiving, and reopening within the operational workspace.
- I created a conversational, dashboard-aware CodeRed Agent.
- I designed the application to resemble a serious EMS operations system.
- I clearly documented the model’s limitations so estimates are not presented as confirmed dispatch forecasts.
What I learned
I learned that emergency risk cannot be represented by a single dataset. Temperature describes physical exposure, but it does not fully explain community vulnerability or operational demand. A more useful system combines what is happening now, what has happened recently, who is most vulnerable, and what resources are nearby.
I also learned the importance of transparent modeling. For an EMS-facing tool, displaying the evidence and assumptions behind an estimate is more responsible and useful than presenting an unexplained prediction.
Building the ontology helped me think beyond displaying isolated metrics. Weather conditions affect locations, locations contain vulnerable populations, vulnerability influences demand, and demand affects facilities and operational decisions. Representing those relationships made the dashboard more useful as a decision-support system.
Most importantly, I learned that public data becomes far more actionable when it is organized around a responder’s real workflow: establish an operating base, enter a location, understand nearby risk, identify resources, prepare for the next operating window, and document an appropriate response.
What’s next for CodeRed NYC
My next goal is to expand CodeRed from a heat-response dashboard into a multi-hazard EMS preparedness platform.
Future versions could include:
- Extreme cold and wind-chill risk.
- Heavy rain, flash flooding, and street-level flood exposure.
- Snow, ice, and winter access constraints.
- Wildfire smoke and poor air-quality events.
- Severe wind, coastal storms, and power-outage risk.
- Event, crowd, and outdoor-activity demand signals.
- Verified hospital-capacity and unit-status integrations where authorized.
- Emergency travel-time and routing analysis.
- ZIP- or neighborhood-level models trained on joined hourly weather and EMS call history.
- Rolling time-split back-testing to measure forecasting performance.
- Confidence intervals, model monitoring, and documented performance by neighborhood.
- Persistent operational sessions, task histories, and supervisor-approved response plans.
- Secure integration with authorized EMS systems and real-time operational feeds.
The long-term goal is to help EMS planners move from reacting to extreme-weather call surges to preparing for them, neighborhood by neighborhood and hour by hour.

Log in or sign up for Devpost to join the conversation.