CodeJam2017 - Development Index Generator and Visualizer
Overview
The aim of this project is to allow users to assign weights to various metrics of development using the Health, Nutrition and Population Data Sheet provided in the CodeJam competition. Essentially, creating their own index for development.
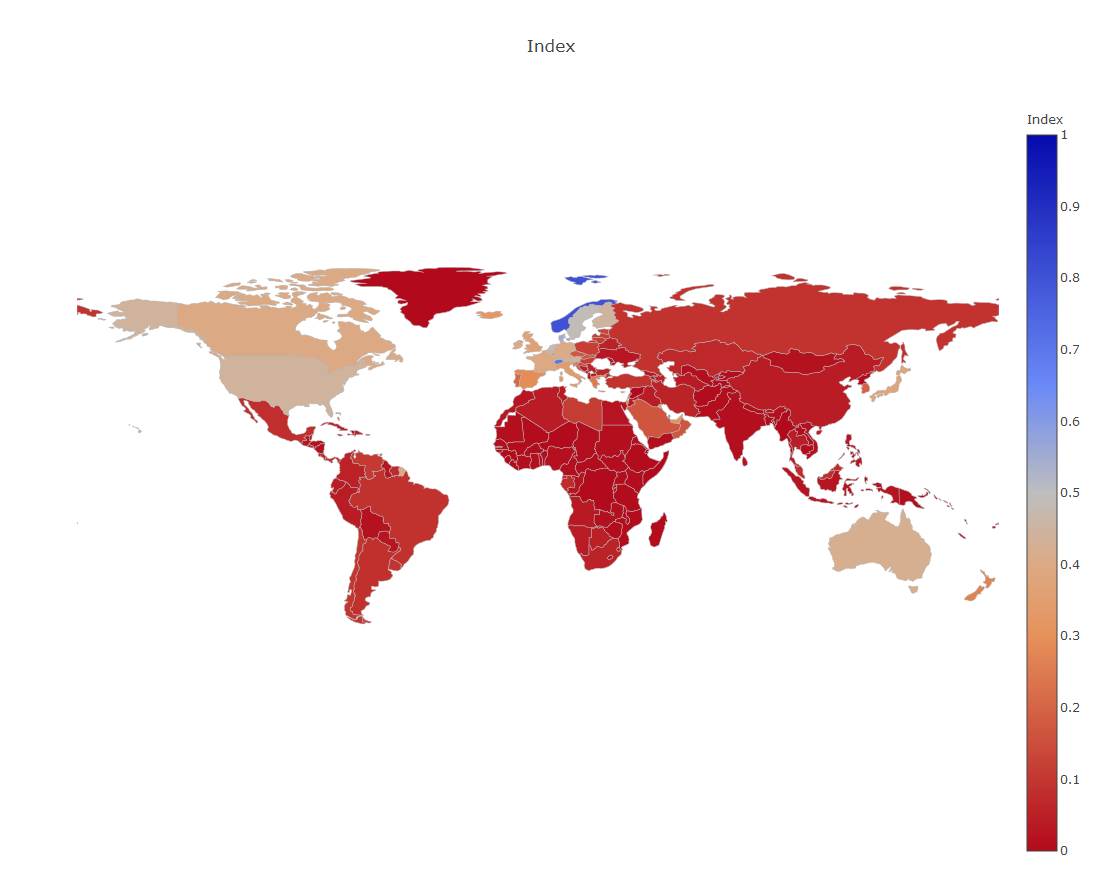
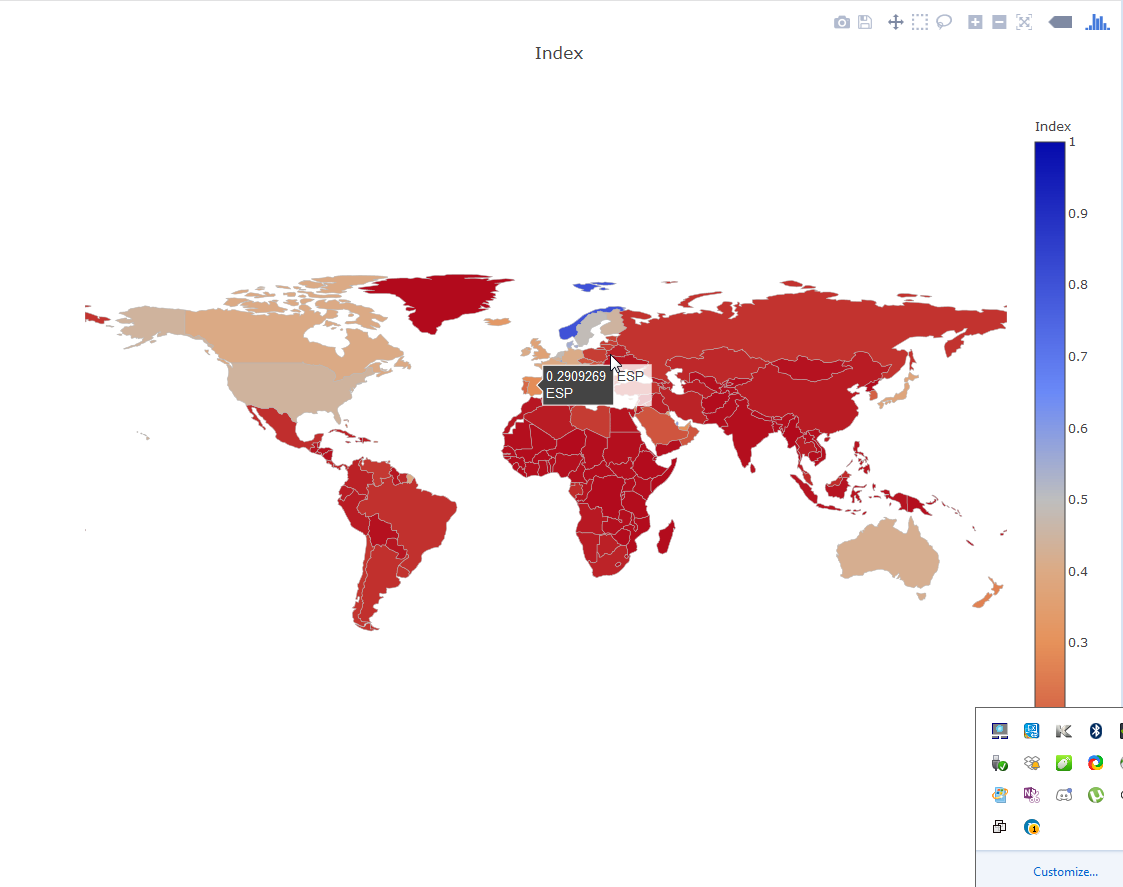
The program will then generate a chloropleth map representing a global view of countries' indices with the passed weights. This map is generated using plotly's offline plot function.
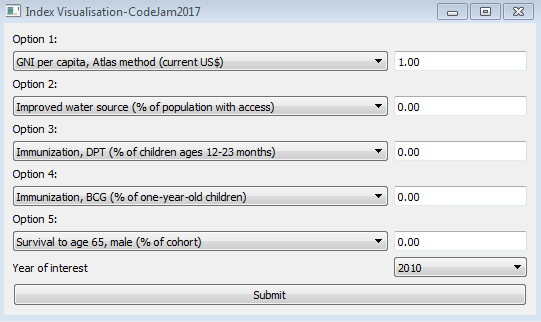
The program provides a simple GUI for users to easily be able to interact.
Dependencies
Dependencies may be installed using
python3 -m pip install --user -r requirements.txt
Note that PyQT5 must be installed manually from the RiverBank Software website
Example output
An example output of a user-defined index is in this repository, and is called index.csv. Additionally, an example html file containing the visual (chlorophleth map) is d3-world-map.html.
Key Features
- Seamless visualisation of a user-generated index.
- User has the ability to generate between single and five- dimensional indices.
- User has the option of over 48 different development metrics, encompassing a variety of areas pertinent to understanding and measuring standard of living.
- All 48 metrics were chosen rigorously from a set of over 324 metrics, primarily chosen on the basis of data completeness and homogeneity.


Log in or sign up for Devpost to join the conversation.