-
-
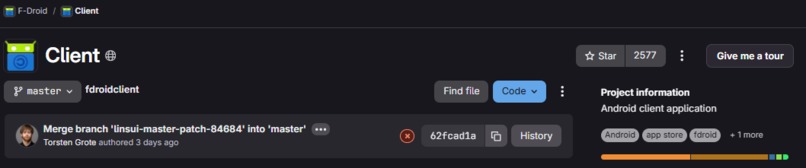
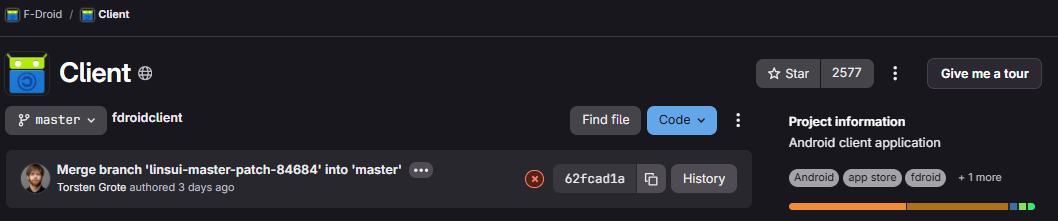
button placement
-
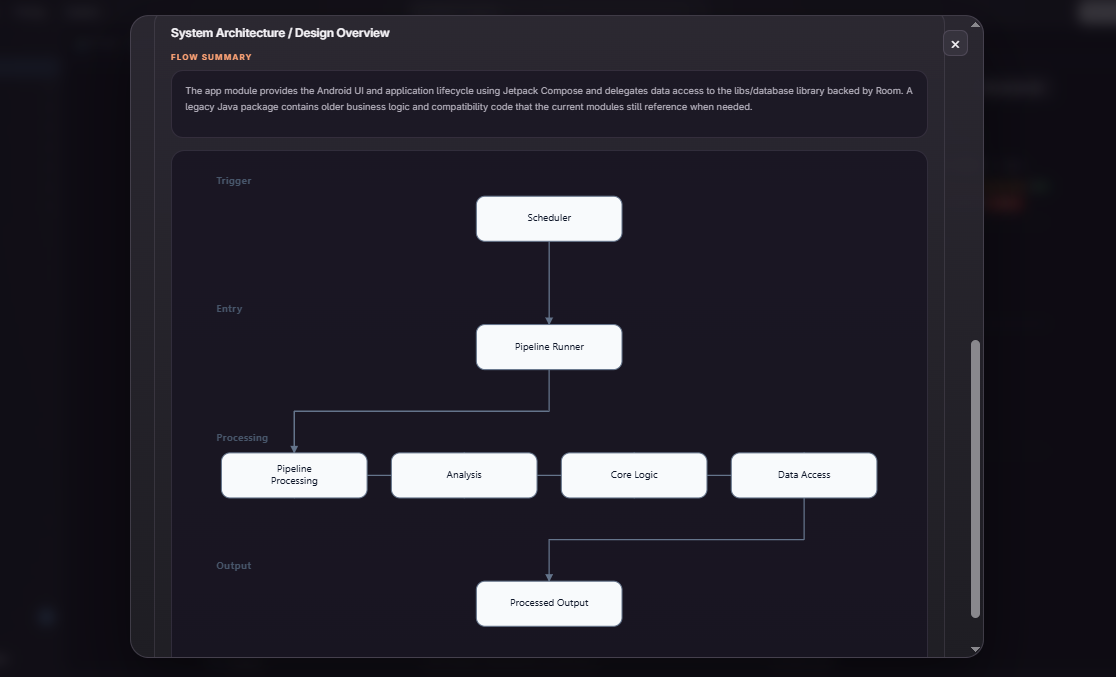
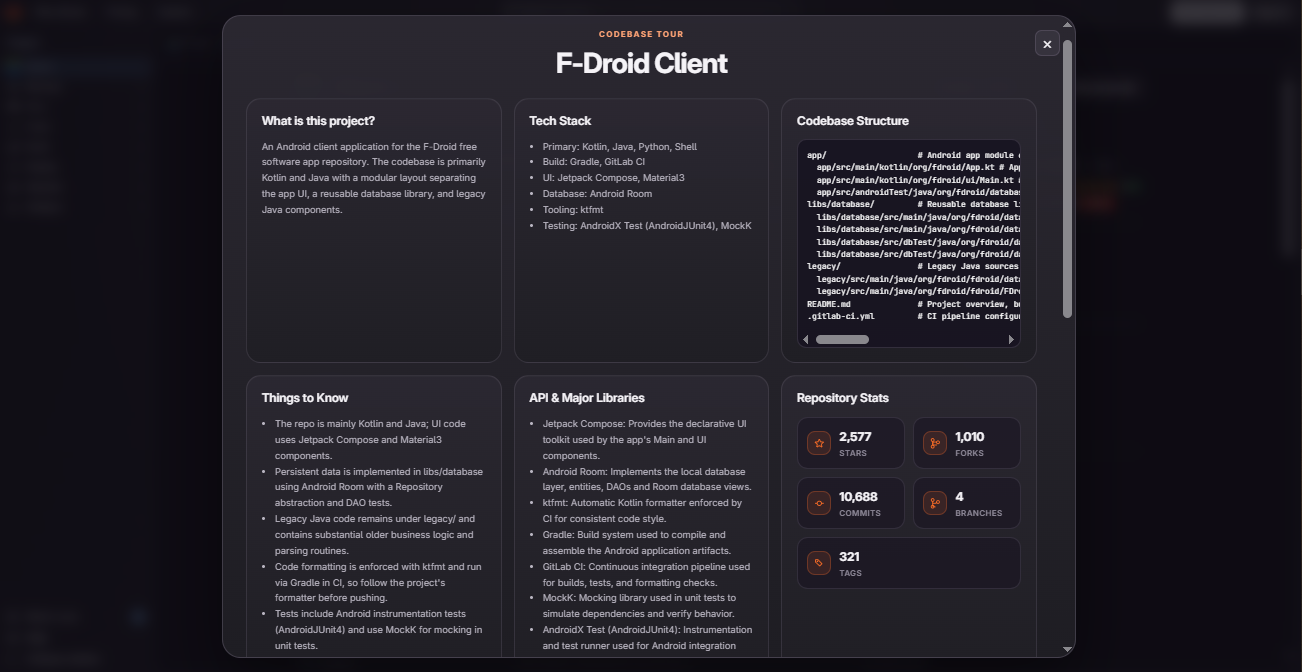
first half of output
-
second half of output
Inspiration
I was inspired by a new SVG/diagramming capability released by Anthropic and wanted to build something useful with it. I’ve also struggled with onboarding into open-source projects, so I wanted to make that process easier.
What it does
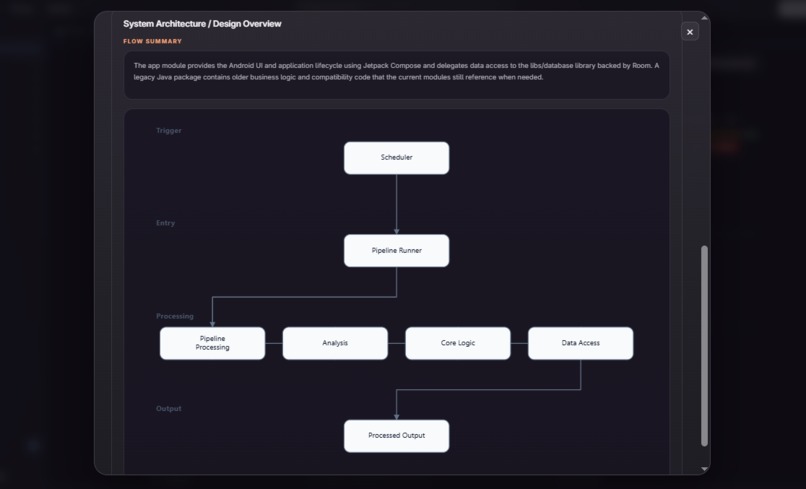
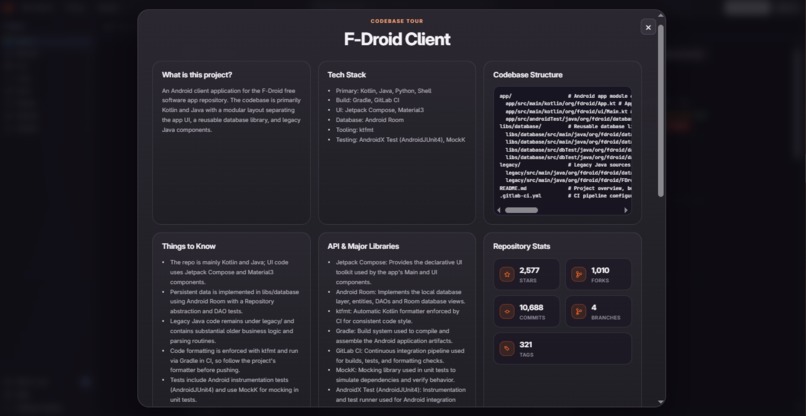
Codebase Tour Guide analyzes any repository and generates a clean dashboard plus a visual architecture diagram. It helps developers quickly understand how a codebase is structured and how it works.
How we built it
Built using GitLab, OpenAI, and Anthropic APIs, combining LLM-based analysis with SVG diagram generation.
Challenges we ran into
Time was tight since I joined the hackathon late. SVG generation was also difficult with smaller models, so I had to switch models and iterate a lot.
Accomplishments that we're proud of
I was able to get a working system done in time. The output is clean, usable, and close to what I originally envisioned.
What we learned
Learned more about working with GitLab, REST APIs, and generating structured outputs (like SVGs) with LLMs.
What's next for Codebase Tour Guide
I want to improve diagram quality and consistency, add better guardrails, and make outputs more tailored to each repository. I’d also like to refine the UI to make it more polished and approachable.
Built With
- anthropic
- extensions
- fastapi
- openai
- python
- rest

Log in or sign up for Devpost to join the conversation.