Inspiration
Developers often lose a lot of time just trying to understand an unfamiliar codebase before they can safely change it. Directory trees and raw JSON are useful for machines, but they do not help a human quickly answer: “What does this repo do?”, “Which files depend on each other?”, and “Where might the risky code be?”
CodeAtlas was inspired by that onboarding problem. I wanted a lightweight developer tool that gives a fast, honest architecture map of a local repository without executing untrusted code.
What it does
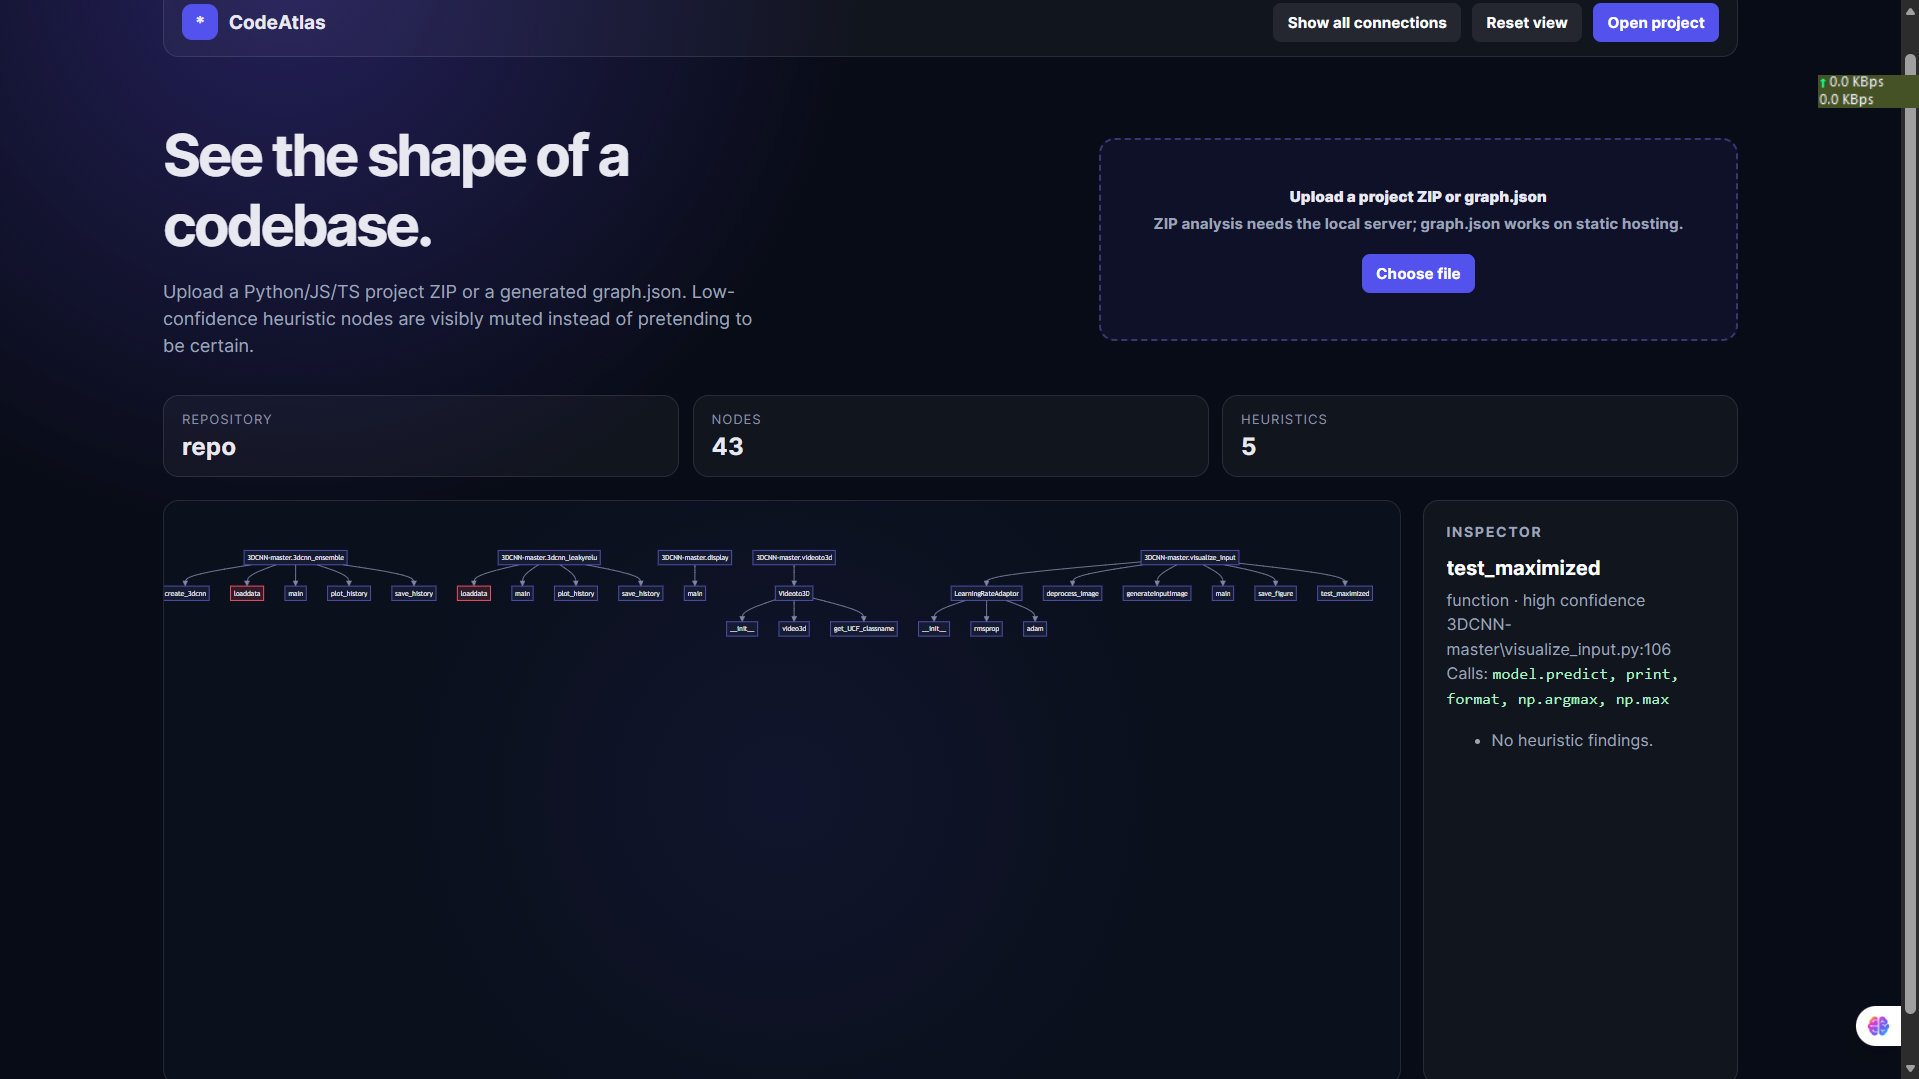
CodeAtlas analyzes a local codebase and turns it into an interactive architecture graph. It extracts modules, classes, functions, imports, calls, and common HTTP API routes, then produces a structured graph.json and a Mermaid-powered visual diagram.
The frontend lets developers click nodes to progressively expand the architecture instead of being overwhelmed by one giant static graph. It also highlights likely bottlenecks, such as nested loops, blocking I/O inside loops, and N+1-style query patterns, with human-readable explanations.
How I built it
The analysis engine is written in Python. For Python files, CodeAtlas uses the built-in ast module so it can parse code safely without running it. For JavaScript and TypeScript, it uses lightweight heuristic extraction for imports, functions, and Express-style routes.
The graph builder creates a deterministic JSON schema, and the frontend is a self-contained HTML/JavaScript app using Mermaid.js. I kept the project intentionally local-first and dependency-light so judges can clone it, run one command, and test it quickly.
I used OpenAI Codex and GPT-5.6 throughout the build process to design the project milestones, implement the AST extractor, build the bottleneck rules, write tests, refine the frontend interaction, and prepare the Devpost submission materials.
Challenges
The hardest part was balancing usefulness with honesty. Static analysis cannot perfectly understand every dynamic codebase, especially with reflection, generated code, or runtime imports. Instead of pretending to be 100% accurate, CodeAtlas includes a confidence field on every node and visually marks lower-confidence findings in the UI.
Another challenge was making the graph readable. A full architecture graph can become messy fast, so I implemented progressive disclosure: users start with top-level modules and expand only the parts they care about.
What I learned
I learned that developer tools do not need to be huge to be useful. A clear architecture map, confidence indicators, and a few explainable bottleneck checks can give developers a much faster first understanding of a repo.
I also learned that “honest uncertainty” is a product feature. Marking low-confidence nodes is better than silently guessing.
What's next
Next, I would add deeper JavaScript and TypeScript parsing, Git diff comparison, PR review comments, and CI integration so CodeAtlas can automatically show architecture changes over time.
Built With
- analysis
- architecture
- ast
- code
- codex
- css
- developer
- html
- javascript
- json
- mermaid.js
- openai
- pytest
- python
- review
- static
- tools
- visualization

Log in or sign up for Devpost to join the conversation.