-
-
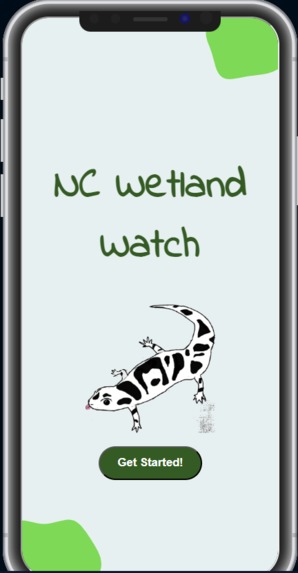
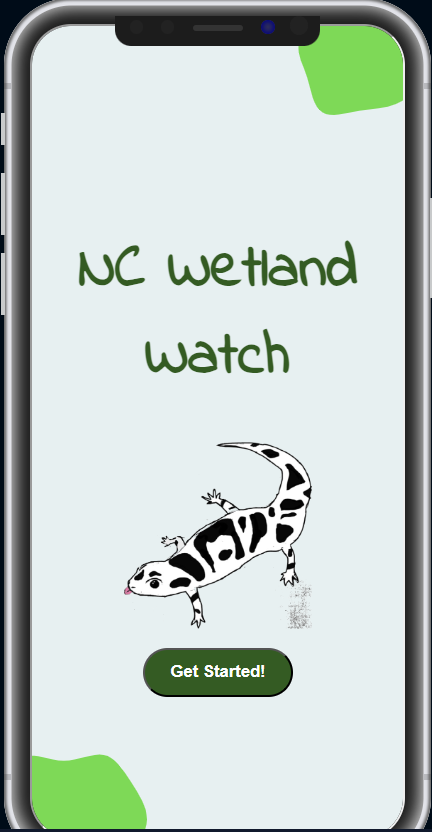
App Opening Page
-
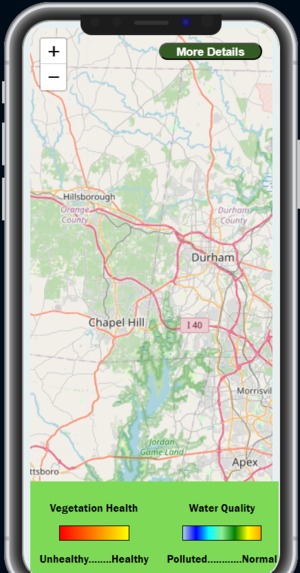
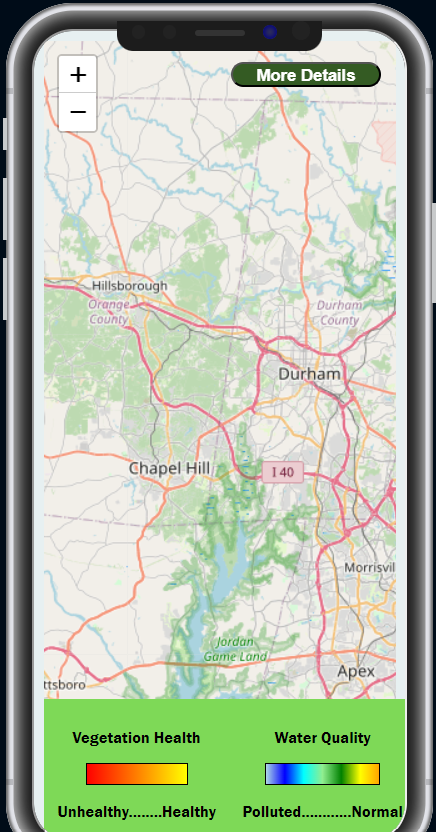
App Map Interface Page
-
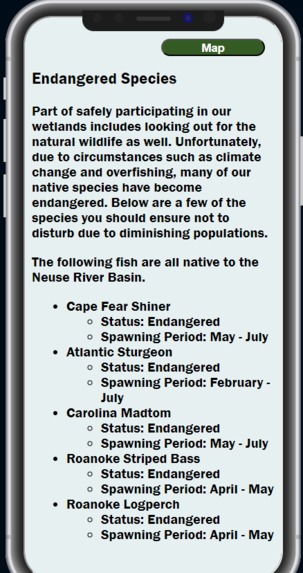
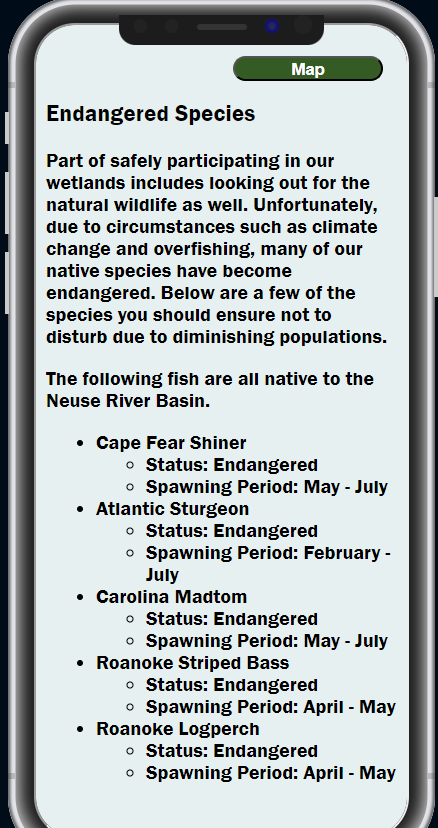
App More Details Page
Inspiration
Wetlands cover only 6% of the Earth's surface but support 40% of all plant and animal species. Yet, here in North Carolina, these vital ecosystems are under threat. Since 1780, we’ve lost nearly half of our wetlands. Flooding, pollution, and habitat destruction are accelerating this decline, putting over 60 species of wildlife at risk. And without real-time data, we don’t even know which areas need urgent protection. They provide essential habitats for many species, including 70% of the state's endangered species. However, the general public lacks awareness and knowledge of the health of the wildlife, plants, and water quality within the wetlands. We wanted to create an easy-to-use application that provides real-time information and updates so everyone can be notified of problems threatening these vital areas. Wetland Watch isn’t just for scientists or policymakers—it’s for you.
What it does
Wetland Watch utilizes regularly updating satellite data to provide up-to-date information on vegetation health and water quality for wetlands in the triangle. We also provide information on various fish species that tend to breed in certain seasons in the water bodies near or in many wetlands. This helps people stay informed about water pollution issues, eutrophication, environmental stressors for plants, and times of the year to be cautious so as to not disturb breeding sites. It is one of the first available apps to provide the general public with localized environmental updates.
How we built it
We built the backend code using Python. Using Google Earth Engine satellite data from the past 3 years, we calculated monthly averages for vegetation health. Infrared bands B8 and B4 help measure healthy vegetation and growth. It is calculated using the NDVI (Normalized Difference Vegetation Index). Similarly, bands B3 and B8 provide information on water turbidity and chlorophyll (to identify eutrophication). This was calculated with NDWI (Normalized Difference Vegetation Index). We built the frontend using HTML and CSS. HTML was used for the layout of the app while CSS was used for the styling. As we developed the app, we made sure to integrate accessibility into the code itself.
Challenges we ran into
It was our first time using satellite imagery, especially with Google Earth Engine. We had to figure out how to import the data, and ensure the code itself was sourcing the most recent possible data. We also had to find information on how to calculate and identify water and vegetation information from the imagery. It took a bit of trial and error and bug-fixing to have it working smoothly. Another bump in the road was integrating the front-end HTML code with the back-end Python code. However, with help from our mentor and some research, it worked out.
Accomplishments that we're proud of
We were really proud of how our app turned out. We found the interactive map and the setup to be very refined and polished. It was also really cool being able to learn so many skills in a short period of time, so we're proud of all the work and time we were able to put into the app. We also love our mascot, the marbled salamander, Shaniqua.
What we learned
We learned how to integrate satellite data, combine python and html code, and how to create a folium map.
What's next for Wetland Watch
We want to expand our app to a wider range, outside of the triangle, even outside of NC. Our end goal is to help everyone stay updated on the environment that supports them all and is a vital part of nature's ecosystems. We can also add systems to notify officials of when there are severe threats to wetlands, as well as public input to engage the community and provide more specific updates.


Log in or sign up for Devpost to join the conversation.