-
-
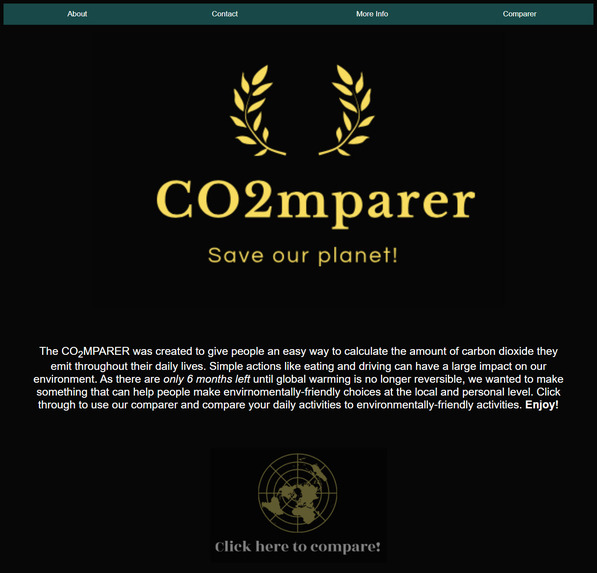
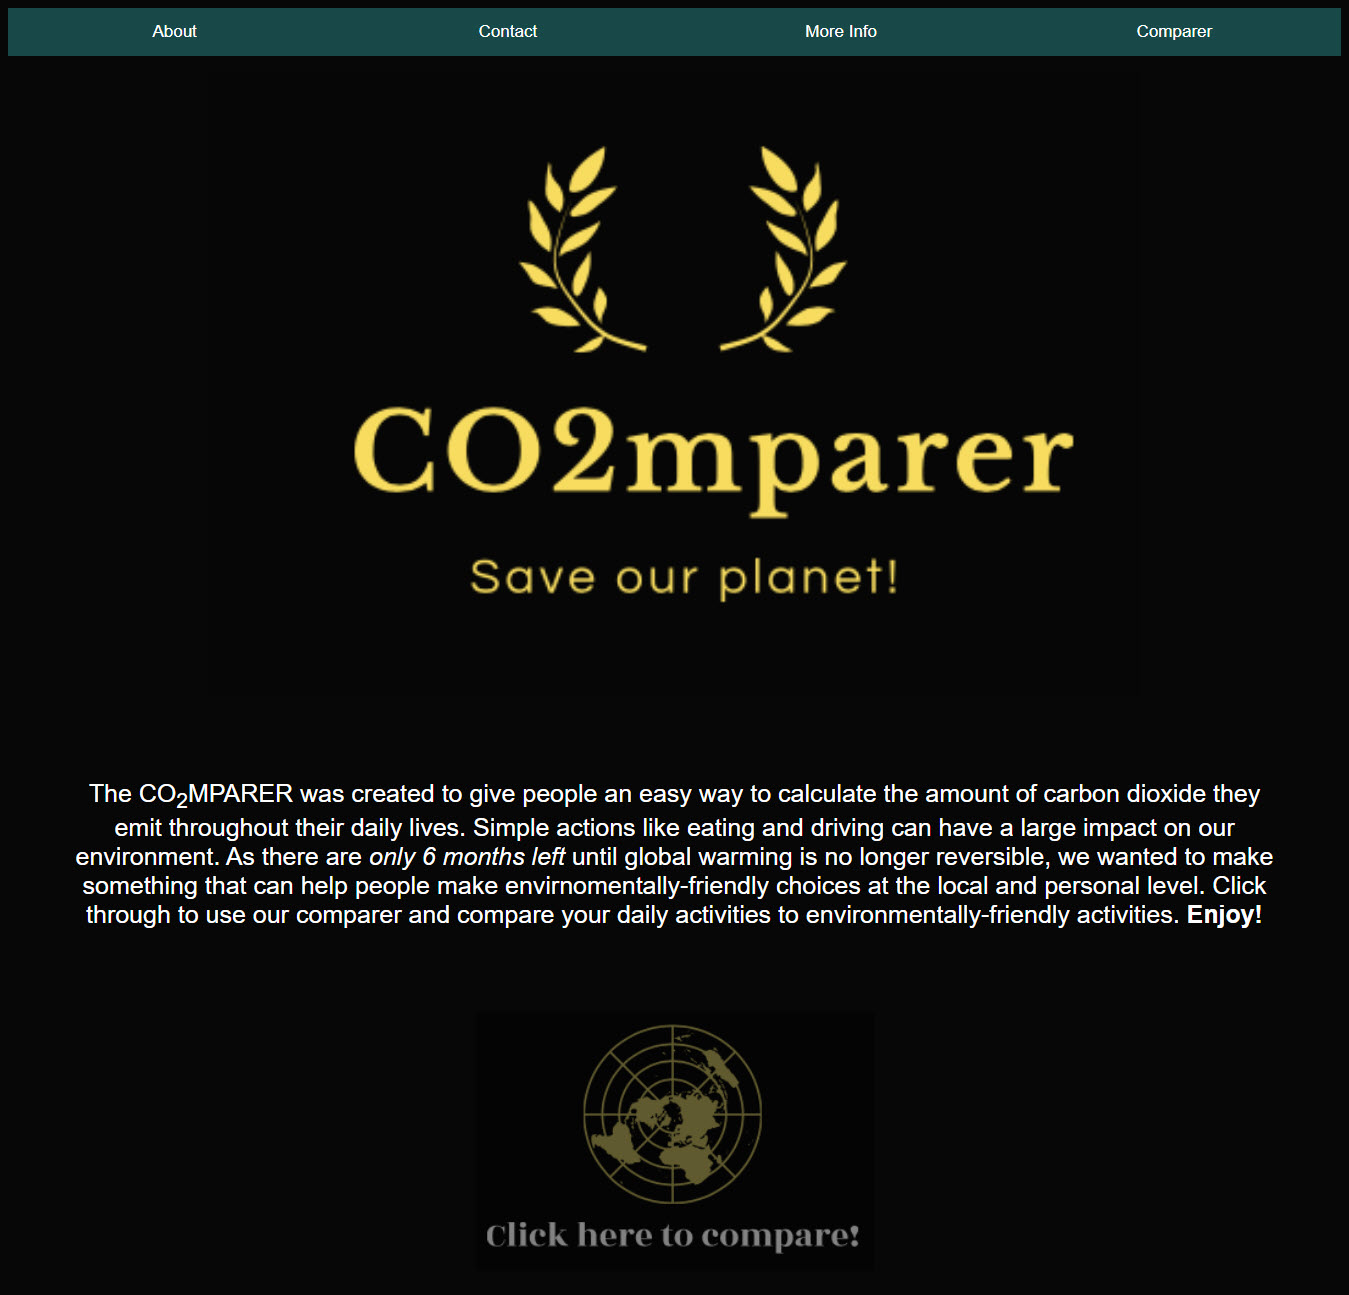
Our homepage
-
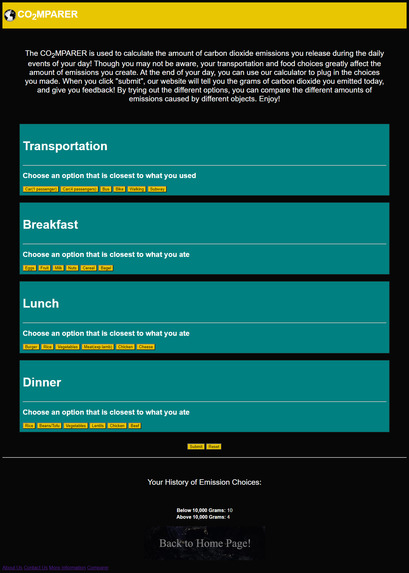
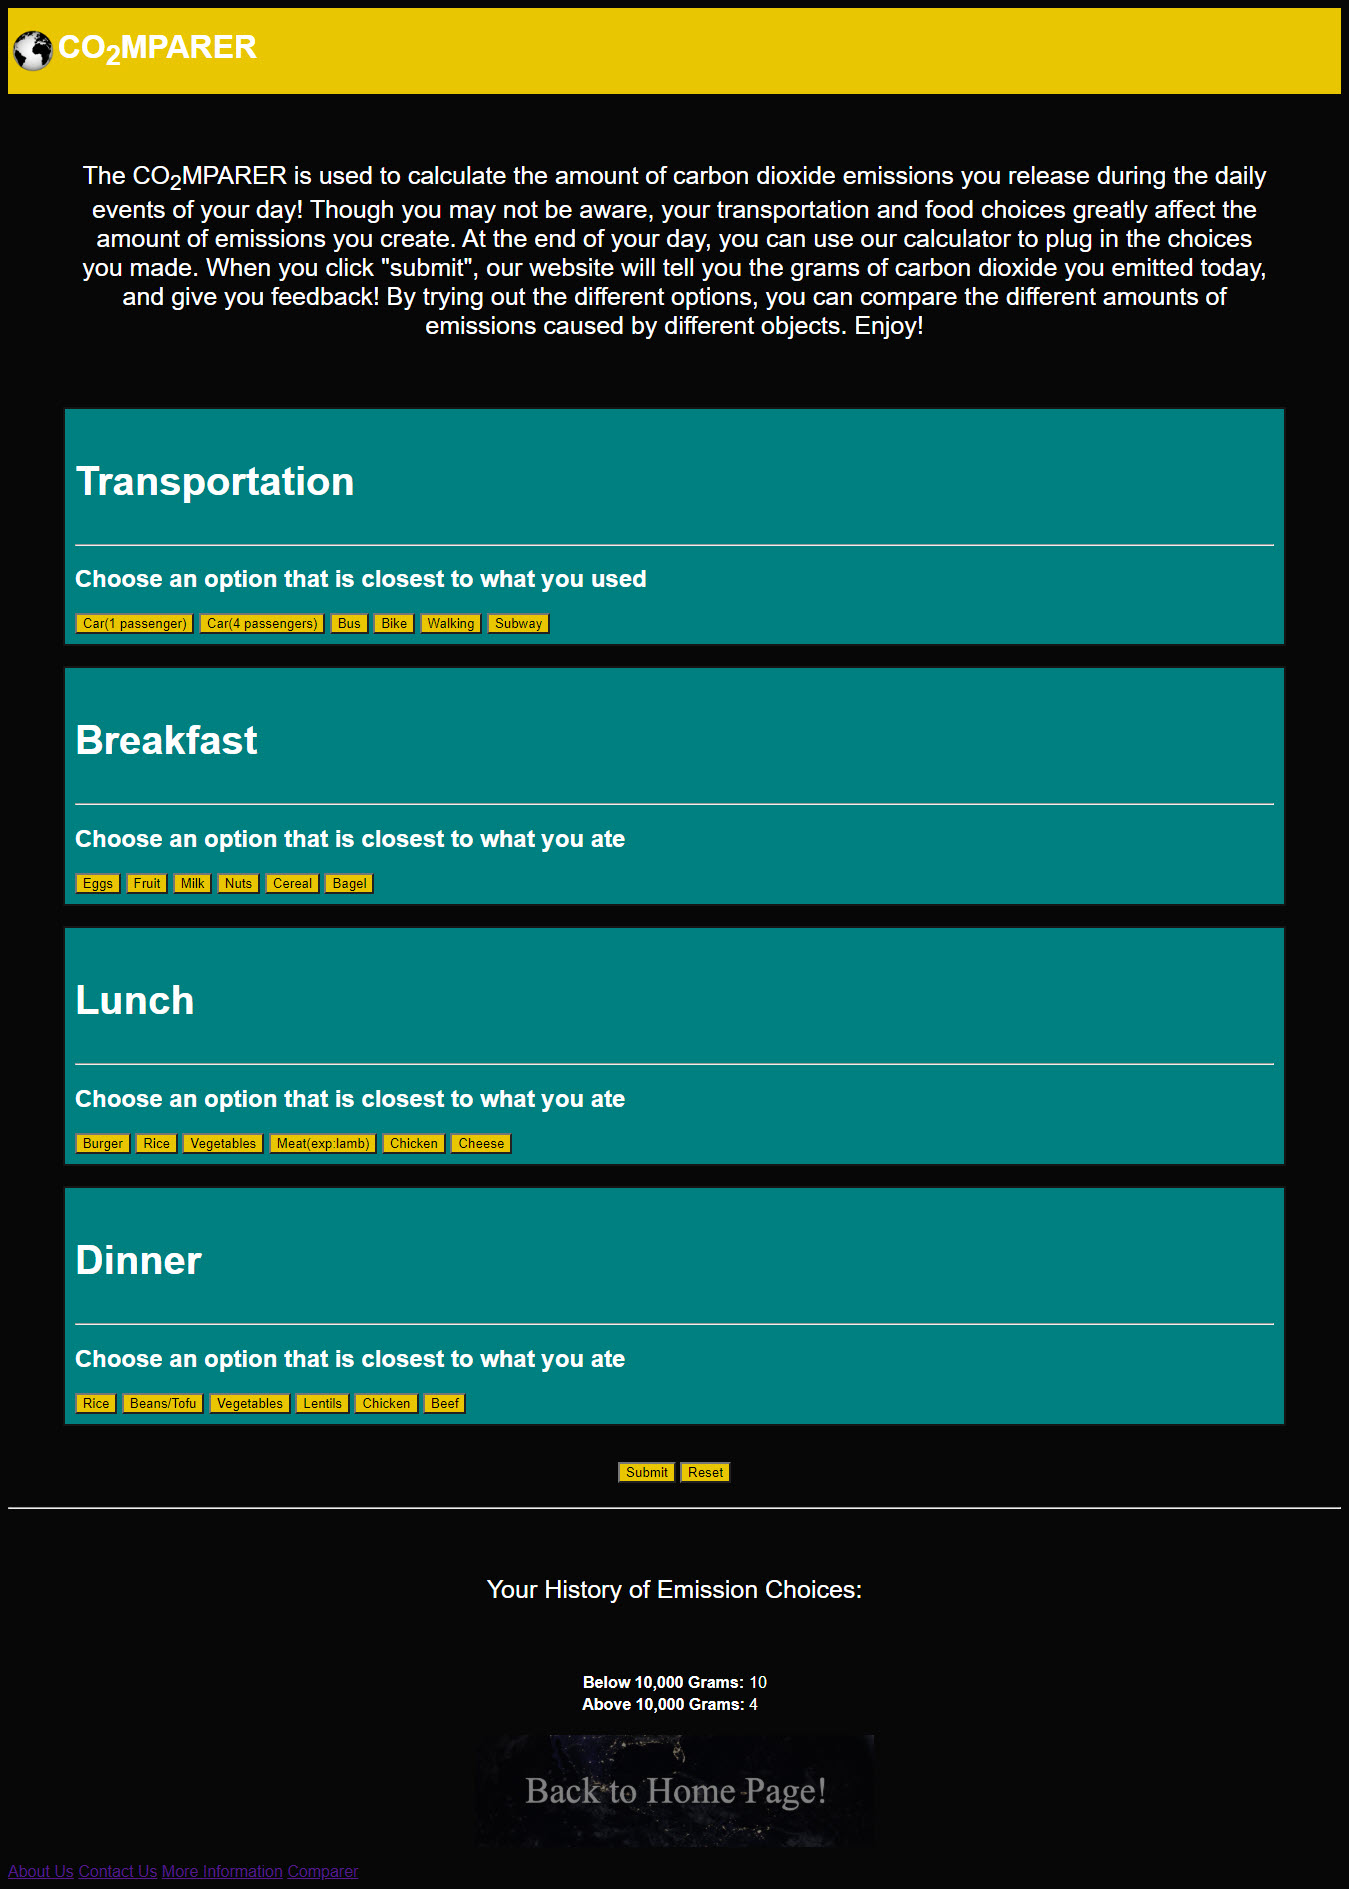
Our Comparer page
-
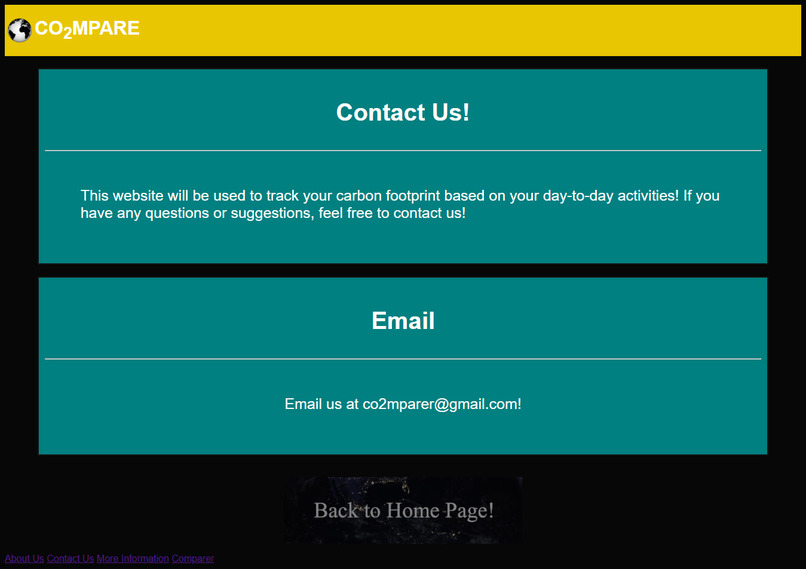
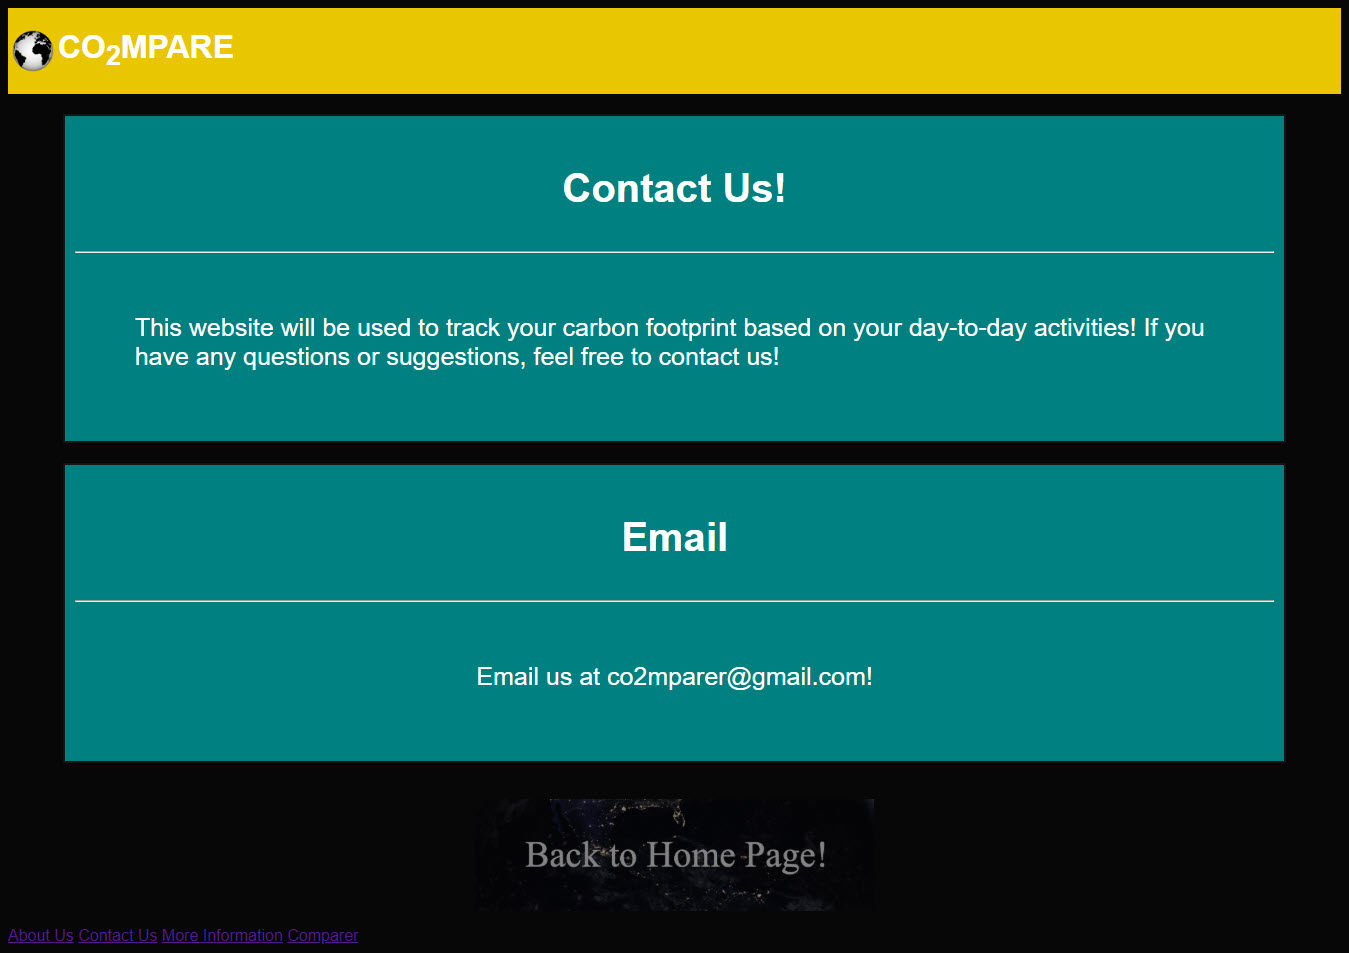
Our Contact Us page
-
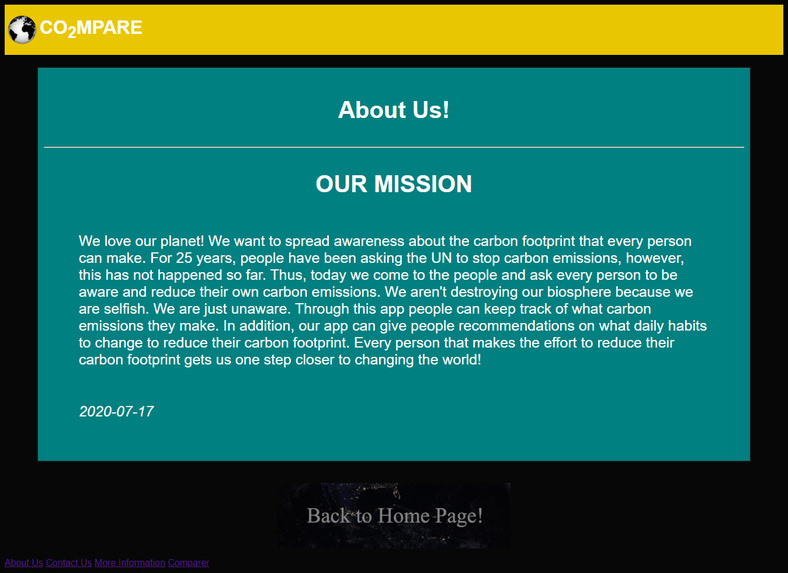
Our About Us page
-
Our More Information page
Inspiration
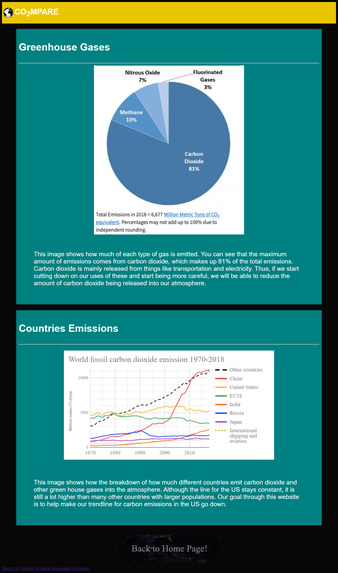
Carbon dioxide is currently contributing to processes such as global warming, which greatly influences people all over the world. Since we only have a short time before our negative impacts to the environment become irreversible, we decided to focus our website on bringing attention to this important issue! We took inspiration from online carbon dioxide emission calculators, and took the idea one step further. We wanted to make a tracker that recorded how much carbon dioxide emissions you contributed to, so you can compare your environmentally-friendly days to your more-carbon dioxide days.
What it does
We were able to use Repl.it to collaborate and create an HTML program for our website. On our website, we created different buttons that took us to different pages such as the About page or the Contact Us page. We also successfully made our Comparer page in which a person can submit what type of transportation they used and what type of food they ate in a day. This Comparer sums the total amount of carbon dioxide in grams a person releases into the atmosphere in a day. By looking at this number, people can see whether or not their habits are good for our environment. Finally, at the bottom of the Comparer page, we have a cumulative frequency table that keeps track of an individual’s emission record. It shows a person how many days they released below 10,000 grams of carbon dioxide and how many days they released above this amount. This, again, will help people realize how big their carbon footprints can be.
How we built it
To start our project, we first referenced an open source template and used Repl.it, which is where we all coded together. We worked on five different HTML files for each of our website pages, used CSS to style the pages, and JavaScript to program our tracker. Although we are proficient in Java, this was our first time coding a full website in HTML, so we learned a lot along the way, especially from online resources.
Challenges we ran into
Throughout this process, we ran into a couple issues such as getting the buttons to work properly and formatting the different pieces. As we were not very familiar with HTML, it took us a while to format all the buttons and improve the website's aesthetics. In addition, we had to learn how to use javascript to write several methods that helped make the buttons in our website function. Finally, in order to create the data table on the "Compare" page, we needed to learn how to use local storage to save the emission counts of the user. Overall, through a lot of reading, trial and error, and helping out each other, we were able to put together a program that does what we wanted it to.
Accomplishments that we're proud of
This was our first website that any of us ever created. We are proud that we were able to create a functional and useful website with many features that could impact many people. We are most proud of the front-end aesthetically-pleasing website features and our back-end programming that can sum and store your emission data.
What we learned
We learned about the thought process that is behind building a website and the determination required to build a hackathon project. In addition, before starting this hackathon, none of us knew how to write in html. Thus, throughout this project we learnt a lot of things about html through online tutorials and websites. For example, we learnt how to enable/disable buttons and we learnt how to sum up all the values inputted by our buttons. Another thing we learnt that was new was how to make a cumulative frequency table so that a user can keep track of their past results.
What's next for CO2mparer
We plan to create more features for our website like adding a global tracking feature that each individual's history is added to and present the data in a more concise way with a live graph. We would like to expand on the options users can select like the carbon footprint from clothing they buy and possibly create an app so it becomes more accessible.


Log in or sign up for Devpost to join the conversation.