Inspiration
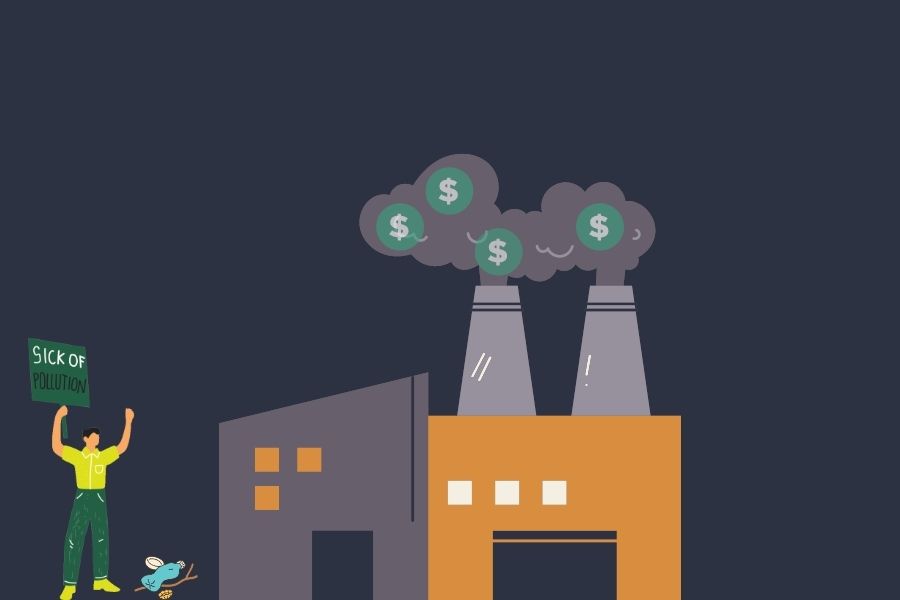
With the last few years the economy has been through its ups and down with COVID and the recent talks of a recession. We thought it would be interesting to see the outcomes of the carbon emissions over the next few years, as there are talks about negative GDP quarters.
What it does
We were able to see the corellations with CO2 emissions and GDP per capita over time.
How we built it
We used Google collab and Matplotlib. For our sources, we used Statistics Canada and Our World in Data. We used three datasets to gather our data. We started by merging 2 data sets to create a graph that shows the co2 emissions per capita over time in years. We also used a dataset that gave us the GDP over time in years as well.
Challenges we ran into
The main challenge we faced is comingup with a solution. Since GDP is heavily related to a country's economy, it also plays a role with a country overall, as the economy is tied with everything. So, it was hard to find a solution that countries could apply without harming their economy.
Accomplishments that we're proud of
Getting out of our comforts zone and learning something new. We're proud that we stayed late to work on this project even if it isn't the best.
What we learned
We learned how to analyze data with programming software to come to conclusions in attempts to solve the issues that our world faces.
What's next for Relationship Between GDP and Emissions of Green House Gases
Finding a way to lower Green House Gases while lowering the Emission of Green House Gases.
Built With
- ourworldindata
- python
- statscanada

Log in or sign up for Devpost to join the conversation.