Inspiration
Every year, utilities in Georgia and South Carolina file billions of dollars of future grid construction — and plan it blind to what their neighbors are building next door. FERC's Order No. 1920 (2024) exists precisely because this isolation produces duplicated corridors and delays. We found the proof in the filings themselves: Dominion Energy South Carolina's own PSC docket notes its Jasper substation sits three miles from Georgia Power's Plant McIntosh, with parallel rebuilds filed in the same windows. SERTP and SCRTP coordination forums exist, but nobody had a public, map-first answer to a simple question: where do our filed plans physically and temporally collide? We built it.
What it does
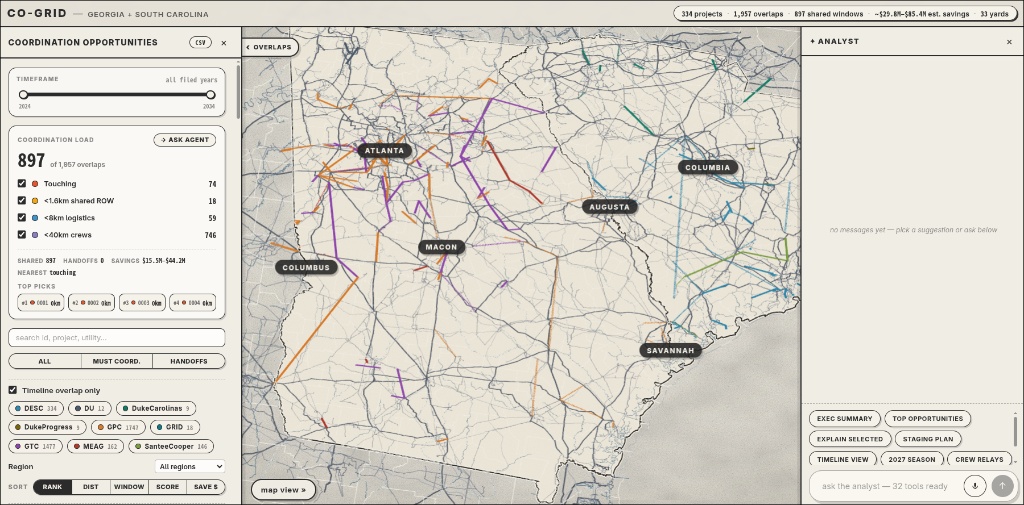
CO-GRID ingests 334 real, publicly-filed construction projects from 9 utilities — Georgia Power, Dominion Energy SC, Santee Cooper, GTC, MEAG, Duke Carolinas, Duke Progress, Dalton Utilities, and Gainesville (GRID) — covering all of Georgia and South Carolina.
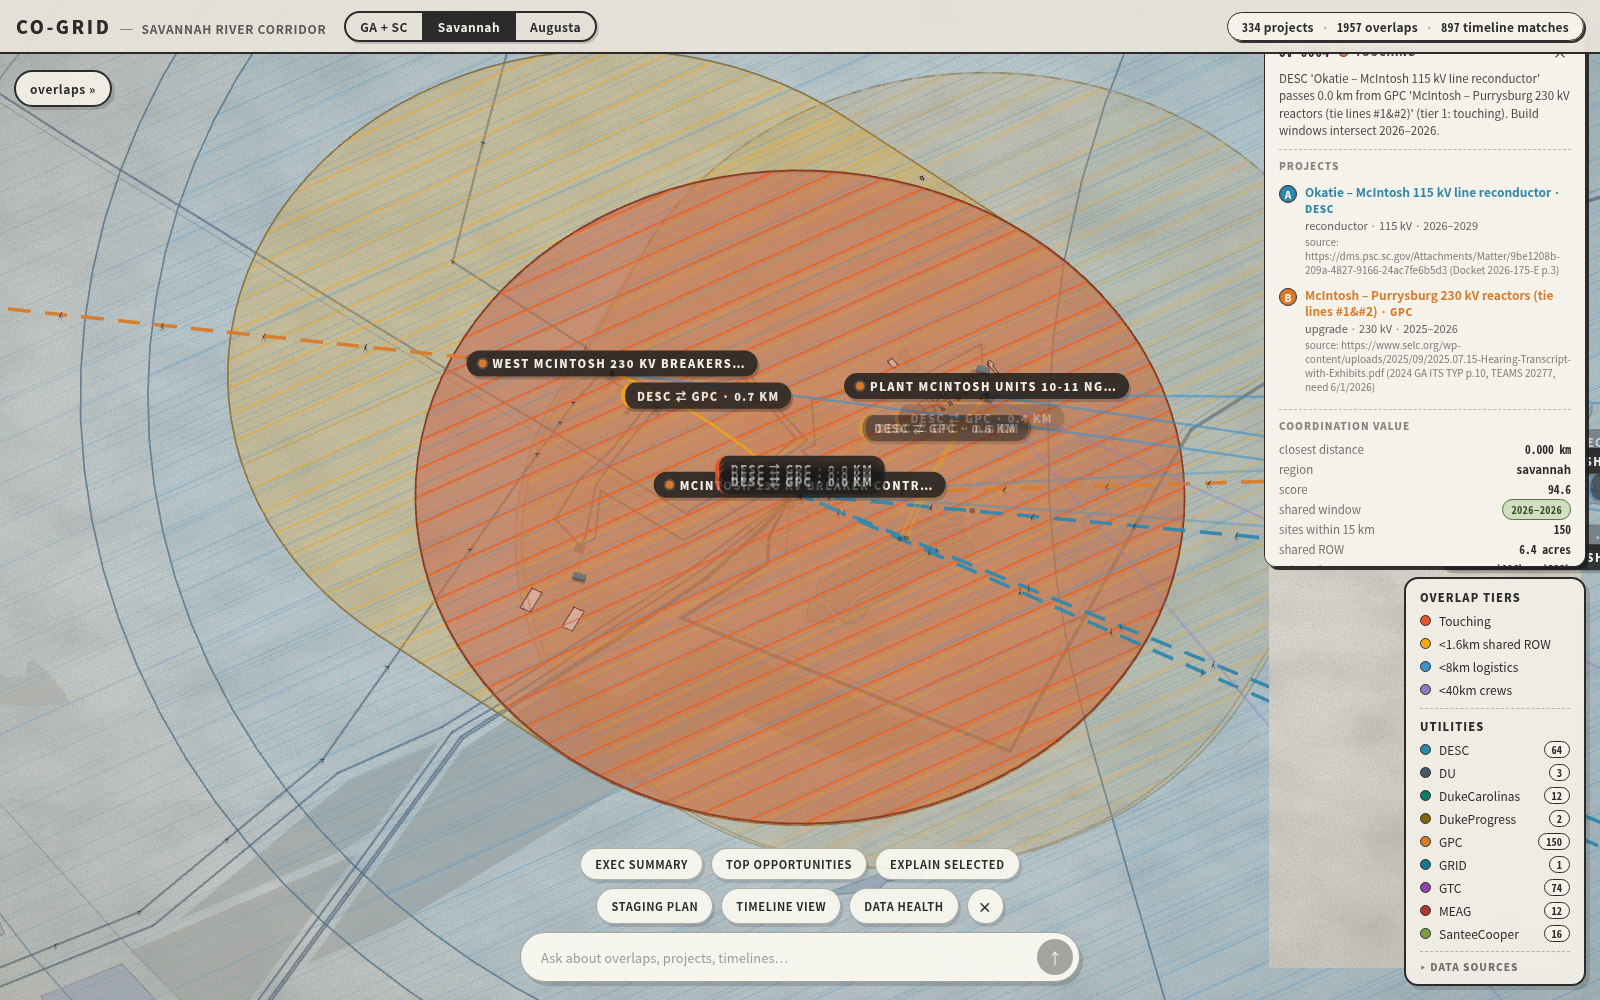
A spatial engine computes closest-point distances (never centroids — a 60 km line can pass 5 km from a neighbor's substation) inside a 40 km crew-driving radius, intersects filed build windows, and ranks 1,957 cross-utility overlaps into the challenge's four tiers: touching / <1.6 km shared right-of-way / <8 km logistics / <40 km crews. Timeline overlap is a mandatory secondary signal — adjacent (end-to-start) windows are honestly labeled as crew handoffs, not shared seasons.
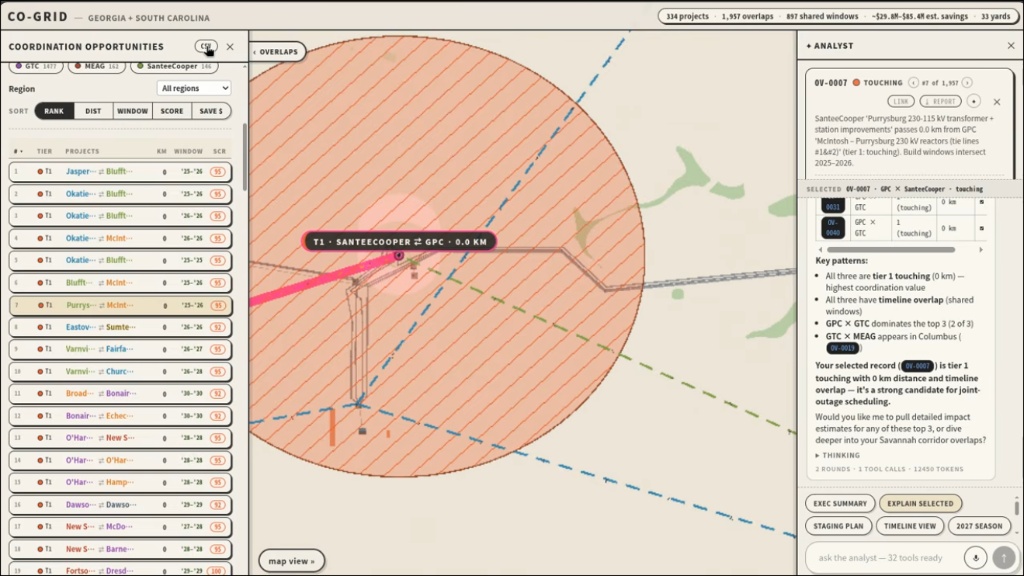
Everything renders on a monochrome "pencil-sketch" 3D statewide map (15.7k real HIFLD features); a right-side analyst rail runs a 32-tool LLM agent that queries the real dataset and drives the map — flying the camera, selecting overlaps, filtering utilities — with voice dictation in the composer. Ranked results export as CSV, Excel, or printable HTML reports. Every record cites its public filing. Zero-result states are shown honestly, never padded.
How we built it
Pipeline (Python): ingestion scripts pull HIFLD grid layers (ArcGIS FeatureServer), OSM
city/state geometry (Overpass), and Census boundaries — no API keys. Utility IRPs, SCRTP/SERTP
expansion plans, and PSC docket attachments were mined into a 334-row seed where every record
carries its filing URL. Projects are reprojected to a region-fit Lambert Conformal Conic
(chosen over UTM-17N to kill scale error at Georgia's western edge), pre-filtered through a
Shapely STRtree dwithin index, then exact closest-point distances, tier classification,
window math, a 0–100 score, and a shared cost model (land $8–25k/acre + $150–400k/km avoided
corridor establishment, quantified only for tiers 1–2) produce a deterministic overlaps.json.
Backend: FastAPI serves the artifacts plus a deterministic analysis API (staging-yard clusters, outage-conflict lists, season calendars, savings rollups) and the SSE-streamed tool-calling agent over an OpenAI-compatible model.
Frontend: React 19 + TypeScript + Vite, Three.js via react-three-fiber (demand-mode rendering, instanced geometry), zustand state, Web Speech API dictation.
Challenges we ran into
Data heterogeneity. Project truth lives in PDFs, meeting decks, and PSC dockets — many projects are filed without routes. We built a 9,710-facility gazetteer to anchor endpoint-only geometry at real substations rather than fabricating paths.
Geometry cost. Naive pairwise distance is O(N²); the STRtree 40 km prefilter plus a single correct projection kept exact closest-point math fast at statewide scale.
Render cost. 15.7k basemap features and 1,957 zones forced frameloop="demand", merged
geometry, a 200-zone render cap, and gzip (~27 MB → ~5 MB).
Correctness edges. A falsy-zero sort bug nearly buried our best records — 0.0 km "touching" overlaps sorted last until explicit None checks fixed it.
Accomplishments we're proud of
The data is the achievement: 334 projects, each cited to a real public filing, across nine utilities and two states — producing 1,957 ranked coordination records including 839 same-kV equipment matches. The engine surfaced the real Savannah River corridor: tier-1 touching DESC × GPC overlaps inside a shared build window, exactly where the filings predicted. Quantified across the tier-1 and tier-2 coordination set, the shared-corridor model puts roughly $30M–$85M of duplicated corridor establishment on the table — for example, OV-0001 (DESC × Santee Cooper, touching) alone models $0.8M–$2.2M on a 2.9 km shared right-of-way. The agent doesn't just answer questions — it flies the camera, exports spreadsheets, and never invents a row. And the pipeline is honest by construction: deterministic artifacts, 87 tests, and zero fabricated scenarios anywhere.
What we learned
Closest-point distance changes everything — center points would miss most real overlaps. Most filed projects honestly don't overlap; the value is the ranked few, which made honest zero-result UX a feature, not a gap. Timeline semantics needed three honest states (intersect / adjacent handoff / none) — "near in time" isn't a shared window. On the agent side, small models need bounded tool loops, validated arguments, and error-as-data returns to stay truthful.
What's next for CO-GRID
Automate filing ingestion as new IRPs and SERTP expansion plans publish; extend coverage beyond GA+SC to the wider SERTP footprint; grow the staging-cluster and playbook modules into crew-level scheduling and outage-season optimization; and alert on new filings that create fresh overlaps. The schema and pipeline are utility-agnostic — new regions are config, not code.
Built with
React, TypeScript, Vite, Three.js, react-three-fiber, @react-three/drei, zustand, Python, FastAPI, uvicorn, Shapely, geopandas, pyproj, pandas, numpy, pydantic, openpyxl, pytest, Web Speech API, OpenAI-compatible LLM function-calling (SSE streaming), HIFLD, OpenStreetMap / Overpass API, US Census TIGER boundaries, SCRTP / SERTP / GA & SC PSC public filings.
Try it out
# backend — Python 3.14+, no API keys needed for any data source
uv venv venv --python 3.14            # or: python -m venv venv
uv pip install --python venv/bin/python -r requirements.txt

# pull the public GIS data (HIFLD + OpenStreetMap + borders)
./venv/bin/python -m src.ingestion.hifld_download
./venv/bin/python -m src.ingestion.osm_download
./venv/bin/python -m src.ingestion.osm_pois
./venv/bin/python -m src.ingestion.osm_power
./venv/bin/python -m src.ingestion.osm_places
./venv/bin/python -m src.ingestion.osm_borders
./venv/bin/python -m src.ingestion.osm_roads_rivers

# the 334 filed projects are committed as a curated seed —
# the full ranked overlap set regenerates from public data alone
./scripts/pipeline.sh                                     # raw -> processed -> overlaps.json
./venv/bin/uvicorn src.api.main:app --host 127.0.0.1 --port 8000

# frontend — Node 22+
cd src/ui && npm install && npm run dev
# open http://127.0.0.1:3210
Optional analyst rail: add AGENT_API_KEY + AGENT_BASE_URL + AGENT_MODEL (any
OpenAI-compatible endpoint) to a .env. Without a key, the rail degrades gracefully to
deterministic, model-free briefs — the map and all rankings work regardless.
Tests + full verification gate: ./venv/bin/python -m pytest tests/ -x -q or ./scripts/verify.sh.
Source filings were hand-downloaded per data/raw/SOURCES.md (no stable public API); every
file's URL, publisher, and fetch date is documented. Nothing behind a CEII NDA was used.
Built With
- fastapi
- geospatial
- gis
- python
- react
- shapely
- three.js
- typescript
- web-speech-api

Log in or sign up for Devpost to join the conversation.