-
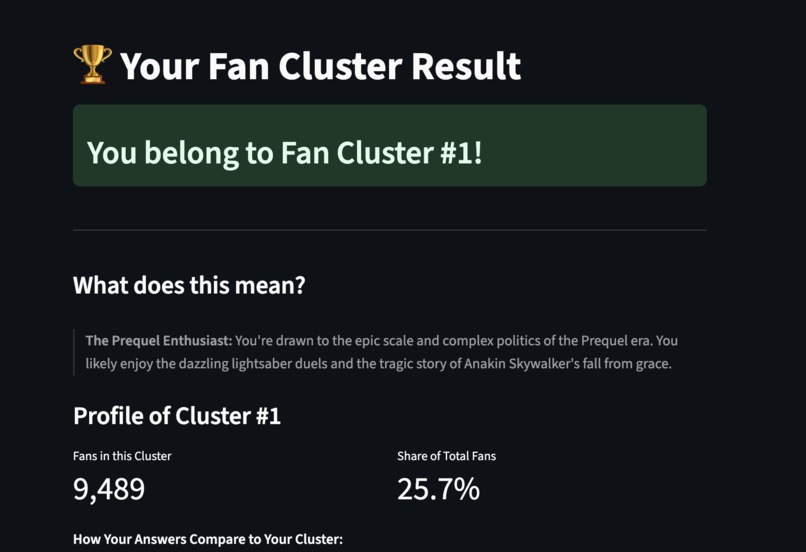
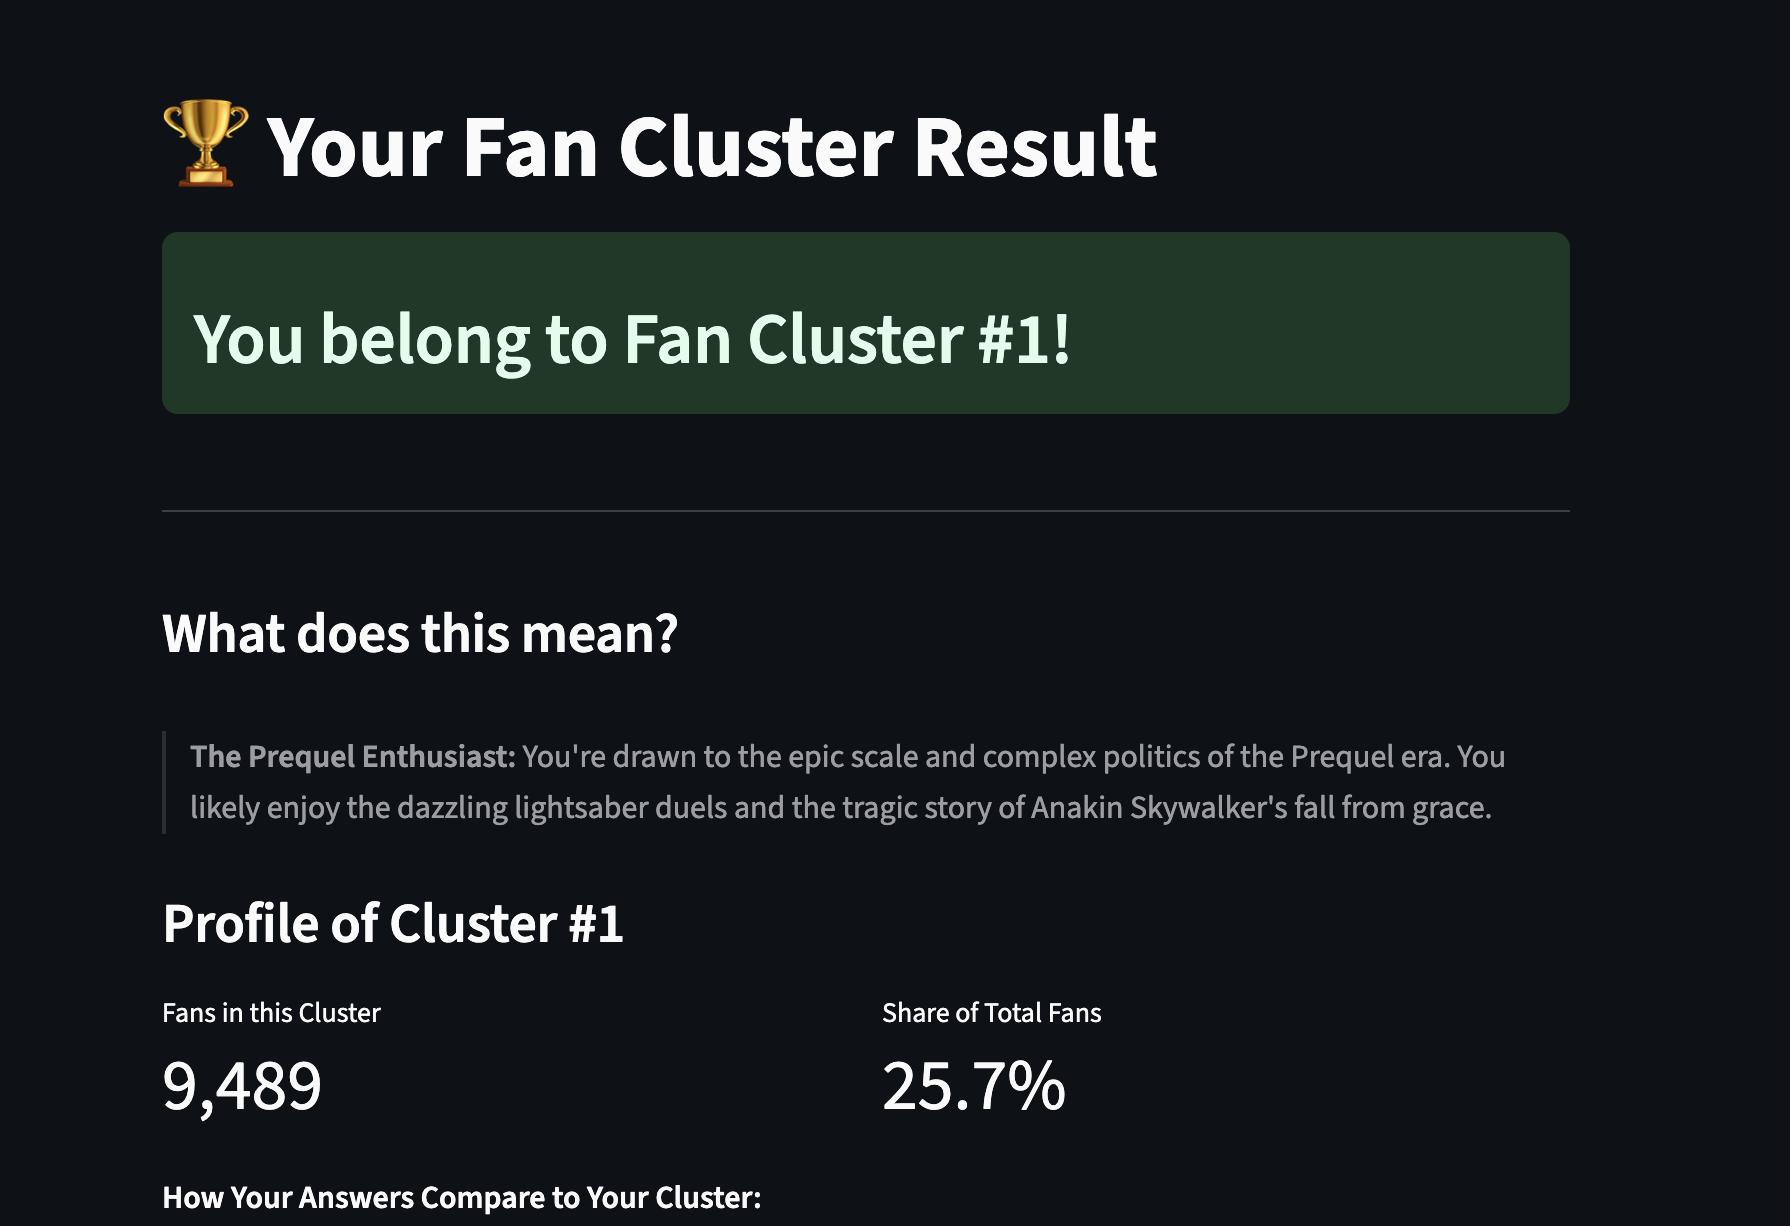
Get sorted into your Star Wars fan cluster now!
Inspiration
We wanted something more interesting than “yet another dashboard.” Since the dataset is synthetic and global clustering was weak (Hopkins ≈ 0.992), we reframed the task: show how the fandom connects. Instead of forcing blobs in 2-D, we map which things are loved together and let judges explore segments of fans.
What it does
- An interactive co-occurrence network of Star Wars items (heroes, films, planets, ships, soundtracks).
- Edges mean two items are liked together in the same review; thickness = Jaccard similarity.
- A cluster selector filters the network to just one of our 9 K-Means segments, so you see each segment’s own “mini-galaxy.”
- Live controls (min frequency / min co-mentions / min Jaccard / item types) + a search/neighbor explorer.
- A small cohesion stat (avg Jaccard among a cluster’s top items) to justify the clustering.
How we built it
For two items A and B, Jaccard = #(reviews with A & B) / #(reviews with A or B) It asks: of all reviews that mention either, what fraction mention both? That normalizes popularity, so Luke doesn’t auto-pair with everything just because he’s common.
It asks: of all reviews that mention either, what fraction mention both? That normalizes popularity, so Luke doesn’t auto-pair with everything just because he’s common.
Challenges we ran into
- Data prep (≈36k rows): parse all fav_* columns; normalize oddities (the dataset spells hero as heroe).
- Counts: per-item frequency and item–item co-mentions per row.
- Edge weights: compute Jaccard for each pair; threshold by support + Jaccard.
- Graph: render with pyvis/vis.js (force-directed layout), color by type, size by log-frequency.
- Clustering: One-Hot encode favorites → K-Means (k=9). Save kmeans_model.joblib, encoder.joblib, top_features.joblib.
- Cluster-aware view: assign each row a cluster at runtime, then rebuild the co-occurrence network only from that subset.
- Validation: show avg within-cluster Jaccard for the cluster’s top items vs global as a sanity check.
Accomplishments that we're proud of
- A segment-aware network that’s fast and clean to use.
- A tiny, honest metric (avg Jaccard) that backs up the qualitative picture.
- A polished Streamlit UX that a judge can understand in seconds.
What we learned
- When global structure is weak, pairwise structure (graphs) still sings.
- “Explainability beats raw accuracy” in short demos—Jaccard + networks are judge-friendly.
What's next for Cluster and Co-occurence Analysis of Star Wars Dataset
- Community detection (Louvain) to auto-label network themes.
- A recommender: given a user’s likes, show the next high-Jaccard neighbors.
- Session logging to see how interactions shift clusters over time.
Built With
- github
- joblib
- matplotlib
- numpy
- pandas
- python
- pyvis/vis.js
- scikit-learn
- streamlit

Log in or sign up for Devpost to join the conversation.