Inspiration
Modern applications depend on servers and cloud infrastructure, but monitoring these environments can quickly become difficult. Engineers need to continuously understand CPU usage, memory utilization, disk usage, network activity, uptime, and server availability across different machines.
This challenge inspired us to build CloudWatchX, a centralized infrastructure monitoring platform that brings these metrics together into a single dashboard.
For ForgeHacks, we explored how an AI layer could make this monitoring experience more intelligent by helping engineers interpret infrastructure behavior rather than simply displaying raw metrics.
What We Built
CloudWatchX AI combines infrastructure monitoring with intelligent incident analysis.
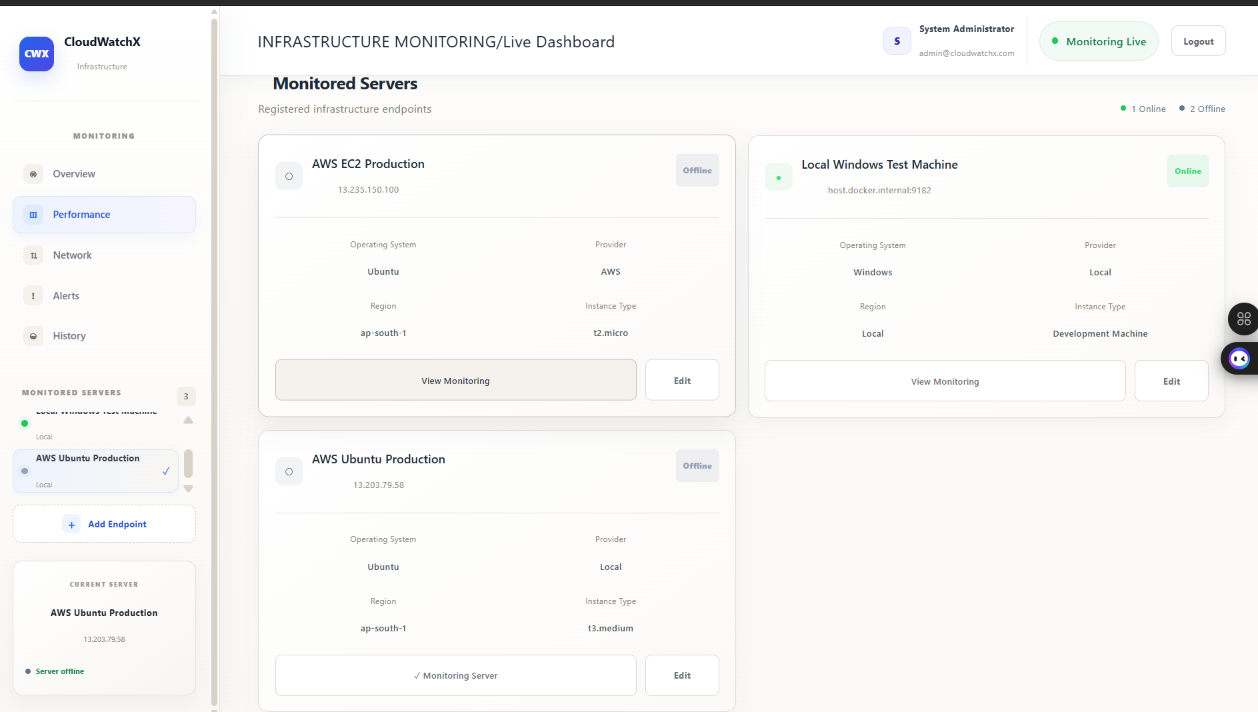
The monitoring platform collects infrastructure metrics using Prometheus, Windows Exporter, and Node Exporter. A Node.js and Express backend provides APIs for endpoint management, monitoring metrics, alerts, monitoring history, and authentication. A React-based frontend presents the information through a centralized dashboard, while MongoDB Atlas stores application and monitoring data.
The system supports monitoring different infrastructure endpoints and provides information such as:
- CPU utilization
- Memory utilization
- Disk utilization
- Network activity
- Server uptime
- Server availability
- Alerts
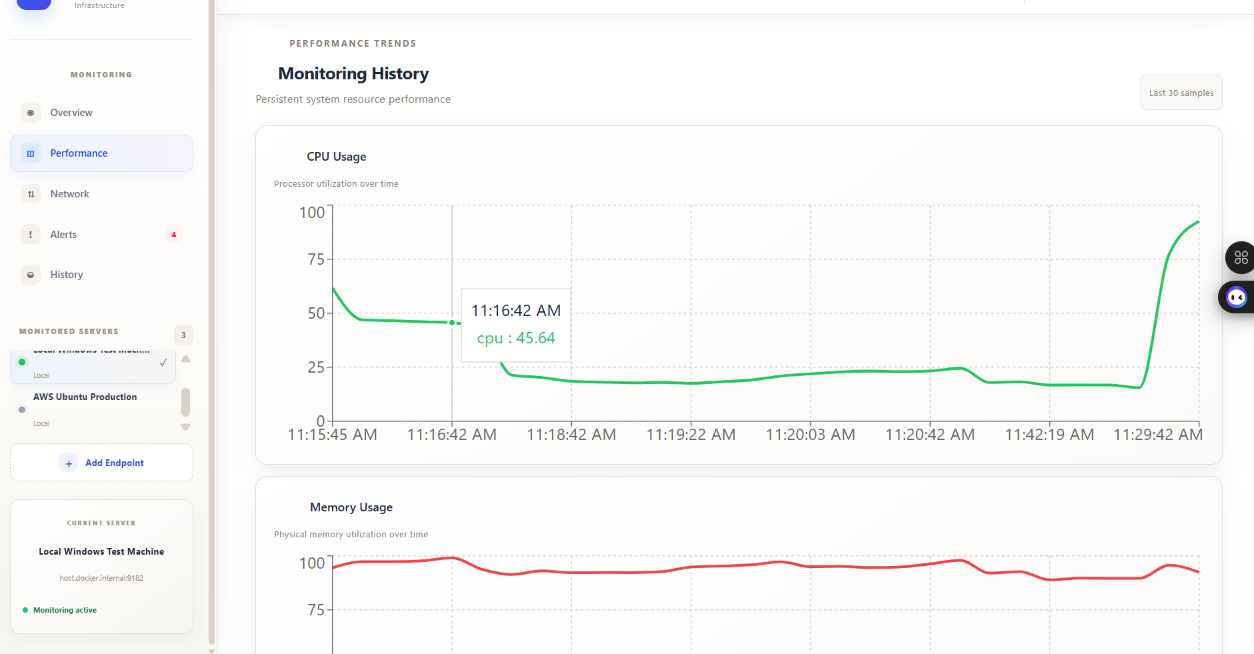
- Historical monitoring data
For the hackathon prototype, the AI component is designed to analyze monitoring information and help convert infrastructure signals into understandable incident insights.
How We Built It
The system was developed incrementally.
We started with endpoint management and authentication, then integrated Prometheus for infrastructure metrics. We added Windows and Linux monitoring using exporters and developed APIs for retrieving CPU, memory, disk, network, uptime, and availability information.
We then implemented persistent monitoring history and alert management. Dynamic Prometheus target registration was added so that monitoring endpoints could be registered through the CloudWatchX interface instead of manually modifying Prometheus targets.
The frontend was developed using React and Vite, while the backend uses Node.js and Express. MongoDB Atlas is used for persistent application data.
For the AI extension, monitoring metrics, alerts, and historical information provide the data required for intelligent anomaly and incident analysis.
Challenges We Faced
One of the biggest challenges was integrating different infrastructure environments into a single monitoring workflow.
We had to troubleshoot Prometheus connectivity, exporter configuration, Kubernetes and Minikube networking, dynamic target registration, and AWS server connectivity.
We also encountered an issue where a Windows monitoring endpoint was being registered as:
host.docker.internal:9182:9182
instead of:
host.docker.internal:9182
This caused the dynamically registered target to fail. We corrected the target registration logic and verified that Prometheus could successfully scrape the Windows exporter.
Another challenge was maintaining a reliable local development environment involving Docker, Minikube, Prometheus, the Node.js backend, React frontend, and MongoDB Atlas. We created PowerShell startup and shutdown scripts to simplify the development workflow.
What We Learned
Through this project, we gained practical experience with:
- Infrastructure monitoring
- Prometheus and exporters
- Kubernetes and Minikube
- Dynamic service discovery
- Node.js backend development
- React dashboard development
- MongoDB Atlas
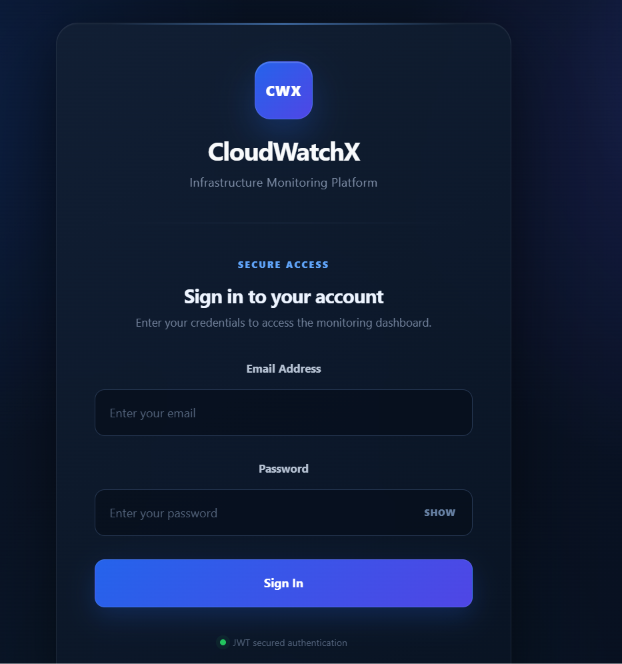
- JWT authentication
- REST APIs
- Monitoring alerts and historical data
- Cloud and network troubleshooting
We also learned that collecting infrastructure metrics is only the first step. Turning those metrics into useful, understandable insights is where intelligent analysis can provide additional value.
Real-World Impact
CloudWatchX AI is designed for DevOps engineers, cloud engineers, system administrators, and organizations managing multiple infrastructure endpoints.
Instead of requiring engineers to manually inspect multiple monitoring signals during an incident, the platform aims to provide a centralized view of infrastructure health and intelligent assistance for understanding abnormal behavior.
Our goal is to make infrastructure monitoring more understandable, actionable, and useful for teams responsible for keeping business applications reliable.
Future Scope
The project can be extended with more advanced anomaly detection, AI-powered root-cause analysis, natural-language incident summaries, predictive infrastructure alerts, and automated recommendations.
The long-term goal is to evolve from a monitoring dashboard into an intelligent infrastructure operations assistant.
Built With
- ai
- api
- atlas
- docker
- express.js
- infrastructure
- javascript
- jwt
- kubernetes
- minikube
- mongodb
- node.js
- prometheus
- react
- rest
- vite

Log in or sign up for Devpost to join the conversation.