About CloudWatchX
Inspiration
Modern applications often run across multiple servers and cloud environments, making infrastructure monitoring increasingly important. Developers and administrators need to know whether their servers are available, how much CPU and memory they are consuming, whether disk and network usage are increasing, and whether any infrastructure requires immediate attention.
We wanted to build a centralized monitoring platform that brings these important infrastructure insights into a single dashboard instead of requiring users to check different monitoring tools or server environments separately.
This idea led us to build CloudWatchX, a cloud infrastructure monitoring dashboard focused on server health, real-time performance metrics, alerts, and historical monitoring data.
What We Built
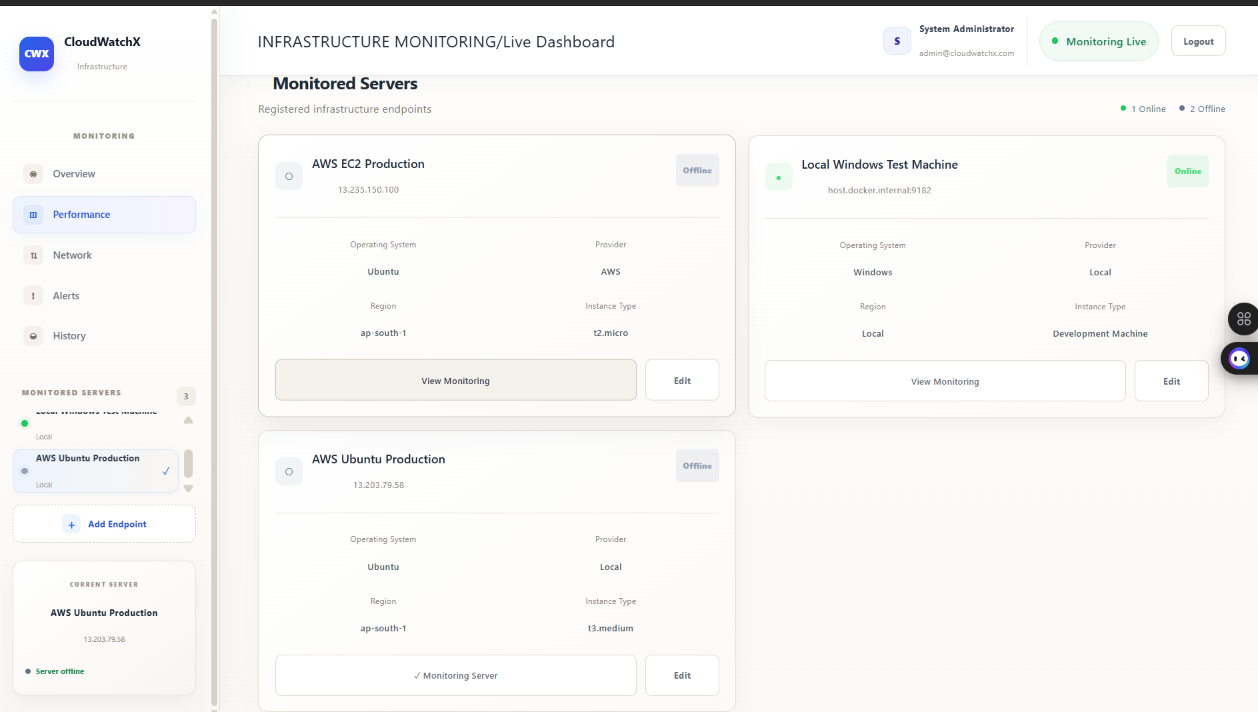
CloudWatchX provides a centralized dashboard for managing and monitoring infrastructure endpoints.
The platform supports:
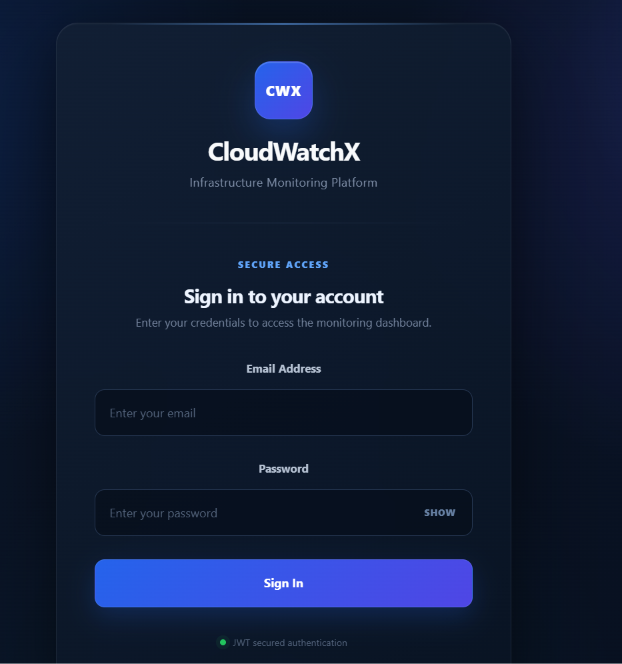
- Secure user authentication using JWT
- Endpoint registration and management
- Server availability monitoring
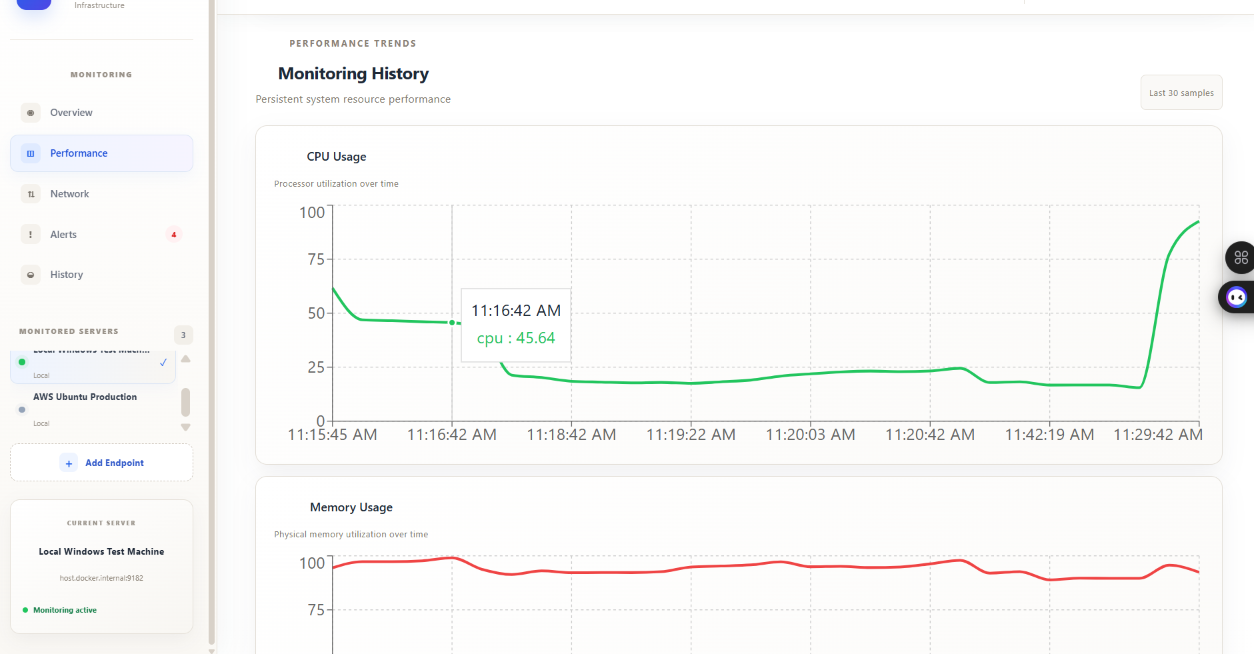
- Real-time CPU, memory, disk, and network metrics
- Server uptime monitoring
- Automatic Online/Offline status detection
- Threshold-based infrastructure alerts
- Persistent monitoring history
- Historical performance visualization
- Prometheus-based metrics collection
- Windows and Linux server monitoring
- Dynamic Prometheus target registration
- A React-based monitoring dashboard
The overall workflow is:
User Login → JWT Authentication → Endpoint Management → Server Selection → Prometheus → Exporter Metrics → Health Analysis → Alerts & Monitoring History → Dashboard
How We Built It
The frontend was developed using React.js, providing an interactive dashboard for endpoint management and infrastructure monitoring.
The backend was developed using Node.js and Express.js. REST APIs handle authentication, endpoint management, monitoring metrics, alerts, and monitoring history.
We used MongoDB Atlas with Mongoose for persistent storage. Endpoint information, users, alerts, and monitoring history are stored in the database.
For infrastructure monitoring, we integrated Prometheus with exporters. Windows servers are monitored using Windows Exporter, while Linux servers use Prometheus Node Exporter.
One of the important implementation challenges was making endpoint registration dynamic. Instead of manually modifying the Prometheus configuration whenever a new server is added, CloudWatchX updates a Kubernetes ConfigMap containing the Prometheus target information. Prometheus uses file-based service discovery to automatically detect these targets.
This allows the workflow to become:
Add Endpoint → Update Target Configuration → Prometheus Discovers Target → Collect Metrics → Display in CloudWatchX
What We Learned
During development, we gained practical experience with:
- React.js frontend development
- Node.js and Express REST APIs
- MongoDB and Mongoose
- JWT authentication
- Prometheus and exporters
- Kubernetes and Minikube
- Dynamic service discovery
- Docker-based environments
- Linux server monitoring
- Windows server monitoring
- Infrastructure troubleshooting
- Monitoring data visualization
- Alert generation and resolution
More importantly, we learned how individual infrastructure components need to work together to create a complete monitoring workflow.
Challenges We Faced
One of our major challenges was connecting dynamically registered endpoints to Prometheus.
Initially, adding an endpoint only updated the database. Prometheus did not automatically know about the new server. We solved this by integrating the backend with the Kubernetes API and maintaining a dynamic targets.json configuration through a Kubernetes ConfigMap.
Another challenge was supporting different operating systems. Windows and Linux expose different Prometheus metrics, so the monitoring logic had to use appropriate queries depending on the operating system.
We also worked through connectivity issues involving exporters, Kubernetes networking, AWS security groups, server availability, and Prometheus target health. These issues helped us understand that monitoring is not only about collecting metrics, but also about validating the complete network and infrastructure path between the monitoring system and the monitored server.
Outcome
CloudWatchX resulted in a centralized monitoring dashboard capable of managing infrastructure endpoints and displaying their health and performance information in one place.
The project demonstrates how React, Node.js, MongoDB, Prometheus, exporters, Kubernetes, and cloud infrastructure can be combined to create a practical infrastructure monitoring platform.
Our goal with CloudWatchX is to provide a clear and centralized view of infrastructure health while reducing the complexity of monitoring servers across different environments.

Log in or sign up for Devpost to join the conversation.