Inspiration
Construction companies aren't building sites anymore — they're running cloud fleets. HILTI's Nuron connected-tool telemetry, ON!Track asset tracking, BIM render farms, and PROFIS structural compute generate continuous cloud workloads that are managed across three disconnected tools: one for cost, one for security, one for carbon. None of them understand construction workloads, and none of them talk to each other.
Meanwhile, two forces are colliding. HILTI has committed to net-zero by 2050, with near-term targets validated by SBTi. And European regulators began strictly enforcing CSRD and NIS2 in 2026 — pushing carbon and supply-chain cybersecurity compliance requirements down through value chains to every B2B supplier.
The insight that started everything: the worst cloud resources are bad in multiple ways at once. An oversized public IoT-ingest VM isn't just expensive — it's exposed and carbon-heavy. Three crises, one cloud team, one engine.
What It Does
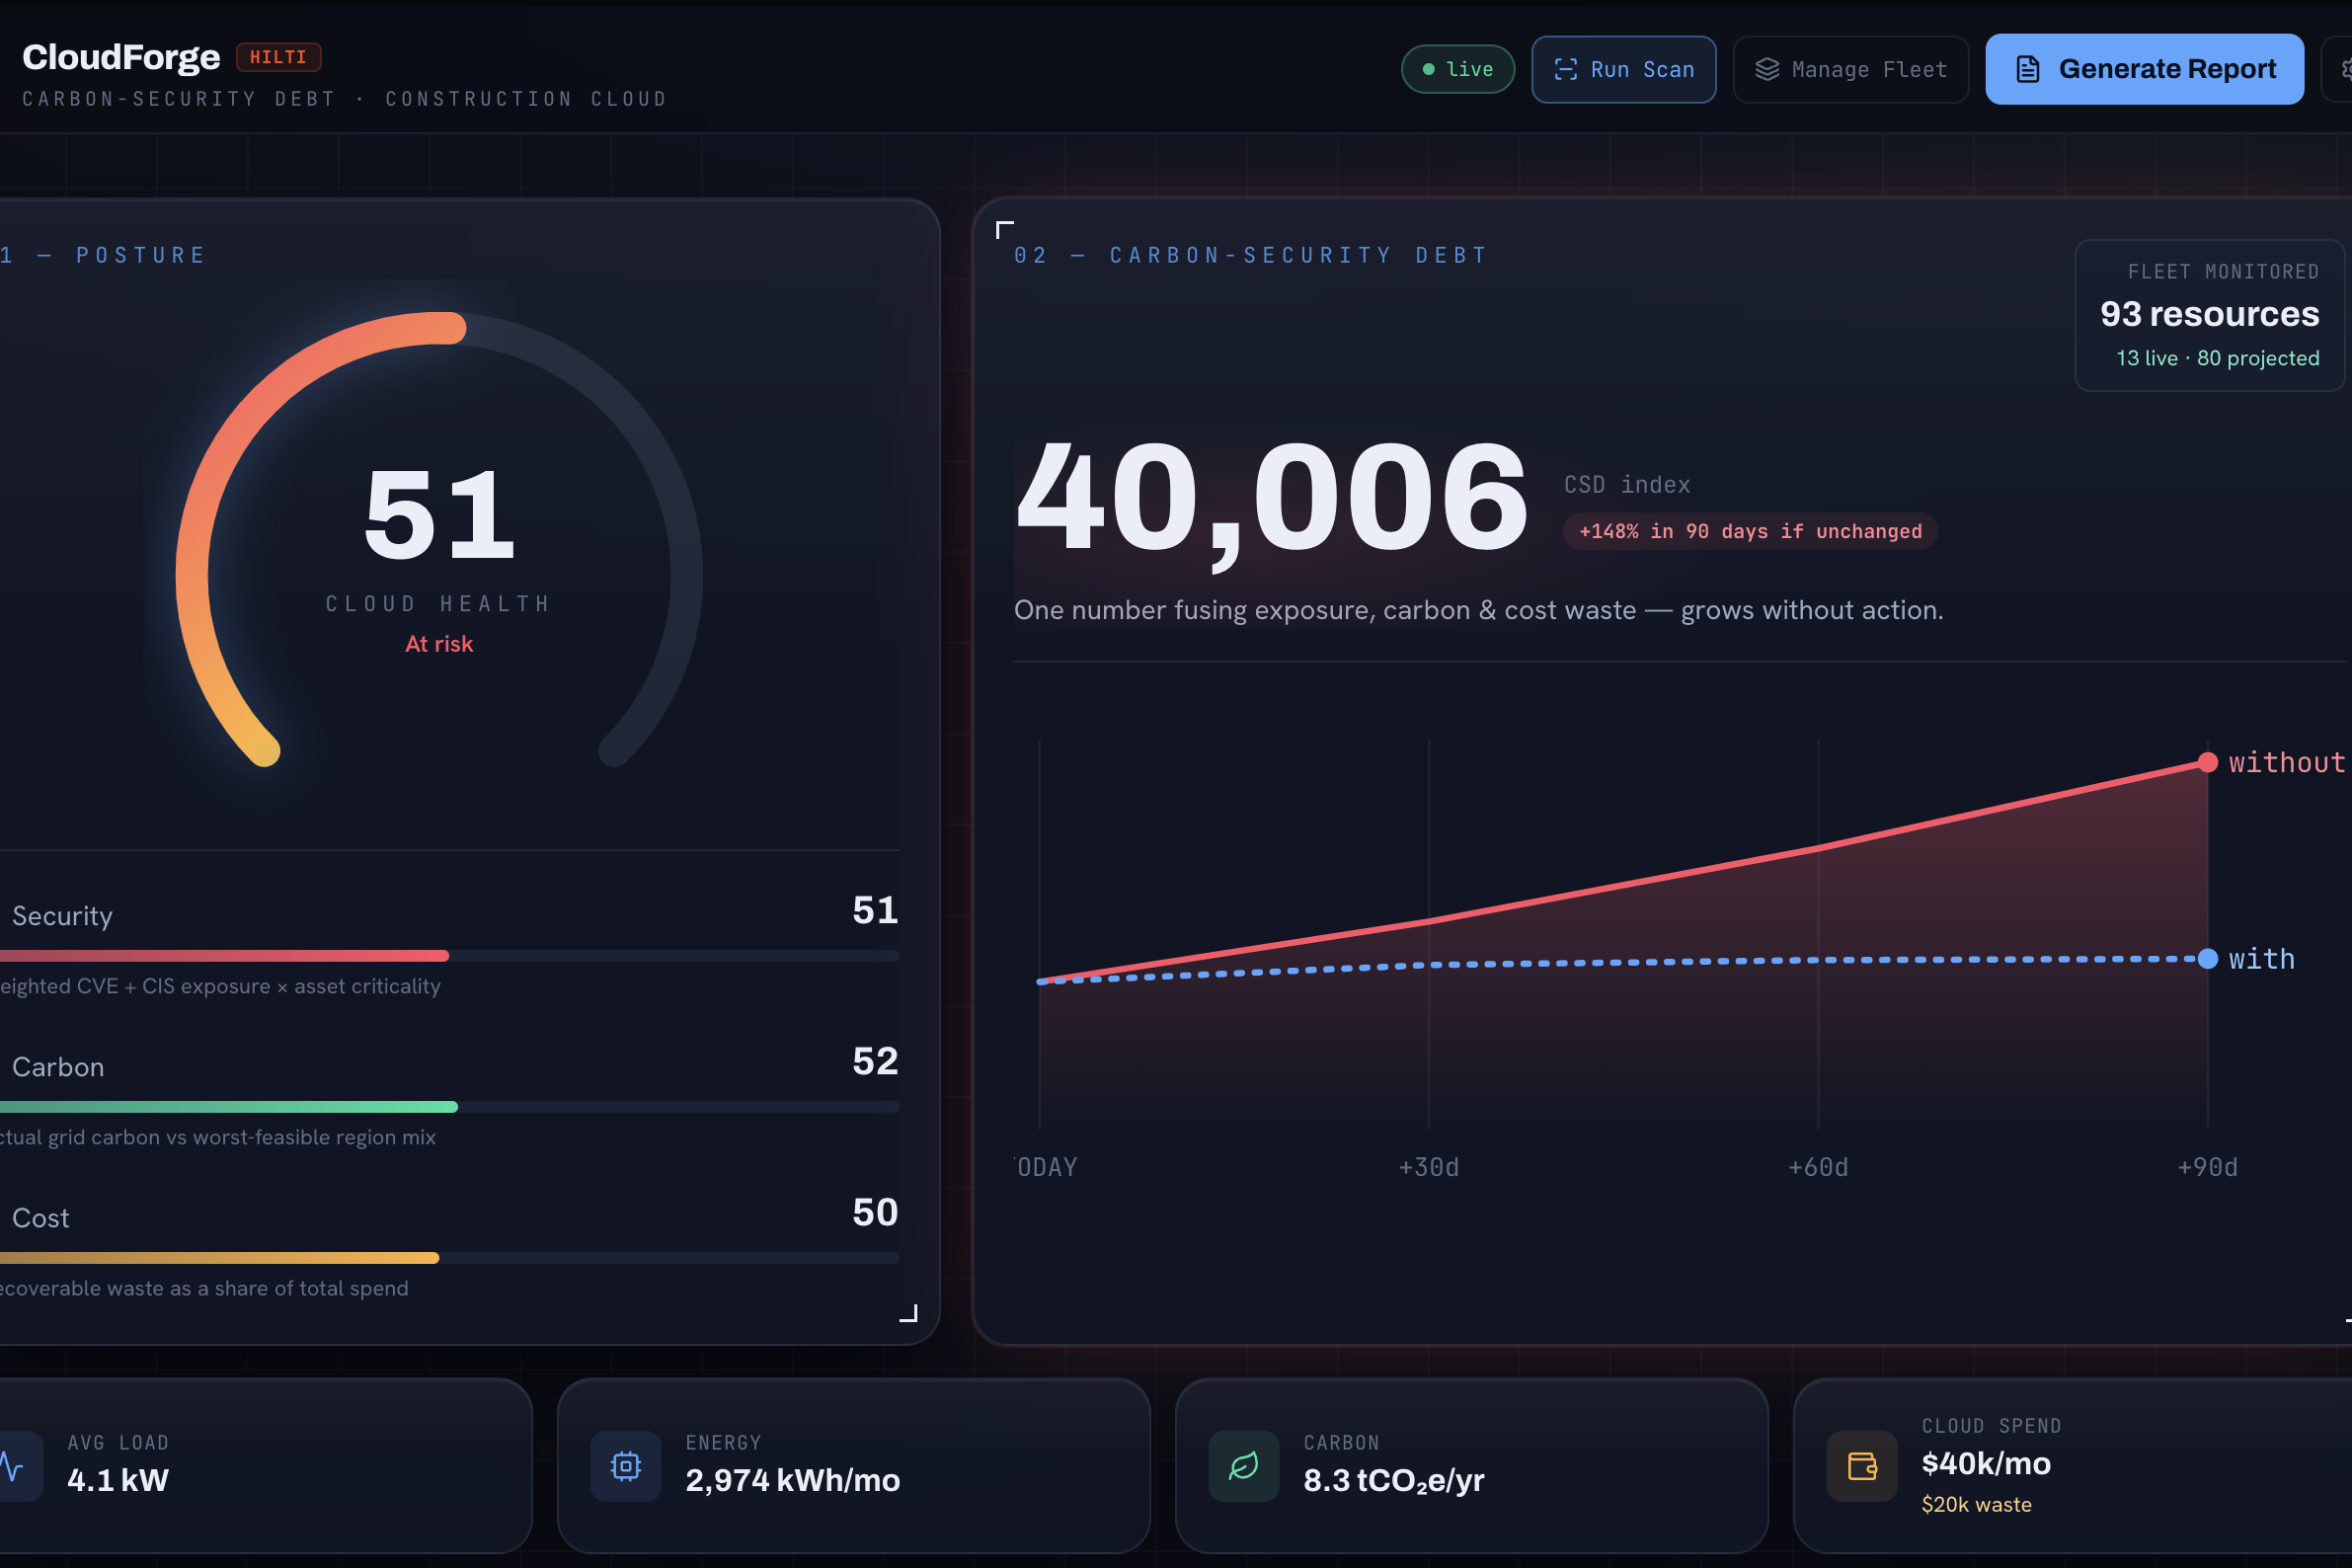
CloudForge fuses security risk, carbon footprint, and cost waste into a single compounding index: the Carbon-Security Debt (CSD).
$$ \text{CSD} = \underbrace{\Sigma(\text{CVSS-weight} \times \text{exposureDays})}{\text{security}} \times 1.0 ;+; \underbrace{\frac{$\text{wasted}}{\text{mo}}}_{\text{cost}} \times 0.045 ;+; \underbrace{\frac{\text{CO}2\text{kg}}{\text{mo}}}{\text{carbon}} \times 0.5 $$
From that single number, everything flows:
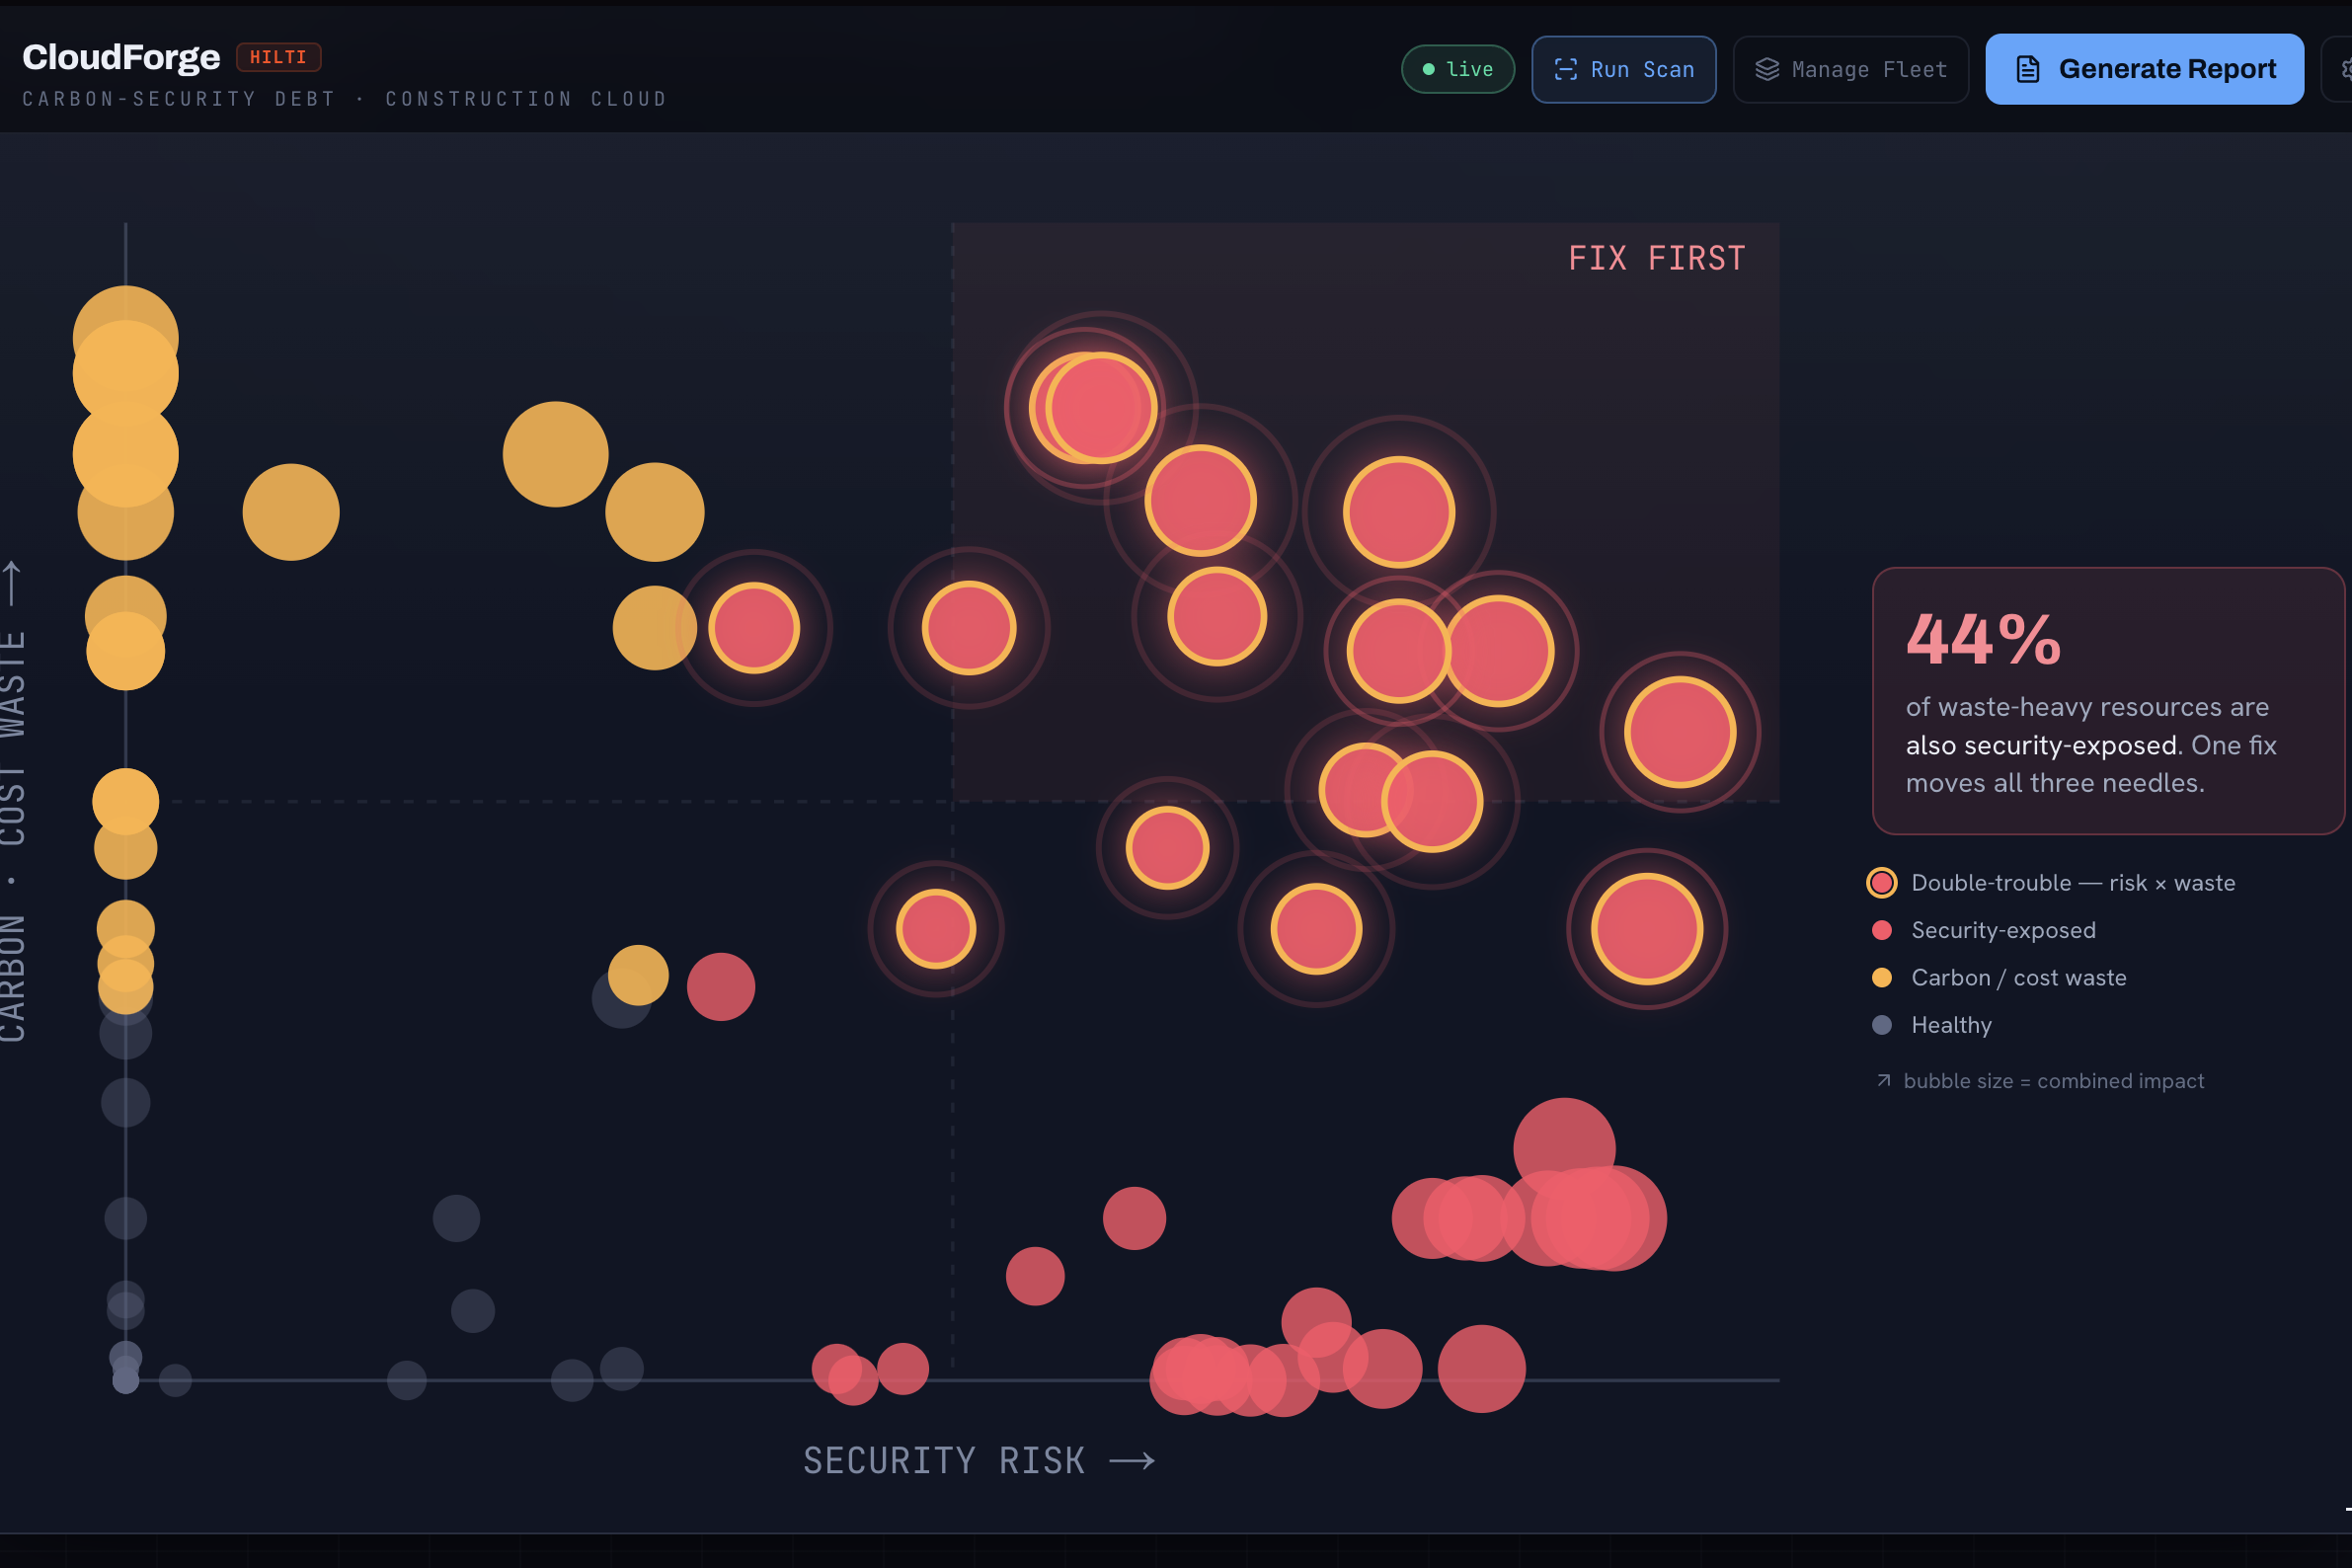
Cloud Health gauge — a composite score weighted 40% security / 30% carbon / 30% cost (Gartner TBM triad), with sub-scores and a 90-day CSD forecast showing the divergence between "fix nothing" and "approve CloudForge's fixes." Double-Trouble map — a scatter of every resource on security risk × carbon/cost waste axes. Around 40% of waste-heavy resources are also security-exposed. Those are fixed first. AI Copilot — explains why it's risk and waste, stages a Terraform/CLI/policy artifact, and quantifies the exact delta in $/mo, CO₂kg, and CSD points. Human-approved. CloudForge has no write access to the cloud. Compliance report — board-ready NIS2 + CSRD ESRS E1 + FinOps document, generated live from the same engine, print-to-PDF ready.
How We Built It
Telemetry pipeline — A Docker Compose stack simulates HILTI's production workload mix: six reference services (Nuron IoT ingest, BIM render, PROFIS structural compute, ON!Track asset DB, batch ETL, field-app API) emit real CPU-seconds through cAdvisor → Prometheus → CloudForge. ~80 additional HILTI-scale resources extend the fleet without changing a single engine line.
Energy engine — Cloud Carbon Footprint "Cloud Jewels" coefficients:
$$ \text{avgWatts} = W_\text{min} + u \cdot (W_\text{max} - W_\text{min}), \quad \text{kWh} = \frac{\text{avgWatts} \times \text{vCPU} \times h}{1000} \times \text{PUE} $$
where $W_\text{min} = 0.74,\text{W}$, $W_\text{max} = 3.5,\text{W}$, $\text{PUE} = 1.135$ (AWS). GPU workloads are floored at 50% rated envelope — GPUs idle hot.
Carbon engine — kWh × per-region grid intensity from Electricity Maps (live API with static fallback). Region-shift fixes only trigger when the saving exceeds 15%; below that, migration overhead outweighs the gain.
Security engine — Trivy CVE + Checkov IaC misconfig feeds a saturating score:
$$ \text{securityScore} = 100 \times \frac{K_\text{sec}}{\text{securityLoad} + K_\text{sec}}, \quad K_\text{sec} = 40{,}000 $$
with construction-workload criticality multipliers (IEC 62443-3-3): IoT/Nuron at 1.35×, PROFIS at 1.25×, down to BIM baseline at 1.00×.
90-day forecast — quadratic growth on the "without" path calibrated to EPSS exploit probability doubling every 30 days post-disclosure; remediation half-life τ = 24 days from CISA KEV and NIST SP 800-40:
$$ \text{CSD}_\text{with}(d) = \text{CSD}_0 + \frac{\Delta}{\text{day}} \cdot \tau \cdot \left(1 - e^{-d/\tau}\right) \times 0.55 $$
Frontend — Next.js 15 App Router, TypeScript strict, Tailwind CSS, Framer Motion, hand-built SVG visualisations. Dark glassmorphism with a three-pillar color language: security = red, carbon = emerald, cost = amber.
AI — OpenAI for remediation prose, isolated and swappable. The system prompt forbids inventing numbers; every figure in the fix card comes from the engine.
Challenges We Ran Into
Unifying three incommensurable units. Security risk is dimensionless exposure-time. Carbon is kilograms. Cost is dollars. Collapsing them into one index without losing meaning meant anchoring every weight to a published source: EU ETS carbon shadow price (~€55/tCO₂) for the carbon term, CVSS calibration for the security term. Without that discipline the CSD number is just marketing.
Making every number provable in a 3-minute demo. Judges can't audit your code in real time. The solution was the live spot-check: the dashboard re-derives a resource's kWh straight from raw Prometheus CPU-seconds, independent of the stored estimate, showing the working on screen. The number matches — that's the proof.
Keeping the AI honest. An LLM that confidently invents cost savings is worse than no LLM. The architecture is strict: the engine computes all figures, the prompt receives them as ground truth, and the model is forbidden from producing new numbers. Live OpenAI mode rewrites prose only; the Terraform artifact and impact deltas are never touched.
Scoping the optimizer. There are dozens of possible fix types. Shipping four well-calibrated ones (right-size, idle cleanup, schedule-down, region-shift) with cited sources for every saving estimate was harder — and more defensible — than shipping twenty with made-up numbers.
Accomplishments That We're Proud Of
Every coefficient, weight, and threshold in the engine traces to a published standard: Cloud Jewels, CVSS v3.1, CISA BOD 22-01, NIST SP 800-40 Rev.4, EPSS, EU ETS, IEC 62443-3-3, Electricity Maps, Veracode SOSS 2023. The Double-Trouble map makes a non-obvious insight immediately visible: the overlap between high-waste and high-risk resources is the highest-leverage place to act. That correlation is the core argument of the whole product. A compliance report that's board-ready and generated live — not a static PDF baked in at 2am — from the same engine that drives the dashboard. Zero write access to the cloud. Human approval is architecturally enforced, not a UI checkbox.
What We Learned
Fusing metrics across domains is mostly a calibration problem, not a math problem. The formulas are straightforward; getting the weights to mean something requires finding the right external references and being honest about where the anchoring is uncertain.
We also learned that "demo-proof" and "technically rigorous" aren't opposites — the live spot-check that re-derives kWh from raw CPU-seconds is both the most credible thing on screen and the easiest thing to explain in 30 seconds.
And: scope is a feature. A product that does four fix types correctly, with cited sources for every estimate, is more trustworthy than one that does twenty with vibes.
What's Next for CloudForge
Live cloud connectors — AWS Cost Explorer, Azure Resource Graph, and GCP Asset Inventory to replace the simulated fleet with a real one. Multi-cloud CSD — a single index across mixed estates, normalized per-region and per-provider. Automated CSRD ESRS E1 filing — structured XML output in the XBRL taxonomy required by European regulators, generated directly from the carbon engine. Pull-request integration — CloudForge stages a fix; a GitHub Action runs it against a staging environment and posts the measured CSD delta back before a human merges. Predictive scheduling — carbon-aware workload deferral using live Electricity Maps forecasts, targeting the diurnal low-carbon window for batch jobs.
Built With
- css
- next.js
- openai-api
- tailwand
- typescript

Log in or sign up for Devpost to join the conversation.