-
-
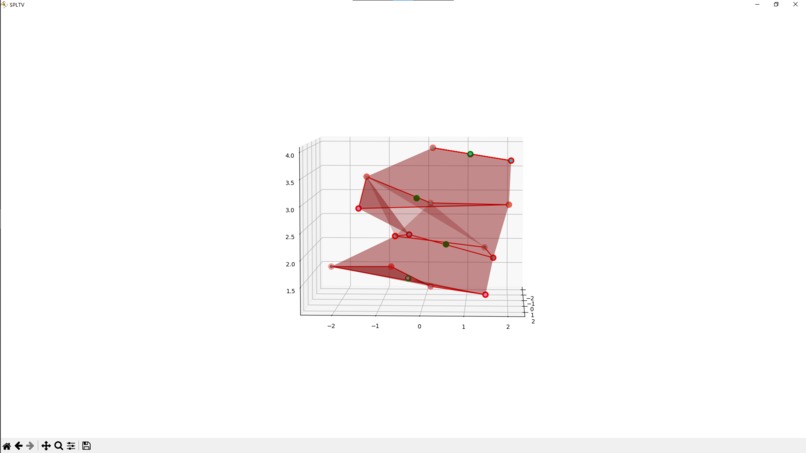
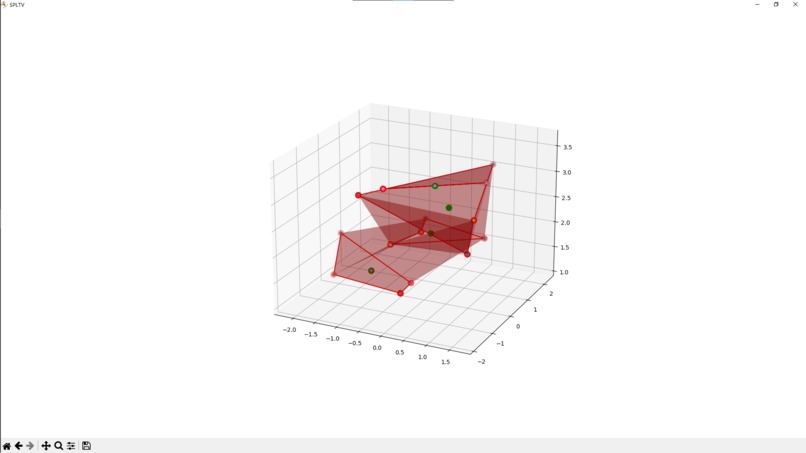
1st try: bad loop connecting.
-

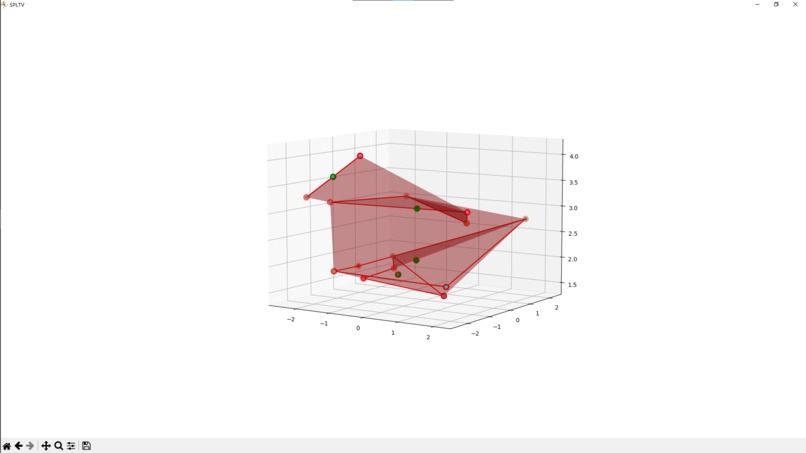
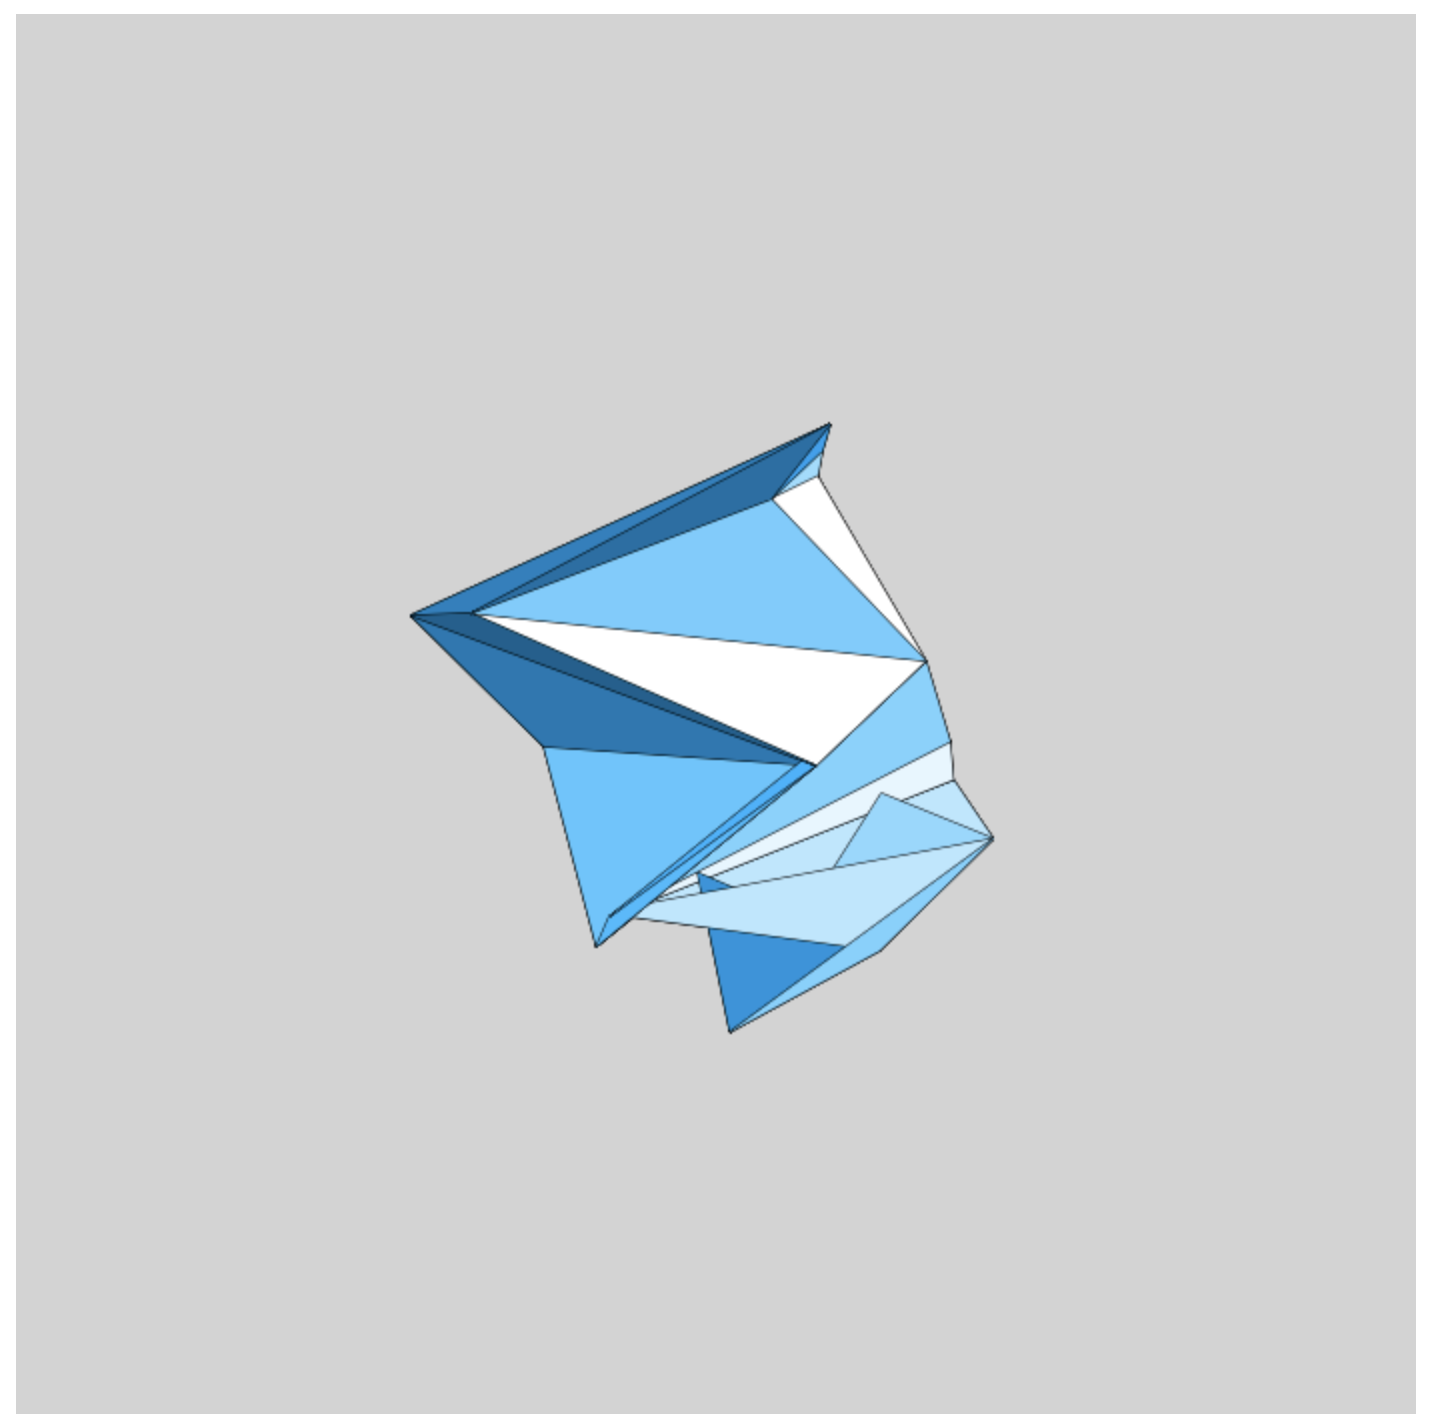
2nd try: better loop partitioning and connecting.
-
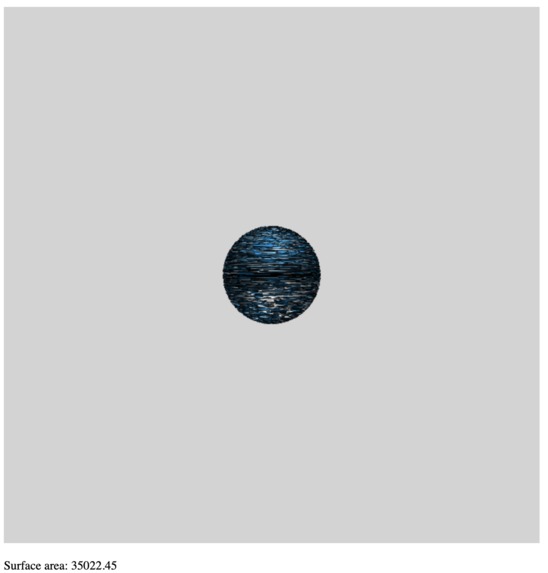
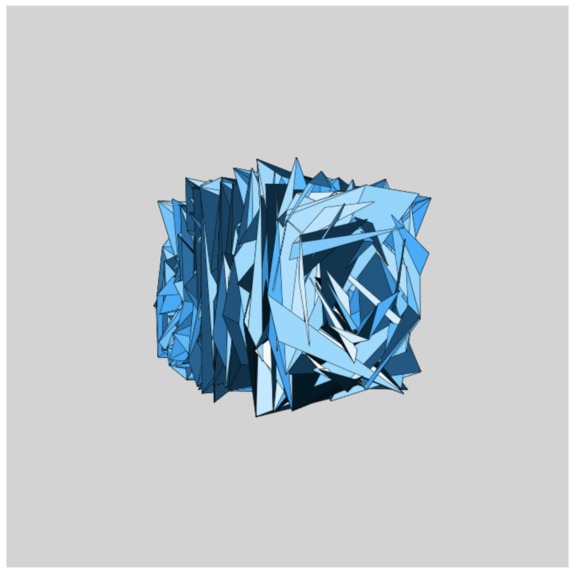
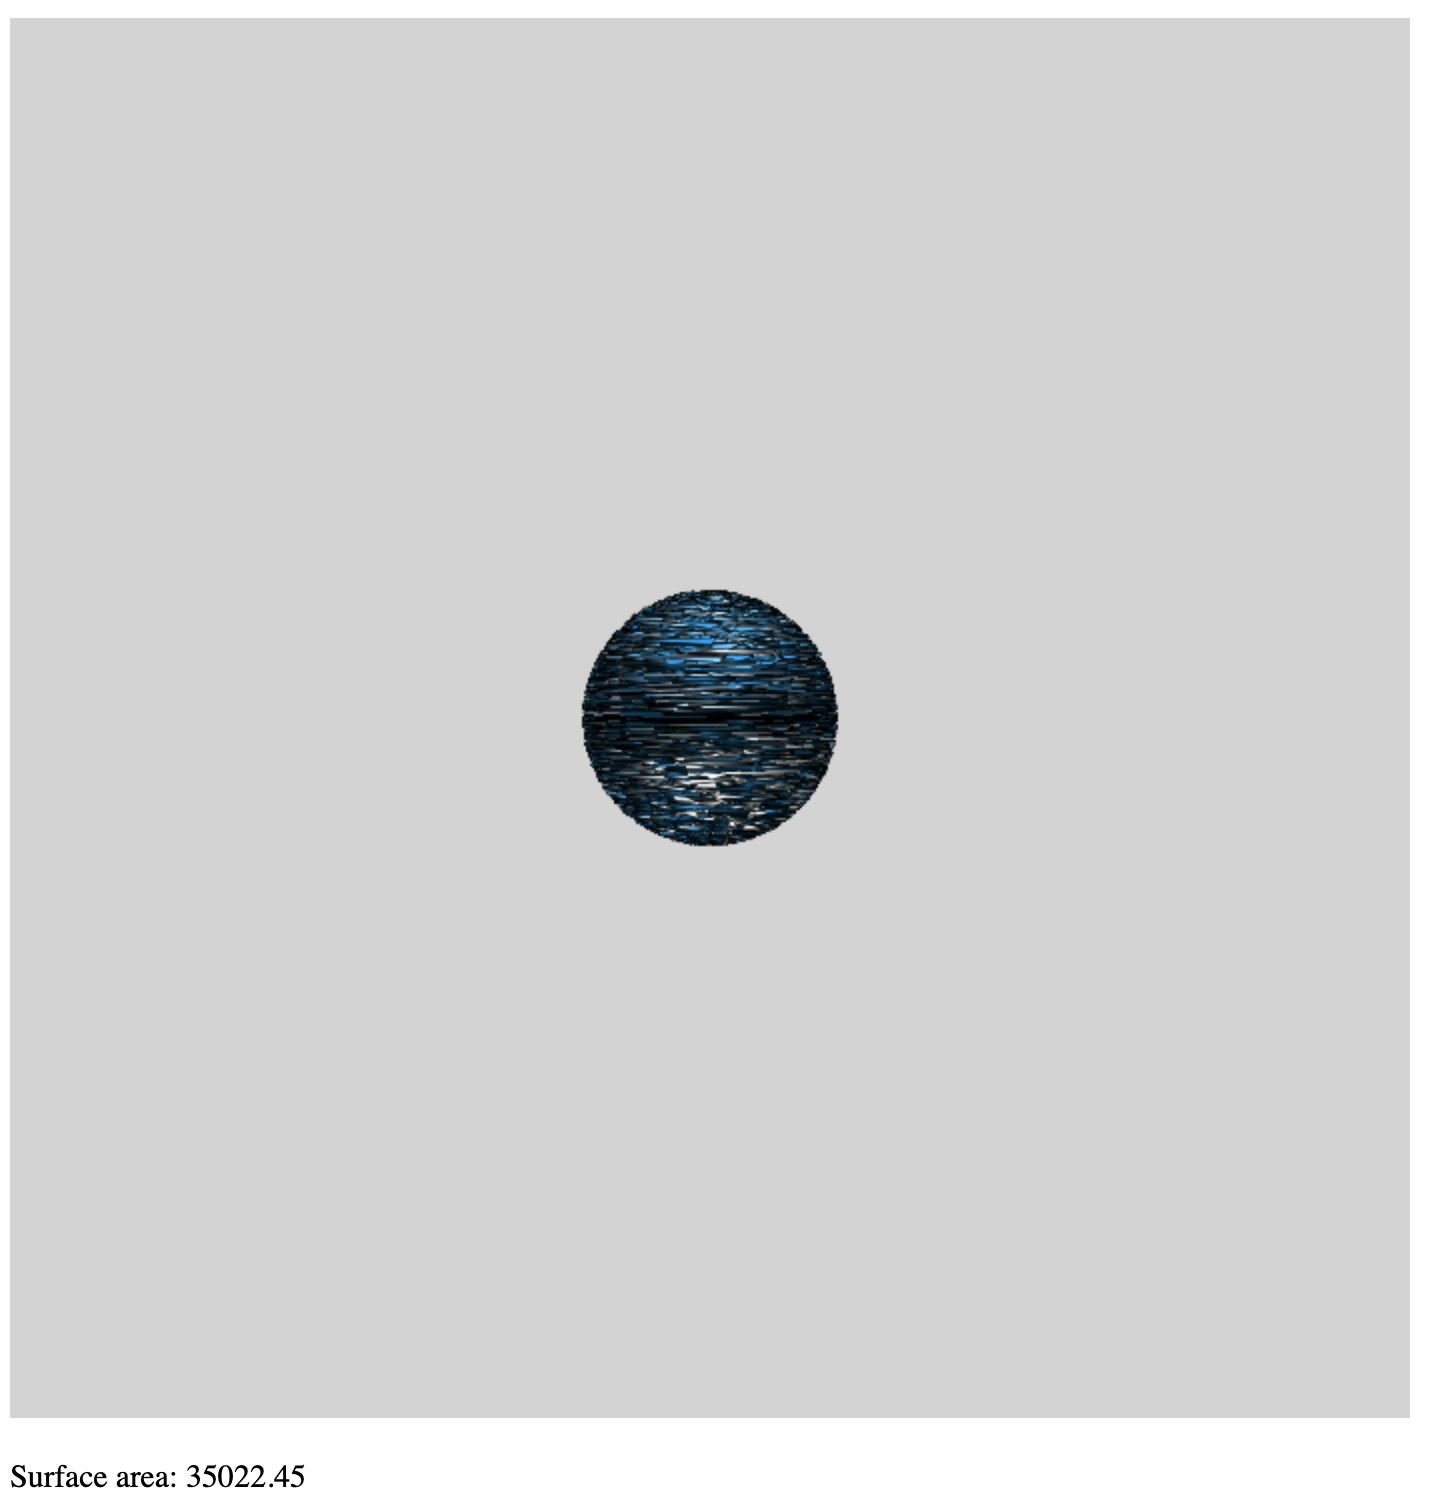
Final version: using the hackathon's dataset.
-
-
-


Cloud9
Clou9 is an educative website that allows for a broader audience to further gain insight on point cloud analysis. Point clouds are collections of data points in space, representing object surfaces, utilized in various fields such as 3D modeling and VR development. This interface allows users to 1)visualize point cloud data 2)understand the mathematical concepts behind the creation of volumes using point cloud data and 3)calculate area from given data set for each point cloud.
Education prospective of Cloud9
Educating individuals about point cloud analysis through a learning website visualization is paramount for enhancing accessibility, engagement, and comprehension of this complex subject matter. Point cloud analysis, often entailing intricate mathematical and computational processes, can be daunting to beginners and those without specialized training. By leveraging visualizations on a learning website, the information becomes more accessible to a broader audience, breaking down barriers to understanding. Through interactive and dynamic content, learners are not merely passive recipients of information but active participants in their education. They can manipulate visualizations, explore point cloud data, and witness immediate outcomes, fostering deeper comprehension and retention. Moreover, visualizations serve to clarify abstract concepts inherent in point cloud analysis. As learners observe concrete examples and illustrations, they gain insight into how point cloud data is structured, visualized, and analyzed in real-world contexts. Contextualizing point cloud analysis within practical applications across various industries, such as architecture, engineering, and archaeology, reinforces its relevance and potential impact. Furthermore, interactive visualizations facilitate hands-on skill development, allowing learners to practice manipulating point cloud data, performing analysis tasks, and interpreting results within a simulated environment. This experiential learning approach cultivates practical skills essential for academic pursuits and professional endeavors.
How we built it
--> Given a cloud of points in 3D Euclidean coordinates, the program transforms them into spherical coordinates, where theta is the CCW rotation about the y-axis and phi is the elevation angle, which can be represented in a 2D coordinate system. Sophie familiarized with Python object oriented programming by developing on a coordinate dictionary to allow the conversion between Euclidean coordinates to spherical coordinates. Then, sorting the points by elevation angle, it partitions the points into loops (similar elevation live in the same loop). In order to connect the loops, Ming and Yanye used different algorithms (the former alternates vertices, while the latter smashes the loops together for a more beautiful shape), but the end result is always triangulated. Using a custom-made 3D renderer based on linear algebra (made a long time ago, which we have reused), the mesh can be visualized. A custom-made CSV parser can be used to visualize a shape from the hackathon's datasets. Area is calculated using a standard cross product. --> The website is hosted on Google Cloud using personal ressources. Tianyi used Html and CSS to code the website graphical design and also the animations. The first challenge was to find out what did we want to represent in the website, whether the steps taken or the result mattered more. We decided to showcase our failed attempts as well the successful attempt to show our effort and techniques that allowed us to overcome the problems and it also gives an idea on our rational and thinking which allowed us to find new solutions to this specific problem. Multiples challenges came during the creation of the website such as the formatting and especially the positionning of images and texts, as well as alternating between the syntax of html and CSS, with CSS being a new language he was not familiar with. Using resources as his disposition such as W3school,StackOverflow and mentors that were here for us, we were able to create a website with a dynamic mechanism spotlighting the images we point our cursors too.
Challenges we ran into
- Coming with the method initially: The first challenge is to close up the loops, to do so. The original solution did not consider the possibility that the loop may self-intersect, since the origin is set arbitrarily. The problem is solved by taking the center of mass as the origin.
- Translating the math into code.
- Angle rotation: Problem occurs when the program tries to generate triangles. As it checks points by rotating around, some points get omitted. The problem is solved by hardcoding the special case.
Accomplishments that we're proud of
The mathematical algorithms have been successfully implemented within our coding design, allowing for users to view the different volumes from point clouds, according to different datasets.


Log in or sign up for Devpost to join the conversation.