-
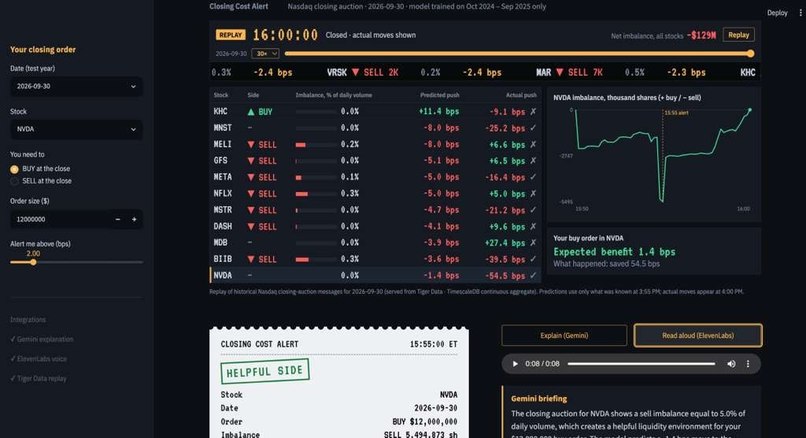
Dashboard
-
-
-
-
-
-
-
-
Inspiration
We had already been spending time in the market ourselves over the years, investing, following stocks, and trying different ways to understand why prices move. The more we traded and followed the market, the more we realized that looking at the price alone doesn't tell the whole story. We became curious about what was happening underneath the price and what signals might reveal where buying and selling pressure was building. That curiosity led us to look beyond traditional price data and explore market microstructure. While exploring the closing auction, we came across Nasdaq's imbalance data, which shows when there are significantly more shares trying to buy than sell, or vice versa, in the minutes before the 4:00 PM close.
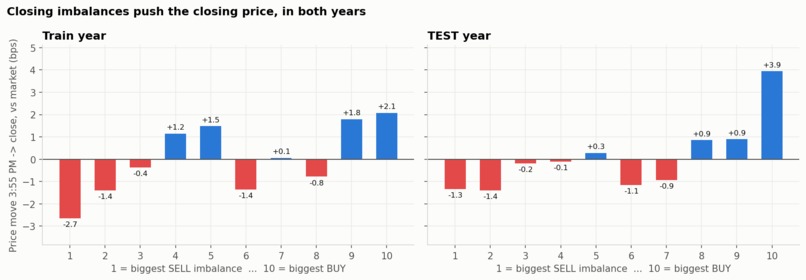
That immediately gave us a question we could actually test: If the market is showing us this buying and selling pressure before the close, can we use it to predict where the price will move? We tested the idea from several angles, whether large imbalances push the closing price, whether the movement reverses overnight, and whether the signal could actually be traded after accounting for spreads and transaction costs.
The surprising part was that the signal was real and predictable, but the cost of trading it was larger than the opportunity itself. That changed our direction. Instead of trying to force the signal into a profitable trading strategy, we asked how it could help someone who has to execute a large order at the close. That became CloseWatch: a tool that turns closing-auction pressure into an estimate of the cost a trader may face.
What It Does
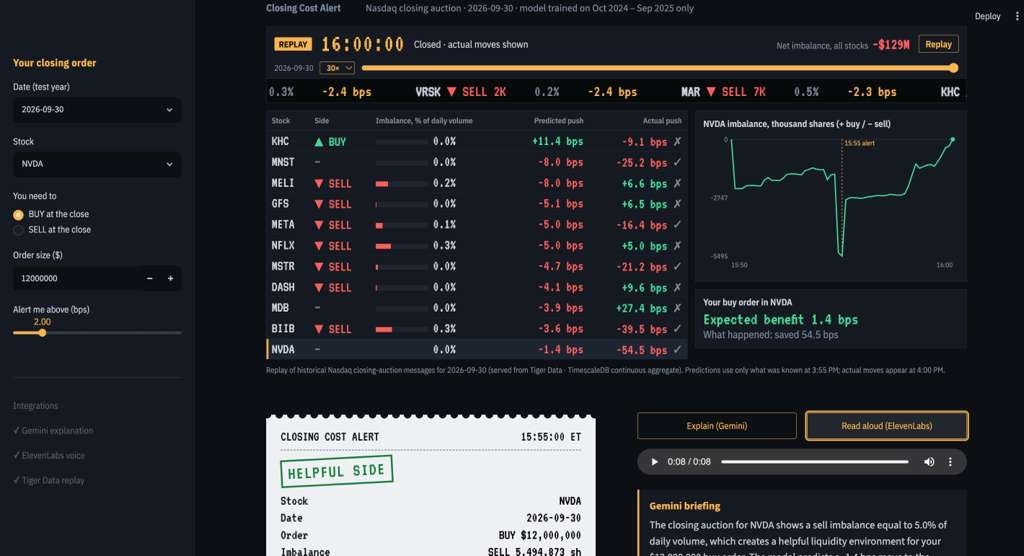
CloseWatch is a closing-auction cost alert and historical replay tool. A user can choose a historical trading day, stock, trading direction, and order size. CloseWatch then estimates the expected additional execution cost of trading into the closing auction and presents the result as a trade ticket.
For example:
CROWDED CLOSE ALERT
Buy-side imbalance detected
Expected additional cost: 5.4 bps
Estimated dollar impact: $5,409
The application also replays the historical auction from 3:50 PM to 4:00 PM. It shows what information would have been available at each point in time, triggers an alert around 3:55 PM, and compares the predicted closing move with what actually happened. CloseWatch is not designed to tell traders what to buy or sell. Its purpose is to help them understand a more practical question: “If I need to trade at the close, how expensive might it be?”
How We Built It
We used Databento market data to study closing auctions for 100 large Nasdaq stocks across 496 trading days, from October 2024 through September 2026.
Our data included:
- Nasdaq ITCH closing-auction imbalance messages
- Bid and ask quotes around 3:55 PM
- Official daily open, close, and volume data
- Nearly 49,560 stock-day observations after data cleaning
Our pipeline was: Databento Market Data -> Data Cleaning and Feature Engineering -> Market Impact Analysis -> Strategy Backtesting -> Machine Learning Model Comparison -> Risk and Transaction-Cost Analysis -> CloseWatch
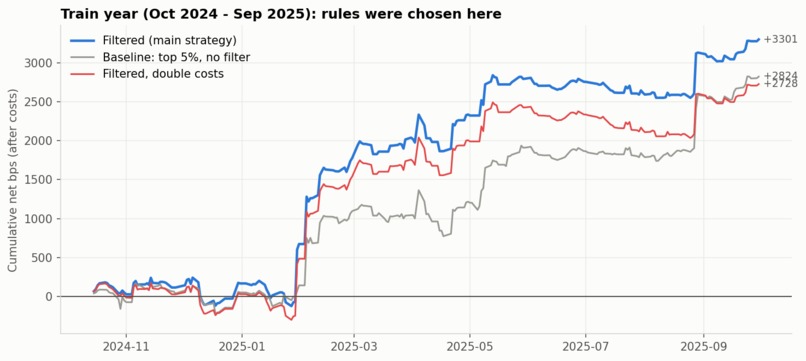
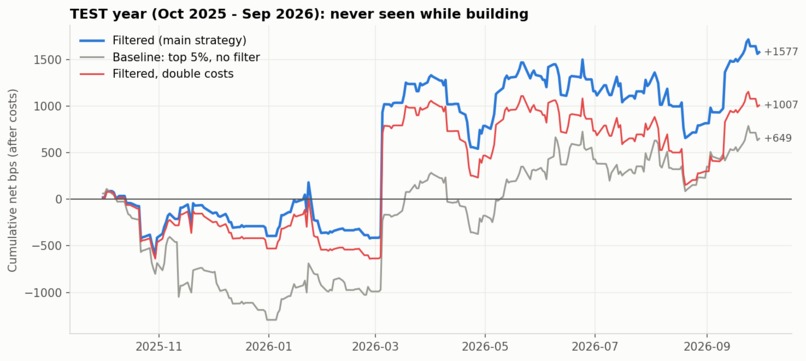
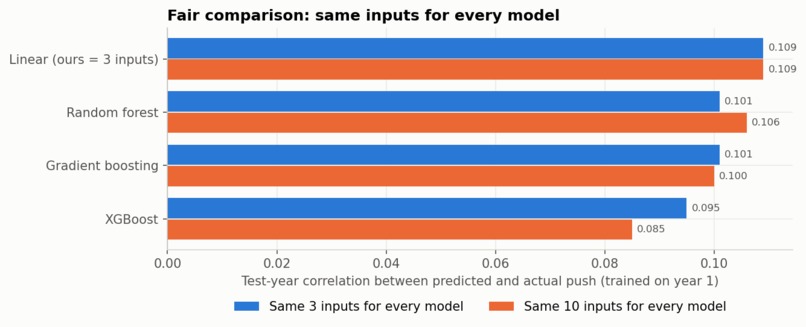
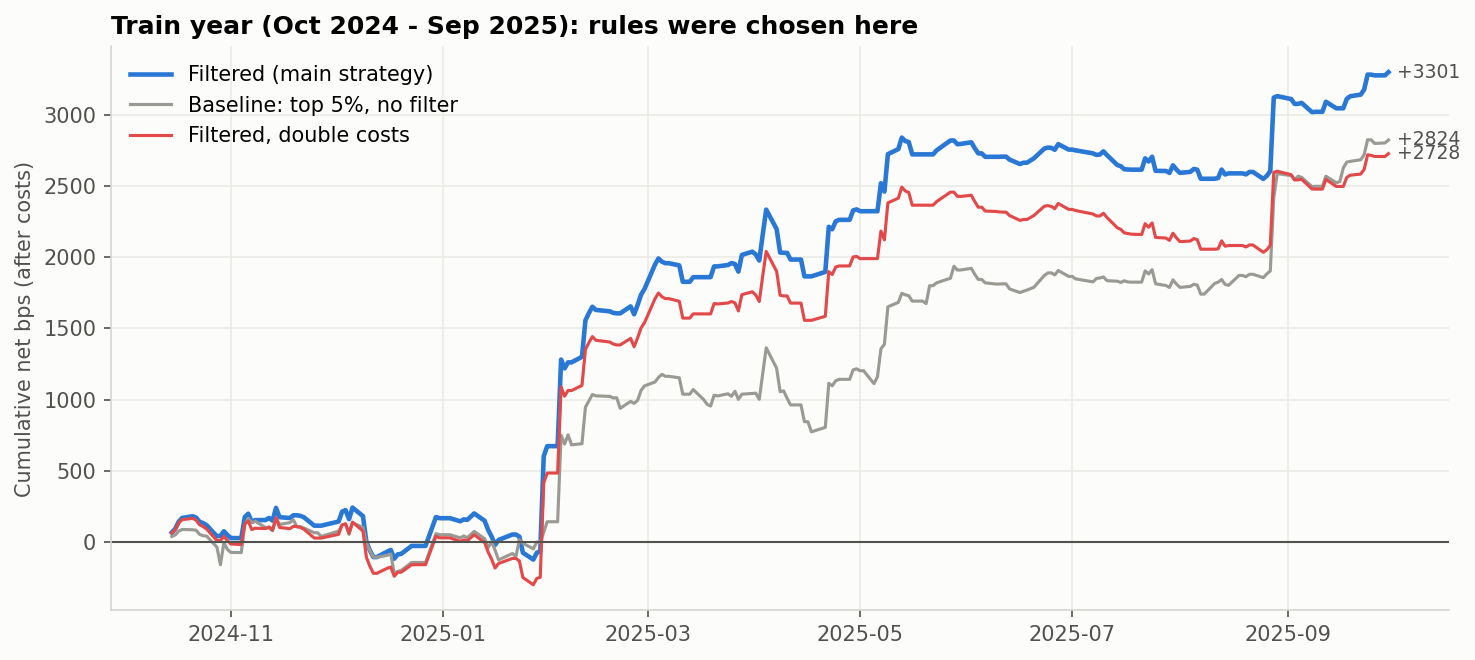
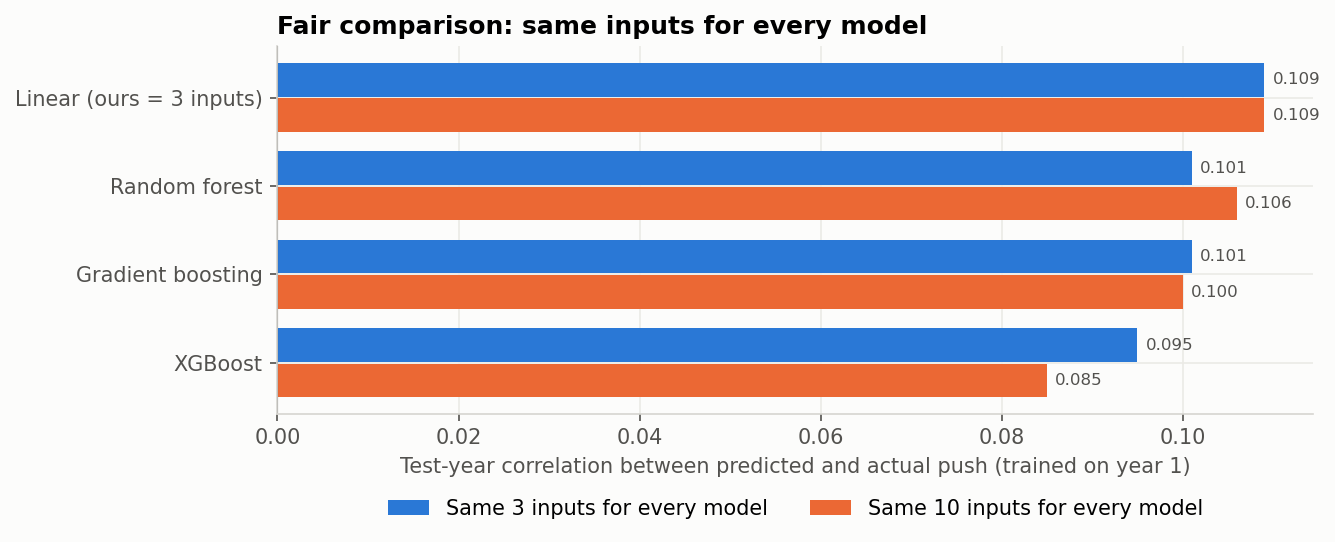
We used the first year of data for research and model development. The second year was kept completely out of sample and was only used to evaluate the final models and strategies. For prediction, we compared: Linear Regression, Random Forest, Gradient Boosting, XGBoost
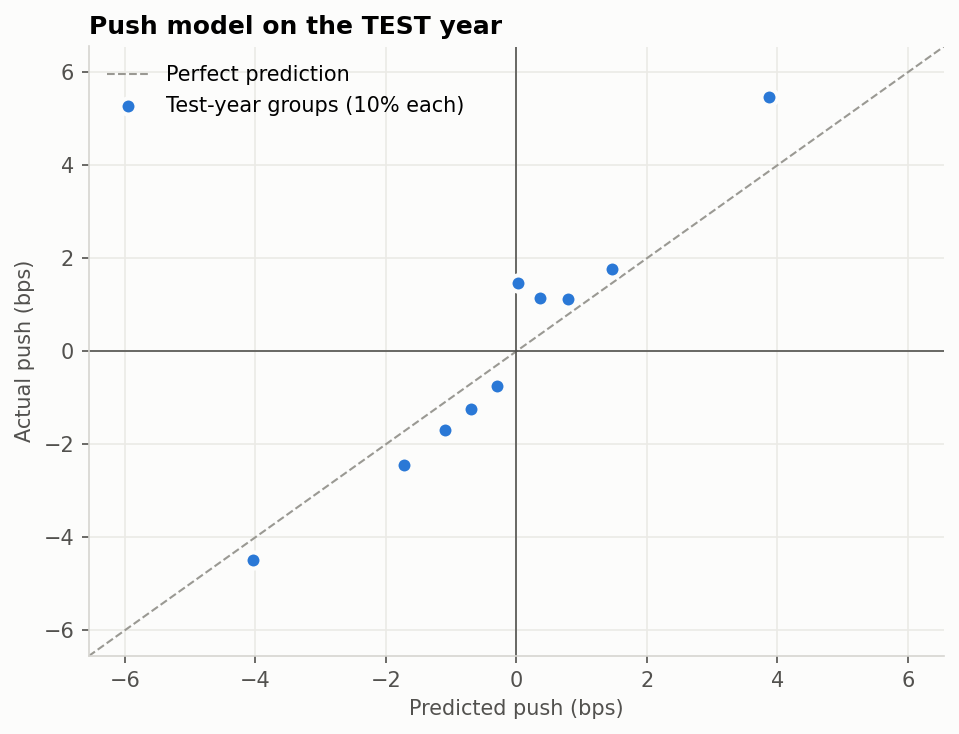
Interestingly, the simple three-input linear model performed best on unseen data. XGBoost achieved stronger in-sample performance but generalized worse in the second year, showing that a more complicated model does not always produce a better real-world result.
Challenges We Ran Into
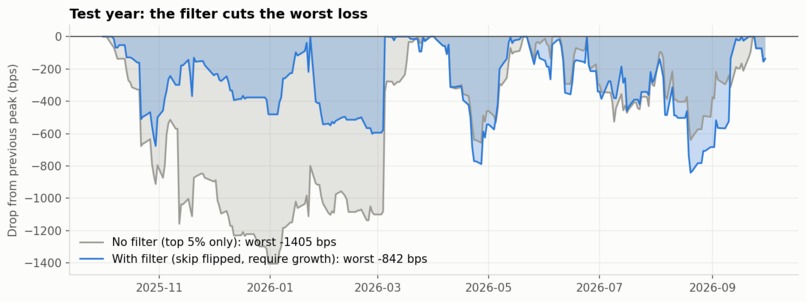
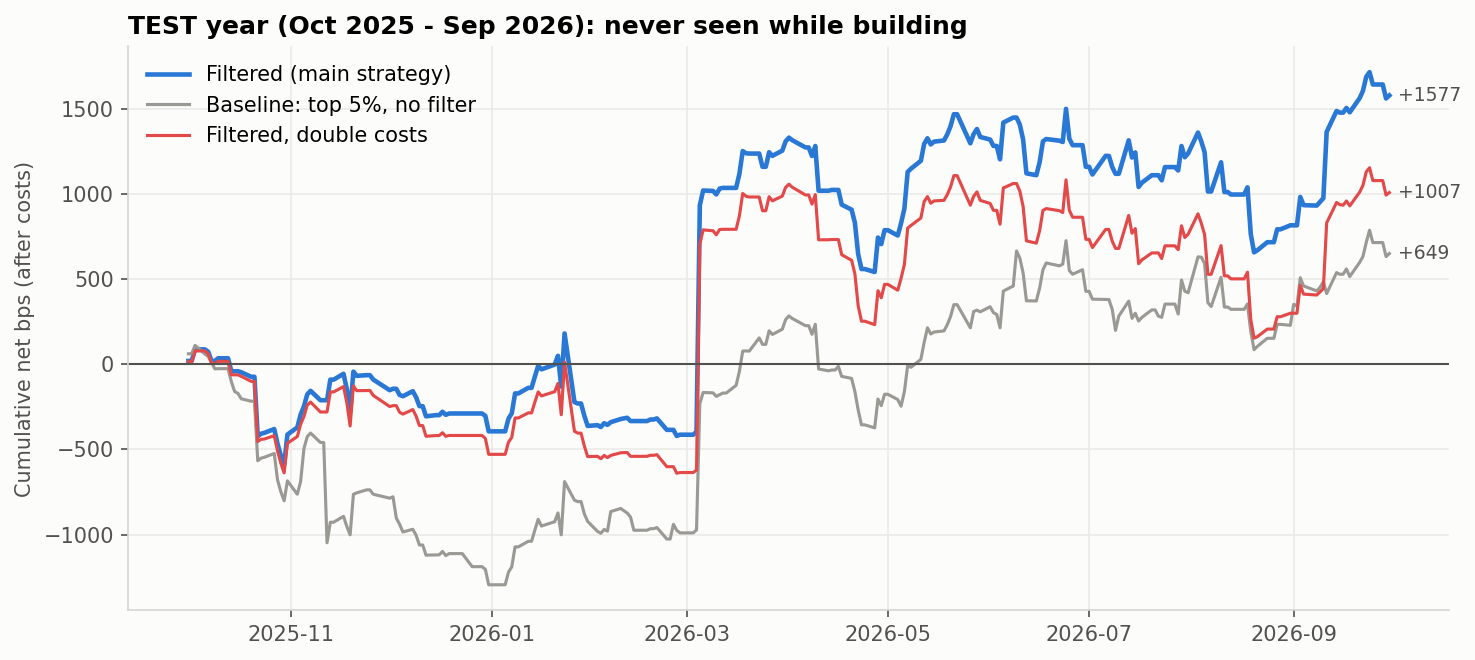
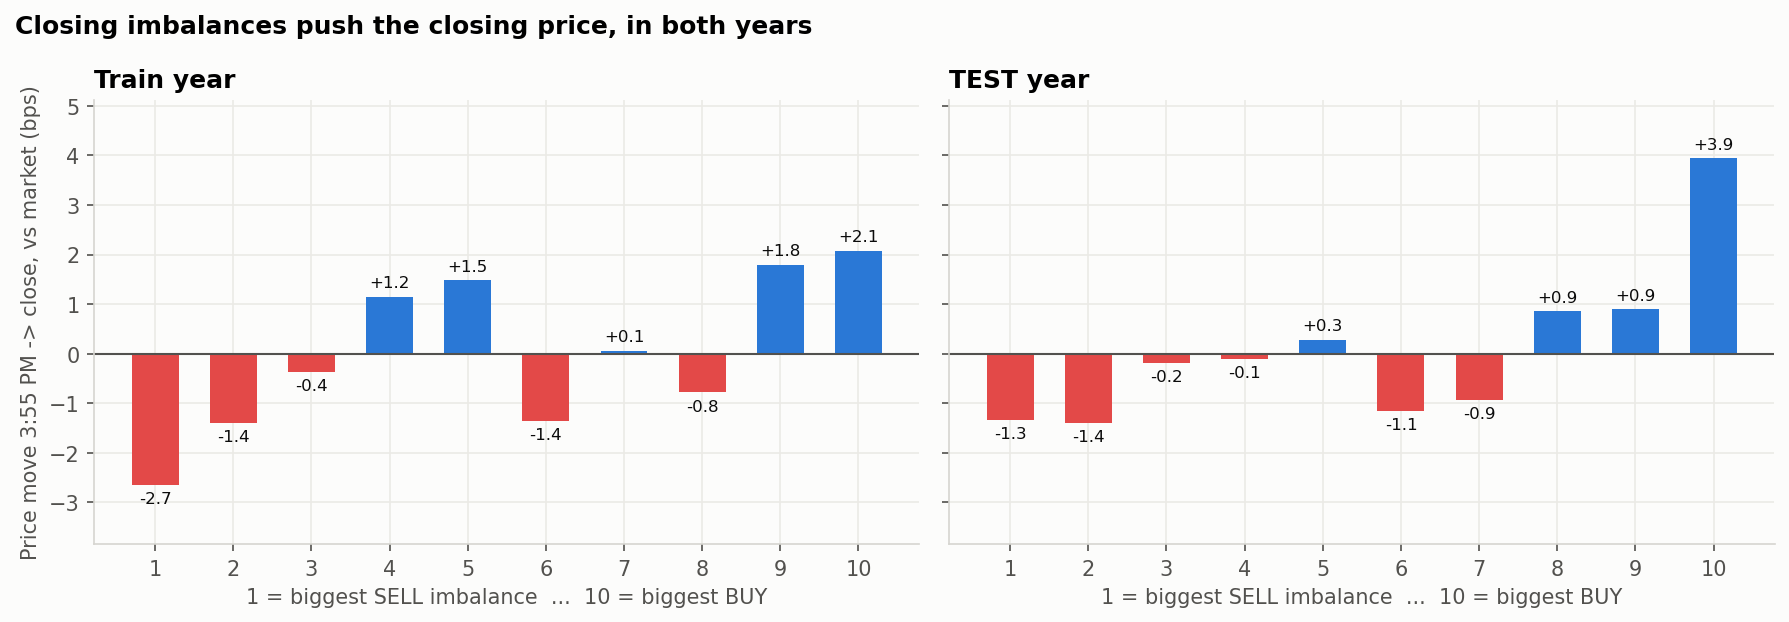
The biggest challenge was determining whether a predictable market effect could actually be traded profitably. At first, the closing imbalance appeared to be a potential trading opportunity. Large imbalances pushed prices toward the imbalance direction, and our model predicted the direction better than chance. However, after including realistic transaction costs, the economics changed. Our Closing Pressure strategy captured approximately 3.6 bps of price movement but paid approximately 5.7 bps in spread and fees. The strategy had a negative out-of-sample Sharpe ratio. The spread ate the push. We also had to guard carefully against overfitting. More complex models looked better during training but did not always perform well on unseen data. This forced us to focus on out-of-sample evidence instead of selecting the model or strategy with the most impressive historical backtest.
Accomplishments That We're Proud Of
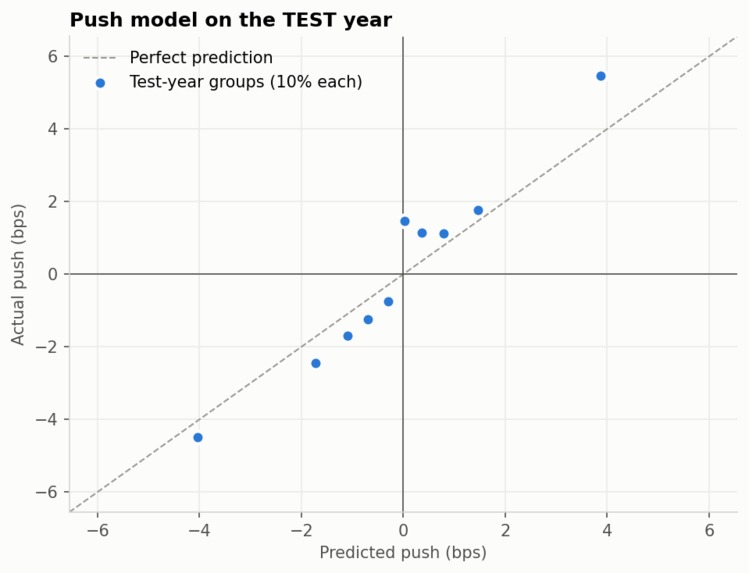
We are proud that the project produced a real out-of-sample finding instead of stopping at an in-sample backtest. On the largest 10% of closing-auction imbalances in our unseen test year:
- The closing price moved +2.07 bps in the direction of the imbalance.
- The result had a t-statistic of 3.2.
- Our model predicted the direction correctly 56.9% of the time.
- The signal remained detectable on completely unseen data.
- The simple linear model outperformed more complex models out of sample.
We are also proud that we did not force the research into a profitable-strategy narrative. When the results showed that transaction costs consumed the opportunity, we changed the product direction. Instead of claiming we found a free-money trading strategy, we built CloseWatch to help funds understand the likely execution cost of participating in a crowded closing auction.
What We Learned
The biggest lesson from this project was: A predictable signal is not necessarily a profitable signal. We learned that:
- Out-of-sample testing matters more than impressive in-sample backtest results.
- Transaction costs can completely change a strategy’s economics.
- Simple models can outperform complex models when financial data is noisy.
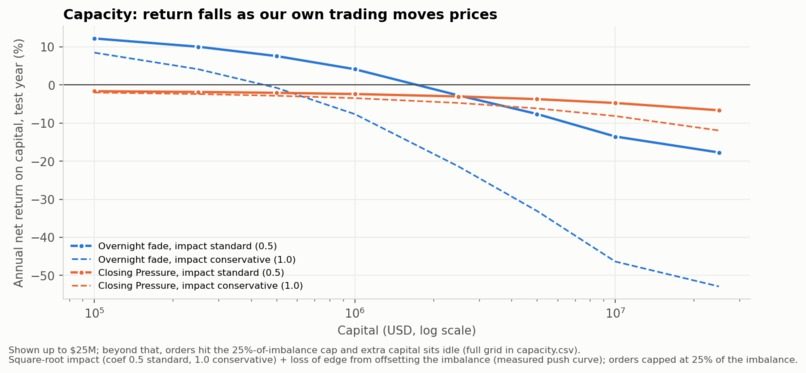
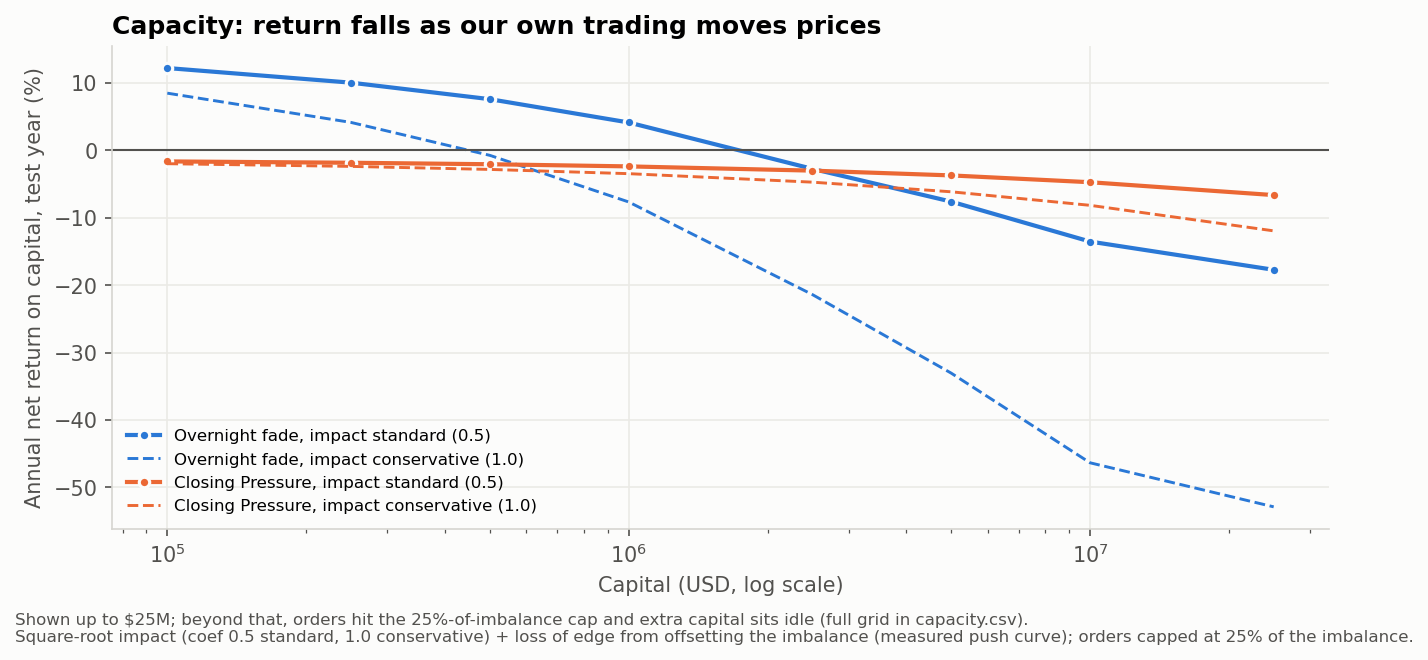
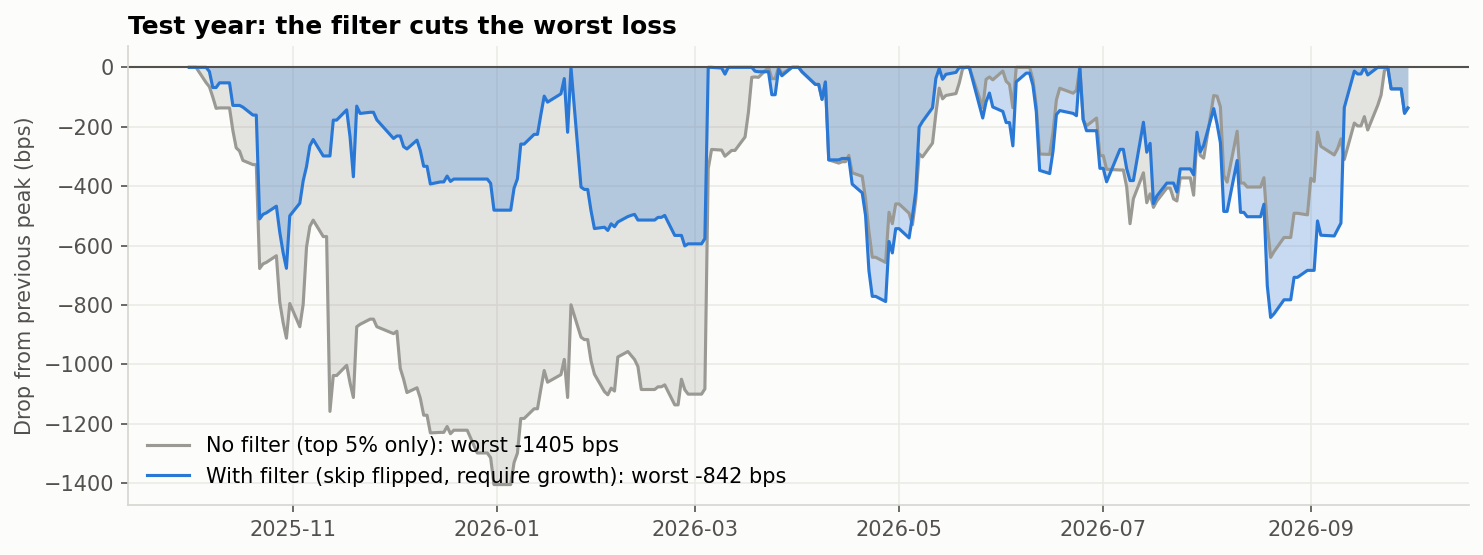
- Risk, drawdowns, capacity, and market impact matter just as much as returns.
- A research result does not have to become a trading strategy to create value.
Most importantly, we learned that a failed strategy can lead to a better product. The closing-auction signal may not be attractive for an outside trader after costs, but it can still be extremely useful for institutions that are required to trade at the closing price.
What's Next for CloseWatch
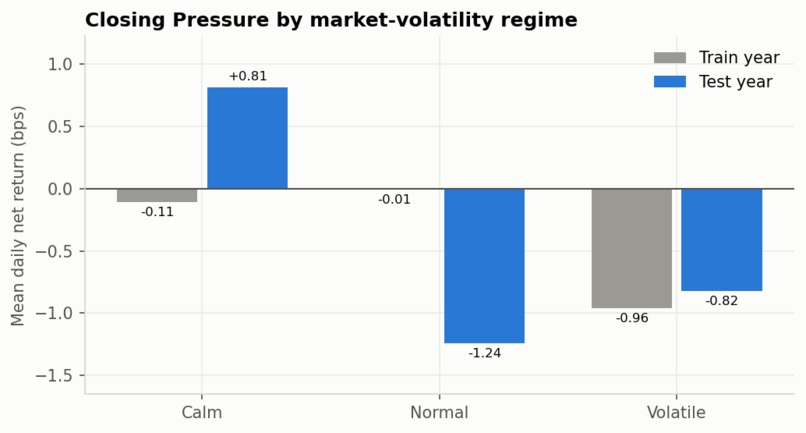
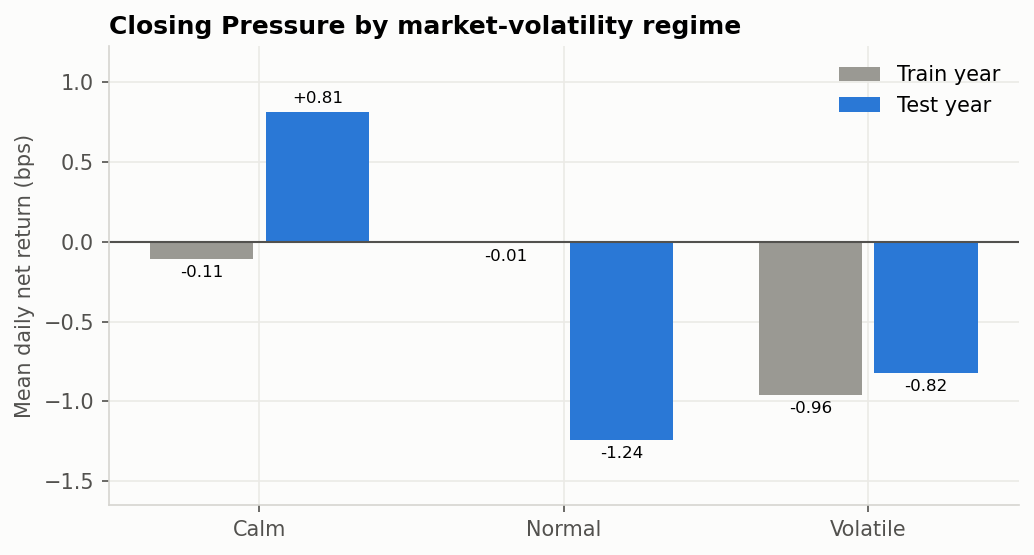
Our next step is to test our exploratory finding that Closing Pressure may behave differently in stocks with very tight spreads. This is currently a hypothesis for future data, not a claimed trading strategy.
We also plan to:
- Extend the research beyond the current 100-stock Nasdaq universe.
- Test the approach on NYSE closing auctions.
- Add more recent data for a new out-of-sample validation period.
- Continue improving the transaction-cost and market-impact model.
- Add portfolio-level order-size scenarios and execution-cost summaries.
- Move toward delivering alerts directly to institutional execution desks.
Our long-term goal is simple: Turn closing-auction data into actionable information that helps institutional traders make better execution decisions.
Live demo: http://64.177.42.218. The demo runs on historical test-year data (Oct 2025 – Sep 2026): pick a date and stock, and it plays back that day's closing auction from 3:50 to 4:00 PM.


Log in or sign up for Devpost to join the conversation.