-
-
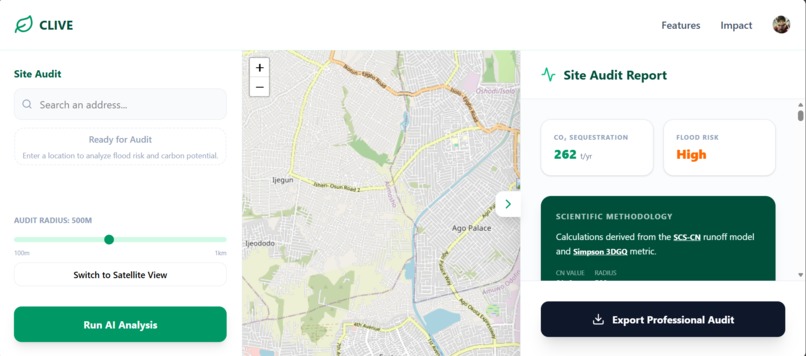
Project dashboard

Inspiration The project was inspired by the "Sponge City" concept—the idea that urban areas should act like sponges to soak up rainwater and prevent flooding. Traditionally, performing a professional environmental audit for a site is expensive, slow, and requires a specialized team of hydrologists. The goal of this project was to determine if Multimodal AI could bridge that gap, allowing a user to click on a map and receive a science-grounded environmental report in seconds.
How I Built It The project is a React/Vite dashboard integrated with the Gemini 3 Flash API.
The Vision: I used react-leaflet for the mapping interface and a screenshotting engine to capture site-specific satellite imagery.
The Intelligence: I implemented a workflow where I provided the Gemini AI with specific peer-reviewed research papers, specifically the SCS-CN (Soil Conservation Service Curve Number) and ISM (Integrated Sequestration Model). This ensures the model calculates runoff and carbon sequestration based on established academic formulas rather than general estimates.
The Output: I built a custom parser to extract JSON for dashboard metrics and Markdown for a professional-grade PDF audit report, rendered with LaTeX for scientific formulas.
What I Learned The development process provided deep insights into Multimodal Prompting. I learned how to structure prompts that require an AI to simultaneously analyze visual map data and technical text from 20-page PDF documents. I also gained experience in handling complex CSS for print media and managing environment variables securely for production-ready Vercel deployments.
Challenges I Faced The Print Interface: Getting a browser to print a clean, professional PDF from a dynamic React sidebar was a significant hurdle. I solved this by building a dedicated "Print Portal" and using specialized CSS to ensure LaTeX math formulas rendered correctly on the final document.
Multimodal Context: Ensuring the AI correctly identified terrain features, such as distinguishing between permeable vegetation and impermeable concrete from a satellite image, required extensive prompt engineering and grounding.
Data Parsing: Extracting consistent JSON data alongside a long Markdown report in a single API call was challenging. I resolved this by using a tagged output structure to separate the machine-readable data from the human-readable report.
What's next for CLIVE: I hope to add more features like terrain highlighting, more accurate analysis, and possible more multimodal features I can integrate, hopefully making a tool for anyone to easily know how to make change.

Log in or sign up for Devpost to join the conversation.