-
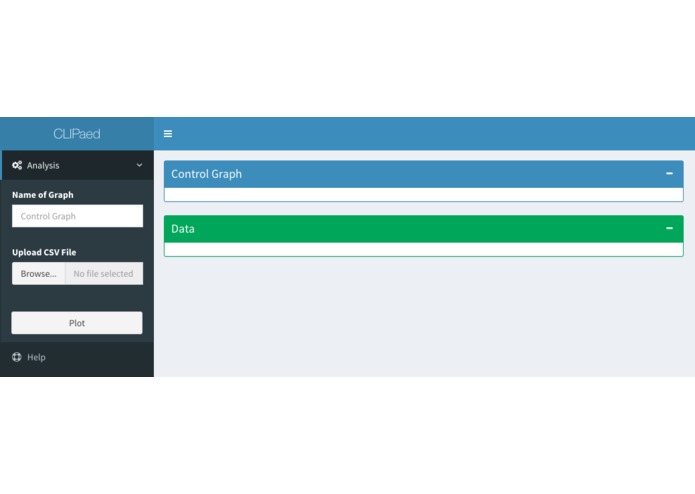
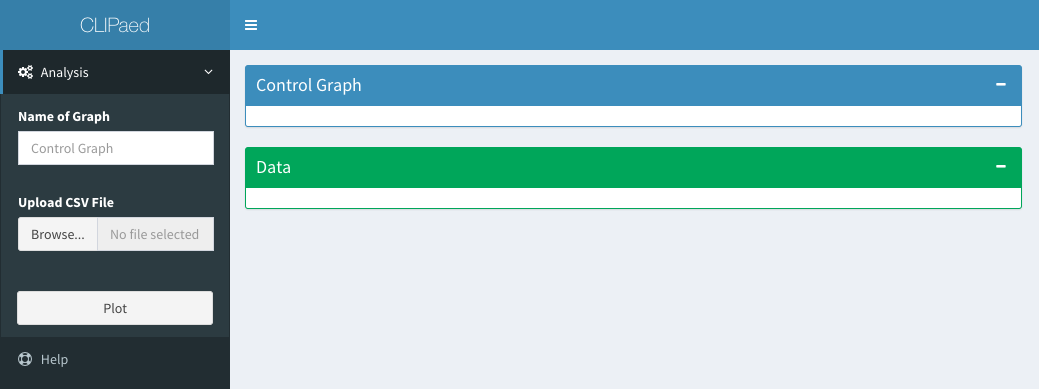
Initial interface
-
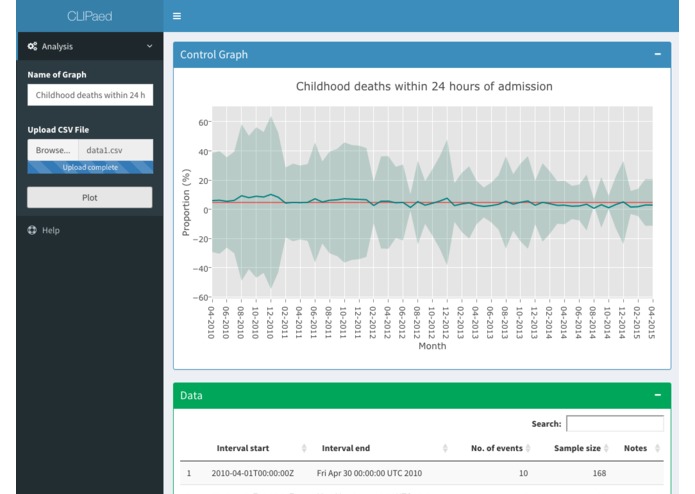
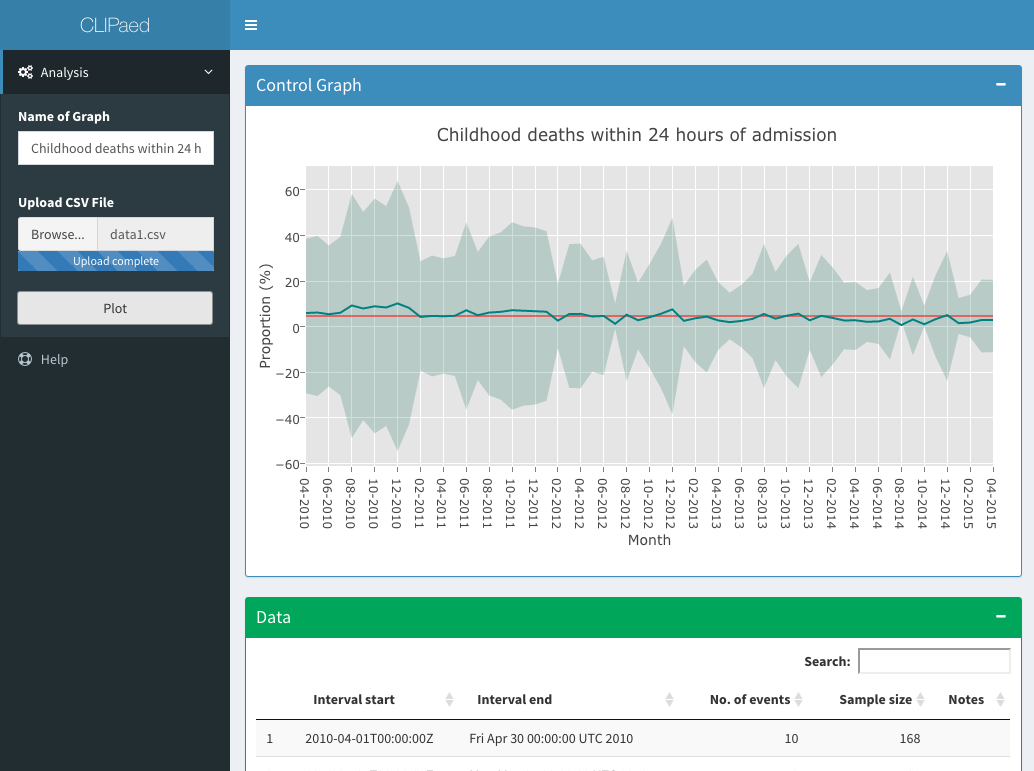
Data visualization
-
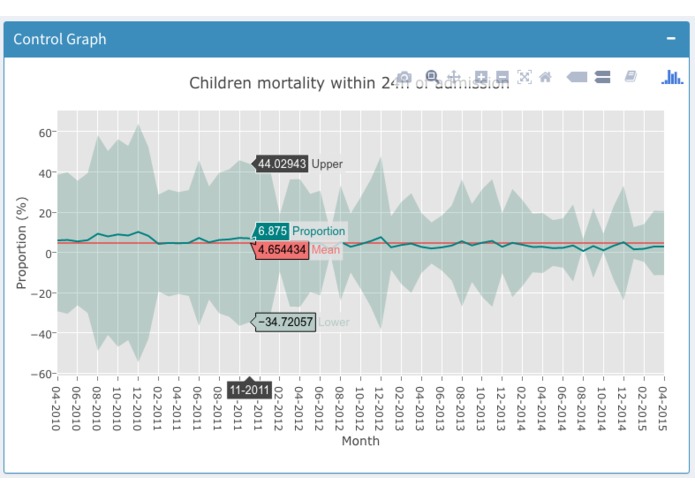
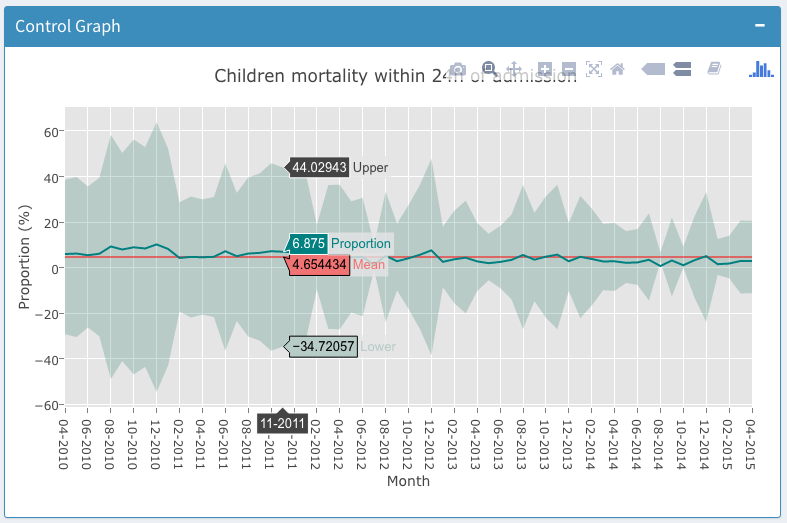
Interactive visualization
-
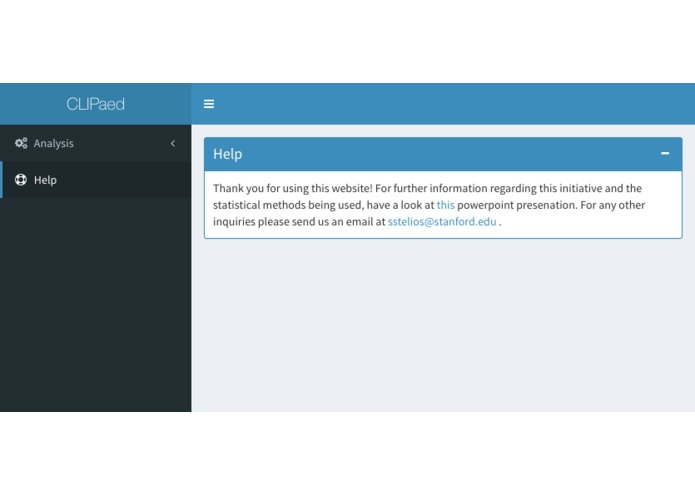
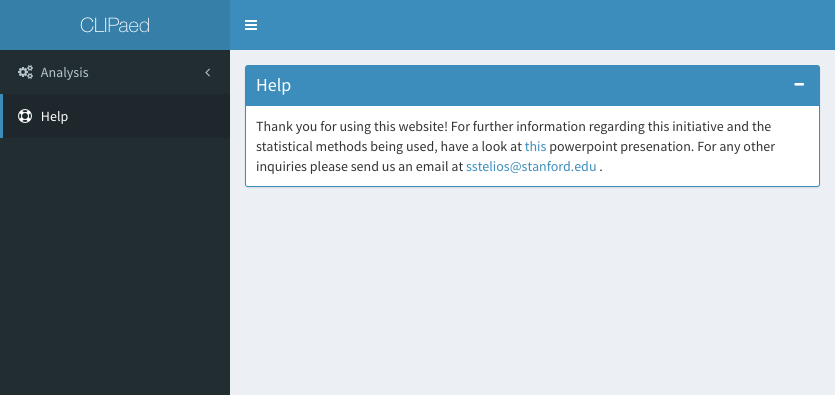
Support
Inspiration
An estimated 33 million disability-adjusted life years (DALYs) are lost each year due to medical errors, making bad health care as grave a public health threat as malaria or tuberculosis. At least 2/3 of medical errors occur in the global south. In the US, we know that an iterative, data-driven approach to health care improvement is effective in reducing medical errors. But in the global south, providers don’t have the data analytics tools to do this. Thanks to programs like Open Data Kit and DHIS2, we’re learning a tremendous amount about healthcare performance in remote settings. Unfortunately, this information is designed for policymakers, who create one-size-fits-all solutions, and not for health care providers. If we inform providers with their own performance data, wouldn’t they be better positioned to create site-specific solutions?
What it does
CLIPaed receives CSV files containing health care performance data and creates statistical process control charts that can be easily interpreted by clinicians. Health care teams can identify operational problems affecting their patients by analyzing outlying data, process variation, and mean performance.
How we built it
This was built on R using Shiny, and is being hosted on shinyapps.io.
Challenges we ran into
We wanted to create an interface that received data directly, as this would guide the type and quality of data collected. We were unable to do this in the time allotted.
Accomplishments that we're proud of
We have built a web app that generates gold-standard data visualization for health care quality improvement. To our knowledge, this has not been done before.
What we learned
We are physicians, not web developers!
We learned 1) that wrappers and other tools make web development possible for users with limited experience in web development; 2) that Shiny can leverage our skills in R to build powerful web apps; and 3) that the provider perspective is important in understanding and using health care data.
What's next for CLIPaed
We have constructed a prototype and proof of concept with TreeHacks Health. We now have three tasks ahead of us:
First, to make data collection as easy as possible, we need to integrate our data visualization tool with a live data entry system.
Second, we need to help users identify the root cause of a problem, determine how to measure the problem, and identify the best solution to the problem. Fortunately, a form-based tool is already being developed by the Baylor International Pediatric AIDS Initiative (BIPAI); we hope to integrate our app as an API.
Third, we need to beta test our app with users in the global south.
Built With
- css
- html
- javascript
- r
- shiny
Log in or sign up for Devpost to join the conversation.