Inspiration
Climate change usually shows up as a global average, a number that feels distant and abstract. But climate is local, and it is already in transit. We wanted to answer one deeply personal question: what is coming to my place, and what can I actually do about it before it hits? So we built a planet you can spin, click, and interrogate, turning decades of climate projection into a single honest story about the ground under your feet.
What it does
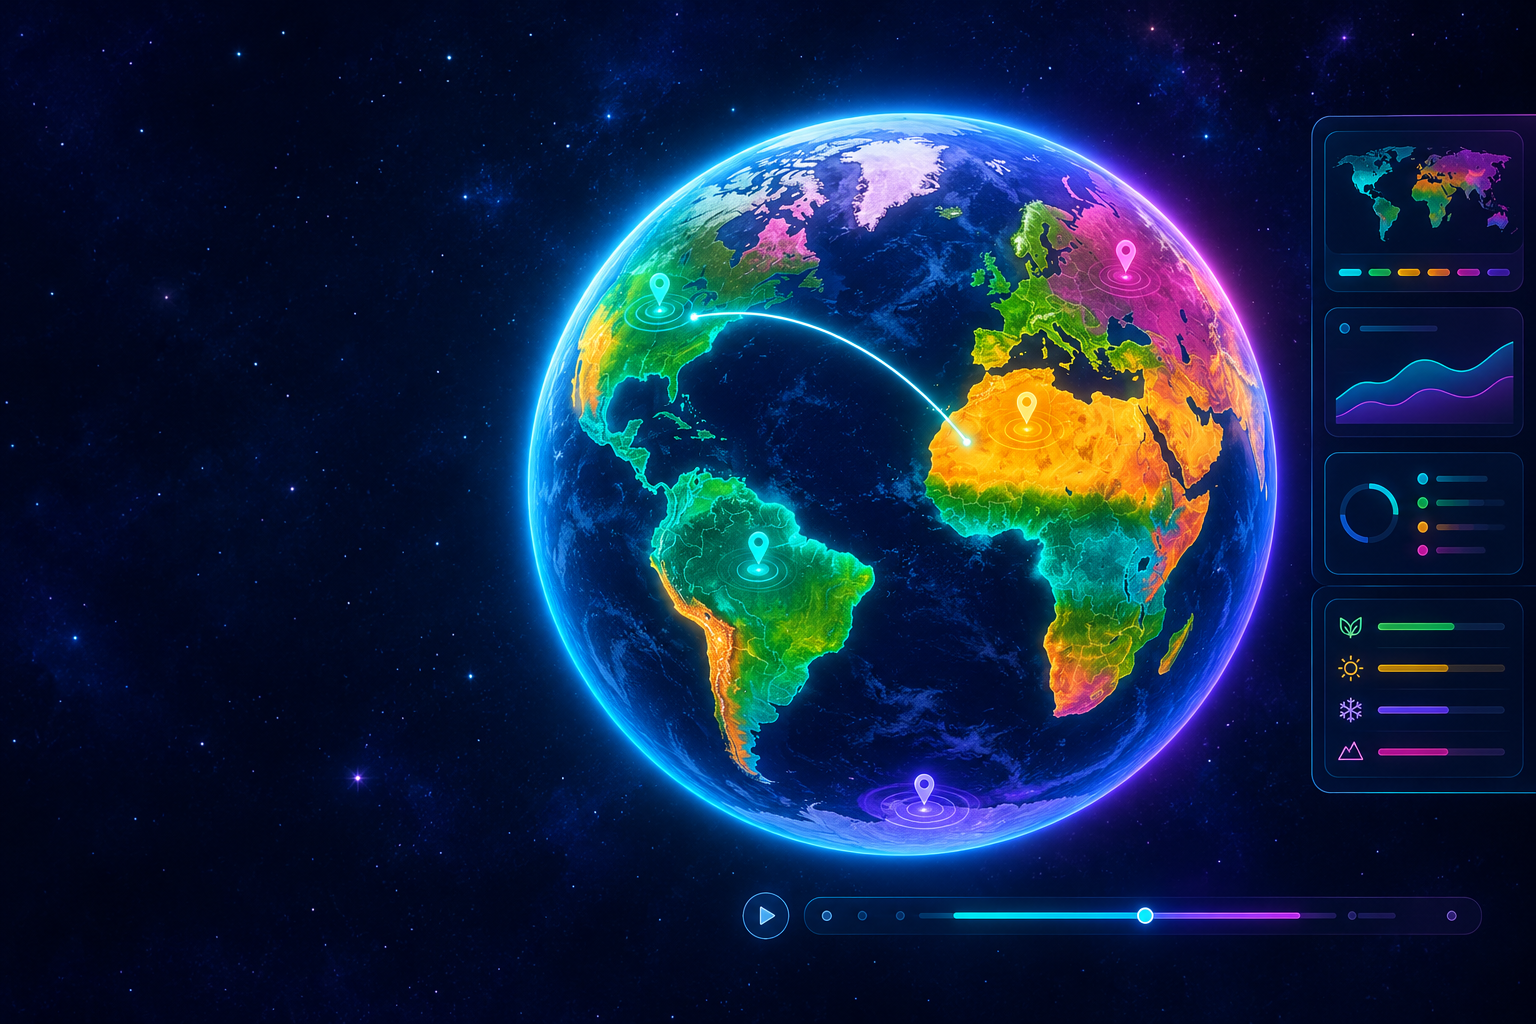
ClimateTransit is an interactive 3D globe of Earth's climate zones.
- Click anywhere or search a city to see your Köppen climate zone today versus the zone projected for 2050 or 2100 under different emissions scenarios.
- Travel through time with a slider and watch zones shift under SSP1-2.6, SSP2-4.5, and SSP5-8.5.
- Live risk chips for heat, moisture, UV, and air quality, each with a transparent formula.
- A sourced resilience plan for every place, grouped by horizon (now, this season, long term) and filterable by audience (farmer, household, planner).
- A Gemini brief that turns the facts into calm, actionable guidance.
- A planner view ranking which countries change the most, with CSV export.
How we built it
- Frontend: React, TypeScript, Vite,
react-globe.gl, and Three.js. - Data pipeline: Python builds 0.5° Köppen grids, a manifest, and area-weighted shift statistics.
- Rendering: the browser paints the climate texture on a canvas, reads zones instantly from the grid with no server round trip, and overlays country borders from a bundled world-atlas dataset.
- Live data: Open-Meteo supplies forecast and air quality with no API key.
- AI: a single Vercel serverless function calls Gemini with a facts-only prompt and a deterministic template fallback.
- Deployment: live on Vercel from day one.
Challenges we ran into
Keeping the globe fast and honest at the same time was the hard part.
- Grid math had to agree exactly between Python and TypeScript, so a click never reports the wrong zone. We locked this down with unit tests.
- Adding country borders risked blocking the core click-to-inspect gesture, so we wired polygon clicks to still drop a pin.
- Our serverless brief first crashed in production from a missing ESM file extension, which we caught and fixed.
- Hardest of all was resisting fabrication: when data is thin, we show "limited data" rather than a confident guess.
Accomplishments that we're proud of
We shipped a live, working demo, not a slide deck. The core loop feels magical: spin, click your hometown, slide to 2100, and watch your climate change.
We are proudest of the honesty baked into every pixel. Projections are labeled "projection, not prediction," model output is labeled as model output, resilience actions cite FAO, IPCC, and WHO, and the AI can rephrase facts but can never invent an action. Insight always ends in something you can do, which is the whole point.
What we learned
- Trust is a feature, built from a thousand small design choices, not a disclaimer at the bottom.
- Constraining an AI to only rephrase provided facts makes it far more useful and far safer than letting it free-associate.
- The hard parts of geospatial work are real: projection math, majority resampling, and area-weighted statistics.
- Deploying on day one surfaces the real problems early, long before the demo lights come on.
What's next for ClimateTransit
- Swap our sample grids for the authoritative Beck et al. 2023 Köppen dataset.
- Add a forecast reliability layer with per-zone bias correction, so users can see how much to trust each number.
- Build a "climate twin" feature showing which city lives today in your future climate.
- Offline support for low-connectivity regions and localized languages.
- A shareable report so a farmer, a household, or a city planner can hand their plan to someone who can act on it.
Built With
- gemini-api
- koppen-geiger
- numpy
- open-meteo
- python
- rasterio
- react
- react-globe.gl
- scikit-learn
- tailwindcss
- three.js
- typescript
- vercel
- vercel-functions
- vite
- worldclim
- zustand

Log in or sign up for Devpost to join the conversation.