Inspiration
Climate change is one of the biggest challenges of our time, yet schools often lack engaging, localized tools to teach it. We wanted to create something that makes climate data relatable for students — connecting real-world environmental changes to their own neighborhoods.
What it does
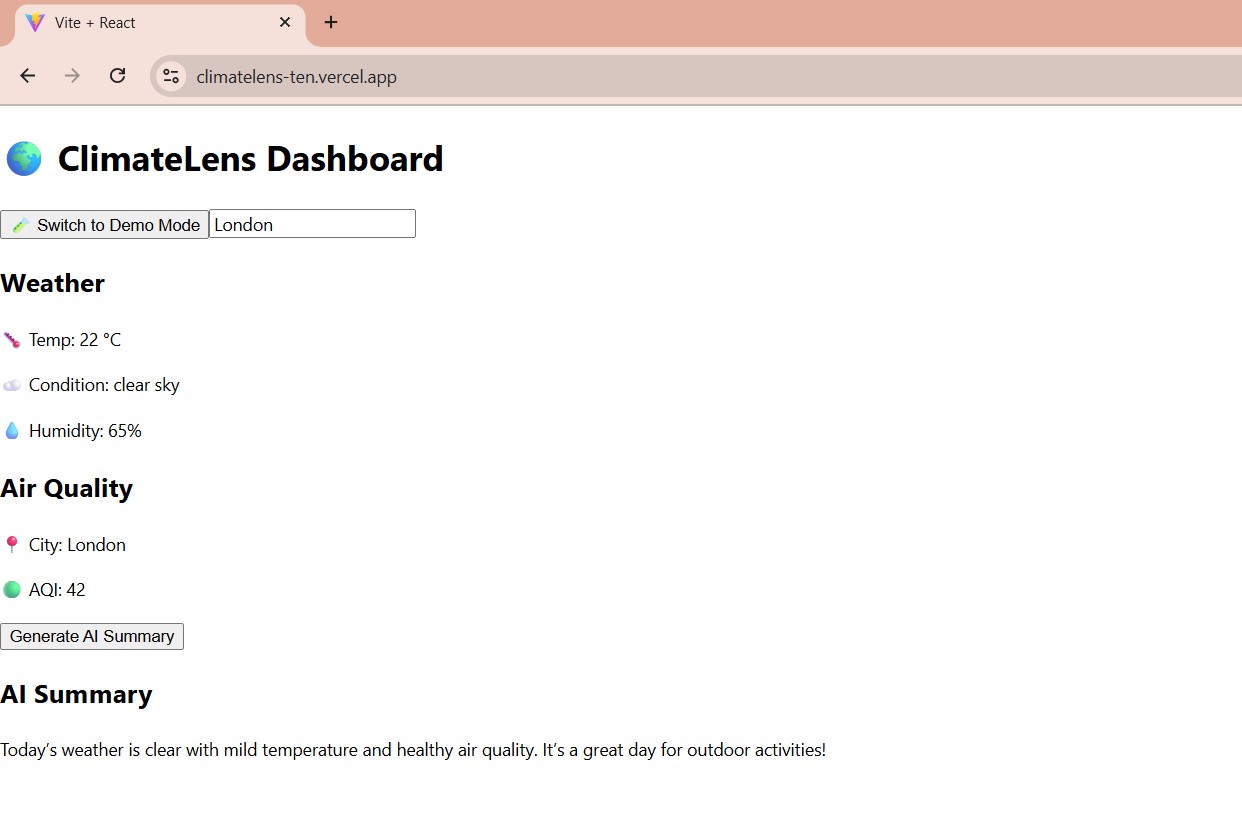
ClimateLens is an interactive dashboard that:
- Visualizes local weather, air quality, and pollution data.
- Provides AI-generated summaries of climate patterns in student-friendly language.
- Helps teachers bring climate awareness into the classroom through data-driven storytelling.
How we built it
Frontend: React + D3.js for interactive charts, Tailwind for responsive UI.
Backend: Node.js + Express to integrate multiple APIs.
Data Sources: OpenWeatherMap, Air Quality Index APIs, NASA climate datasets.
AI: GPT-powered text generation to simplify scientific insights.
Deployment: Hosted on Vercel with CI/CD pipeline for quick updates.
Challenges we ran into
- Sourcing reliable, real-time climate data that works globally.
- Making visualizations clear and engaging for different age groups.
- Translating complex science into simple, accurate insights with AI.
- Making visualizations clear and engaging for different age groups.
Accomplishments that we're proud of
- A working prototype that combines live climate data + AI insights.
- A design that teachers can easily integrate into lessons.
- Building a platform that makes students curious about their environment.
What we learned
- The power of visualization in education.
- How to balance technical accuracy with accessibility for younger audiences.
- Working as a team under hackathon time constraints.
What's next for ClimateLens: Interactive Dashboard for Schools
- Expand datasets (e.g., biodiversity, water usage, energy consumption).
- Add a teacher dashboard for lesson planning.
- Create a gamified student experience to encourage climate-positive behavior.
- Collaborate with schools to test and refine the tool.
Built With
- air
- api
- api)
- climate
- css
- d3.js
- datasets
- express.js
- gpt
- index
- nasa
- node.js
- openai
- openweathermap
- quality
- react
- tailwind
- vercel

Log in or sign up for Devpost to join the conversation.