-
-
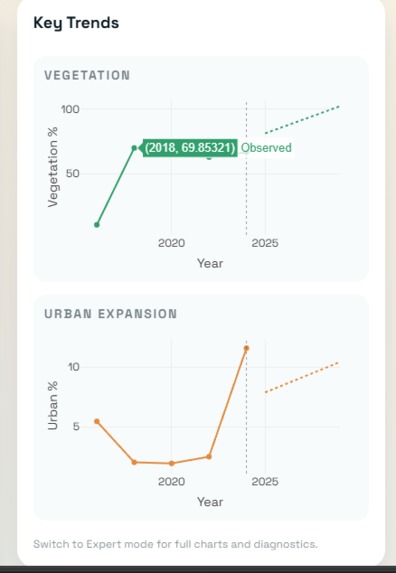
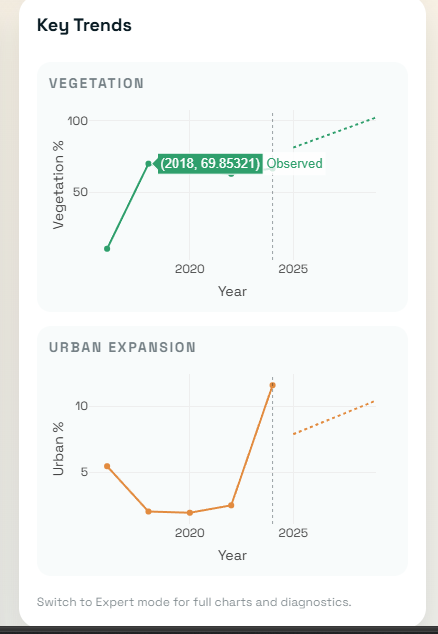
Key trends close-up
-
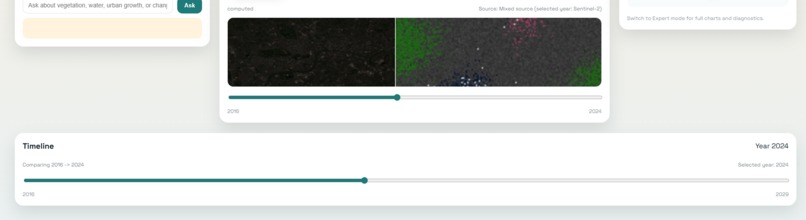
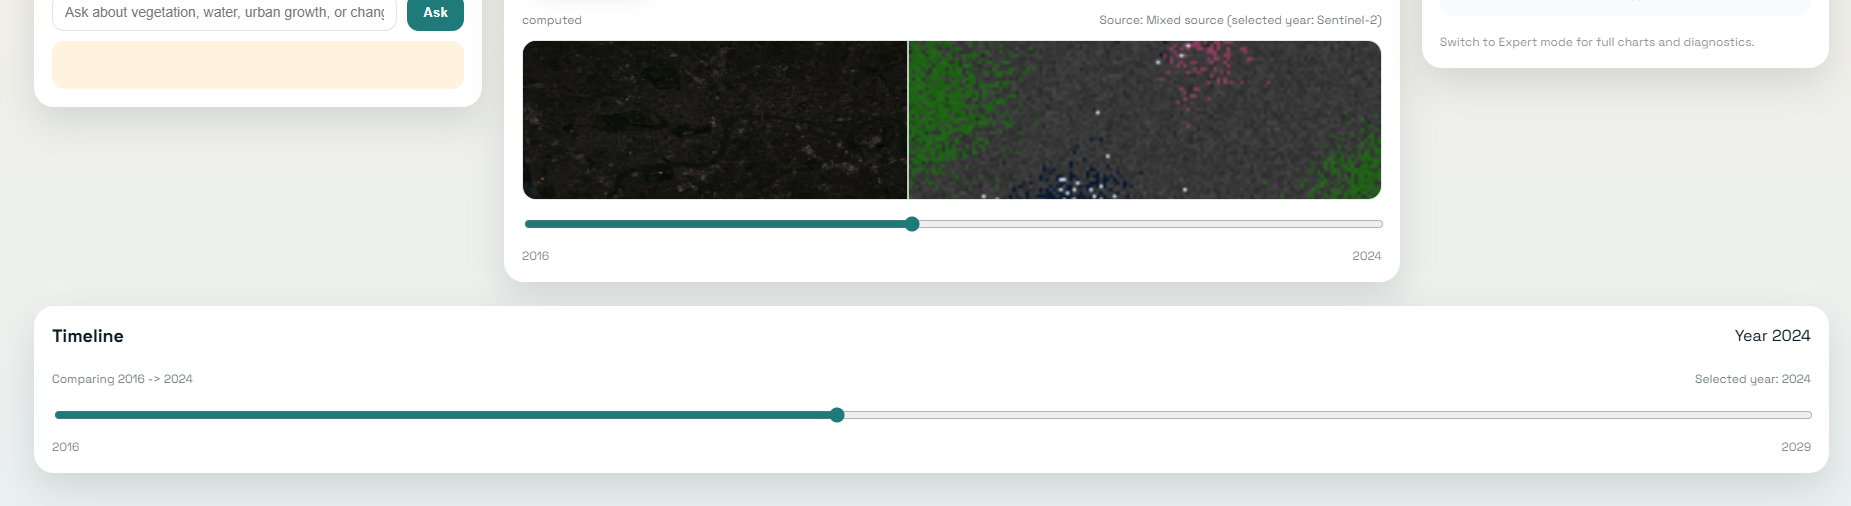
Timeline / comparison view
-
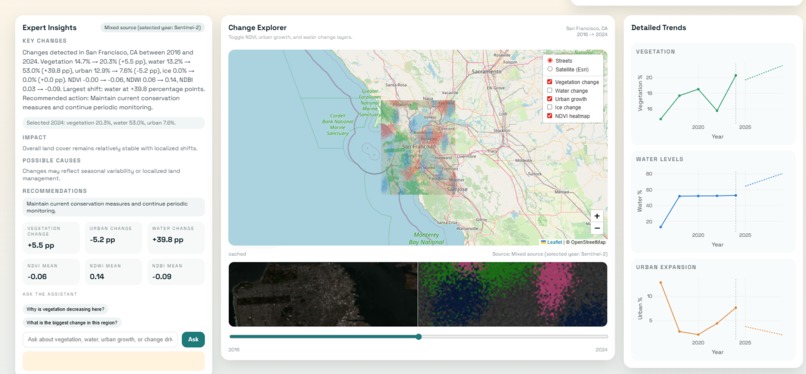
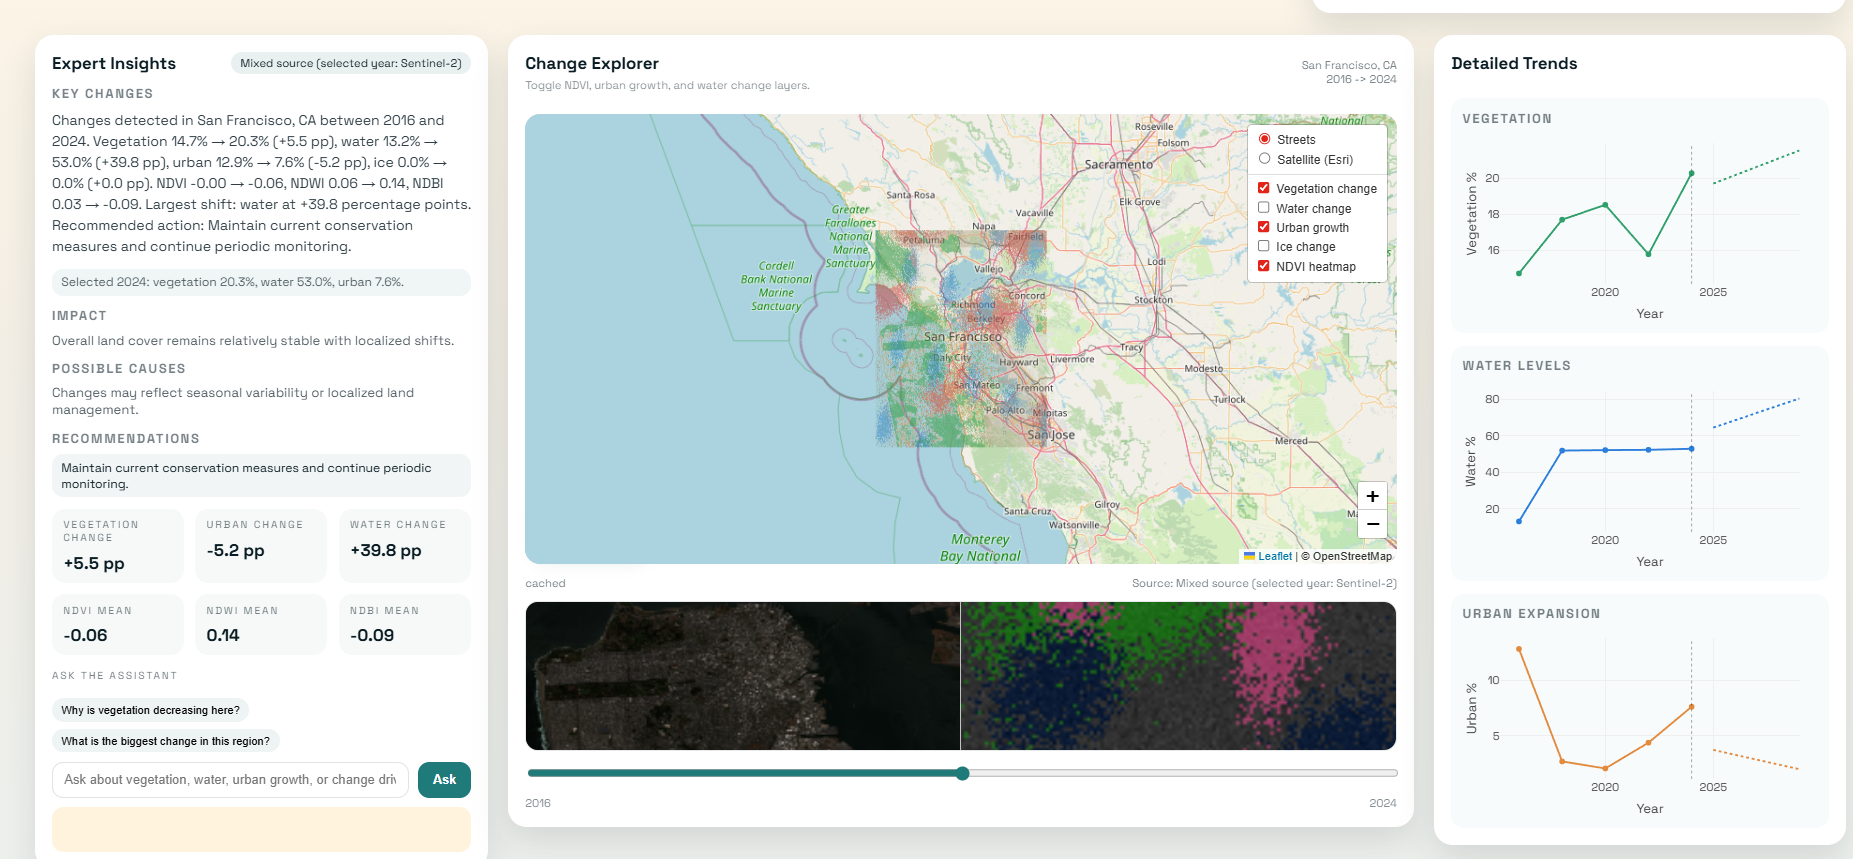
San Francisco Expert mode
-
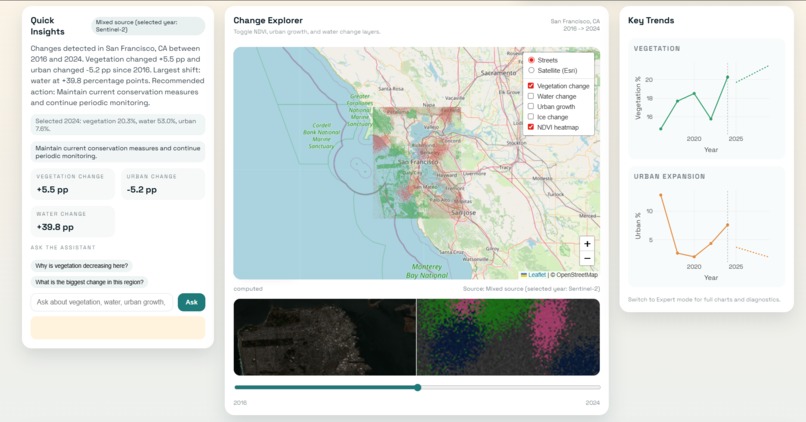
San Francisco Simple mode
-

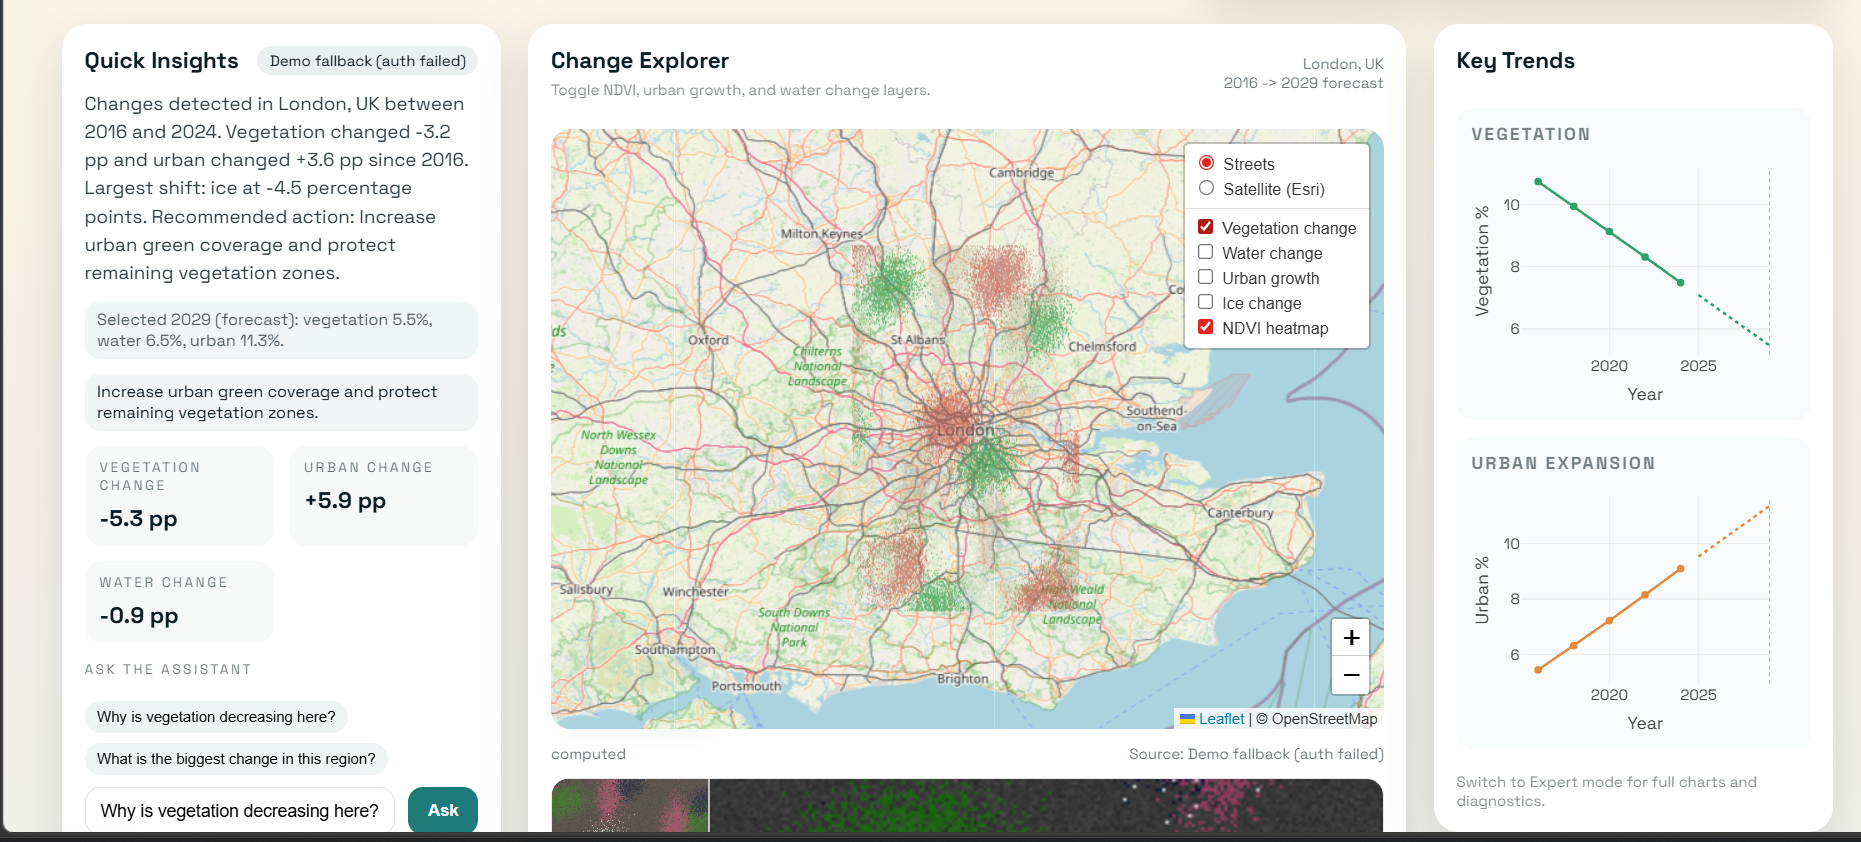
London dashboard

Inspiration
Climate change and environmental degradation are often discussed through statistics, reports, and news, but for most people these changes still feel abstract. I wanted to make environmental change visible and understandable by using satellite imagery and AI.
The main idea behind ClimateLens is simple: help people see how Earth is changing over time through an interface that is visually engaging, technically meaningful, and easy to understand. Instead of showing only raw satellite data, I wanted to combine geospatial analysis, interactive maps, visual trends, and AI-generated explanations so that both general users and more advanced users could explore environmental change in a practical way.
What it does
ClimateLens is an AI-powered satellite analysis platform that helps users explore environmental change across time. It analyzes satellite imagery and detects patterns such as:
- vegetation change
- water body change
- urban expansion
- ice or glacier change
The platform presents this analysis through:
- an interactive map with overlays
- heatmaps of detected change
- time-based charts
- AI-generated explanations and recommendations
- Simple Mode for general users
- Expert Mode for deeper analysis and metrics
Users can search for a location, compare multiple years, view environmental indicators, and ask the AI assistant questions such as:
"Why is vegetation decreasing here?"
When available, ClimateLens uses real Sentinel-2 imagery. If live imagery is unavailable for a location or year, the system falls back to a location-aware demo mode, allowing the analysis flow and UX to remain consistent.
How I built it
I built ClimateLens as a local prototype using a Python-based backend and an interactive frontend.
The backend was developed with FastAPI and handles location resolution, analysis requests, chart data, and AI explanations. The analysis pipeline processes satellite imagery using indices such as:
- NDVI for vegetation
- NDWI for water
- NDBI for built-up or urban areas
I also implemented:
- multi-year analysis
- environmental change detection
- heatmap generation
- a simple forecasting model for future trends
- caching and local fallback support
- Sentinel Hub integration for real Sentinel-2 imagery
- geocoding and location-aware analysis
For the interface, I used Leaflet for maps and Plotly for interactive data visualizations. The UI was designed to feel like a modern satellite intelligence dashboard, with map layers, environmental indicators, charts, timeline exploration, and before/after comparison tools.
To make the platform accessible, I added two usage modes:
- Simple Mode for users who want quick insights
- Expert Mode for users who want detailed metrics and deeper analysis
Challenges I ran into
One of the main challenges was balancing technical depth with usability. Satellite analysis can quickly become too technical, especially when working with environmental indices, multi-year comparisons, and layered geospatial data. I had to think carefully about how to present complex outputs in a way that still felt useful to non-expert users.
Another challenge was working with satellite data in a hackathon setting. Real satellite imagery can be large, computationally expensive, and sometimes unavailable for specific locations or time windows. To solve this, I designed the system to support both live Sentinel-2 integration and a location-aware fallback mode, so the user experience remains meaningful even when live data is incomplete.
I also spent a lot of time designing the relationship between the map, the charts, timeline exploration, and the AI assistant so the product felt unified rather than fragmented.
Accomplishments that I'm proud of
I'm proud that ClimateLens is not just a static dashboard, but an interactive system that connects:
- satellite imagery
- environmental indices
- change detection
- forecasting
- AI-generated explanations
- user-friendly visualization
I'm especially proud of:
- the Simple / Expert mode system
- the integration of live Sentinel-2 data with graceful fallback behavior
- the interactive map with overlays
- the before/after comparison experience
- turning raw environmental analysis into human-readable insights
What I learned
Through this project, I learned a lot about:
- geospatial data analysis
- working with satellite imagery
- environmental indices like NDVI, NDWI, and NDBI
- integrating live data pipelines with fallback strategies
- building AI-assisted explanations on top of technical results
- designing interfaces for both beginners and advanced users
I also learned that a strong technical project needs more than just analysis — it needs a clear user experience, clear communication, and resilience when real-world data pipelines fail or become incomplete.
What's next for ClimateLens
Next, I want to improve ClimateLens by:
- supporting custom date ranges and more locations
- improving forecasting accuracy with stronger models
- making the AI assistant more context-aware
- improving scene selection and cloud filtering
- expanding the platform into a more complete environmental monitoring tool
Built With
- fastapi
- html
- javascript
- leaflet.js
- numpy
- pandas
- plotly
- python
- rasterio
- react
- sentinel-hub

Log in or sign up for Devpost to join the conversation.