Inspiration
ClimateiQ was inspired by the need to turn complex climate-model output into something people can actually use in planning and policy. The repository describes it as an “environment friendly app for policy makers and practitioners,” and it is a decision-support system that translates regional climate model outputs into actionable, sector-focused guidance. The project is also explicitly framed around uncertainty transparency and decision relevance, which suggests the motivation was not just prediction, but usable adaptation support.
What it does
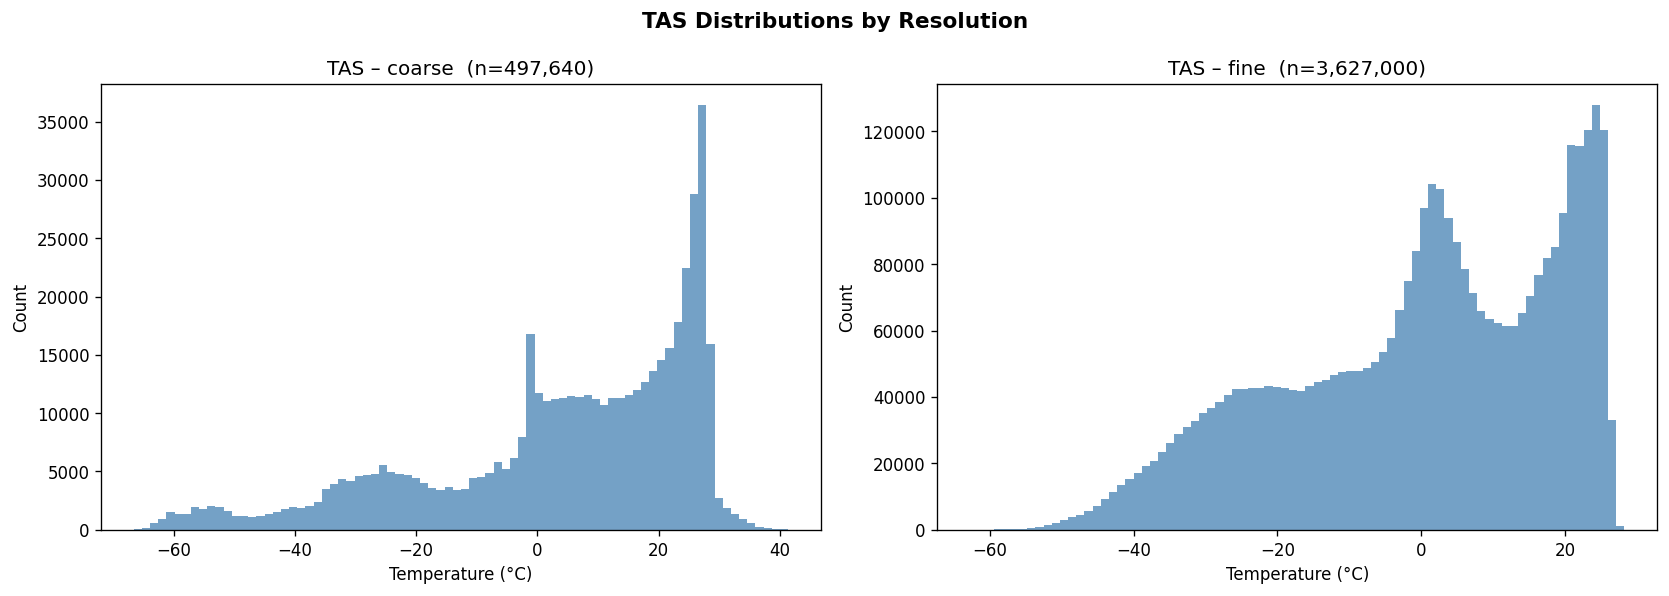
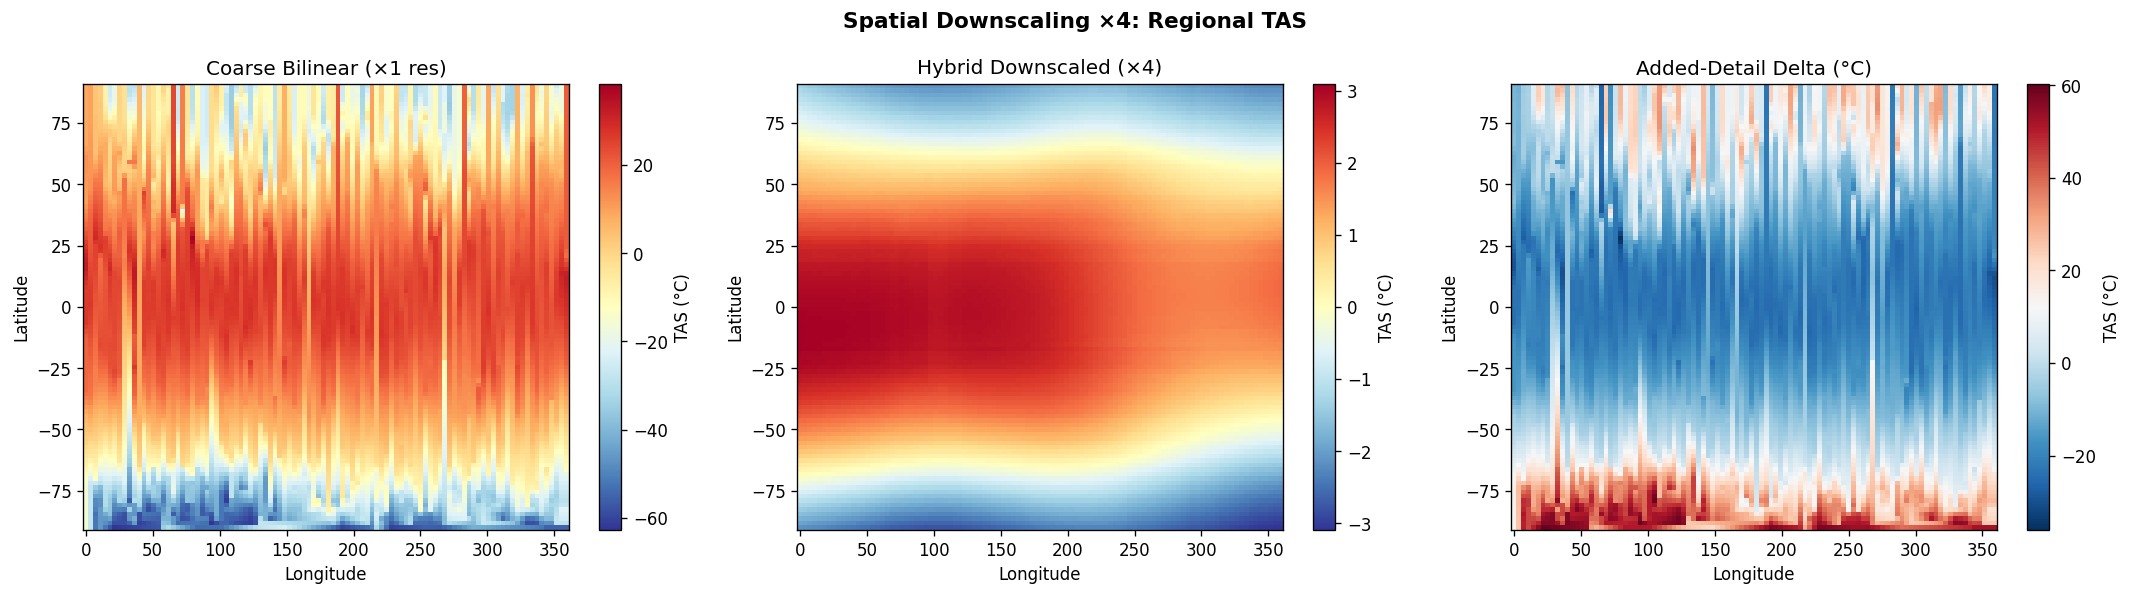
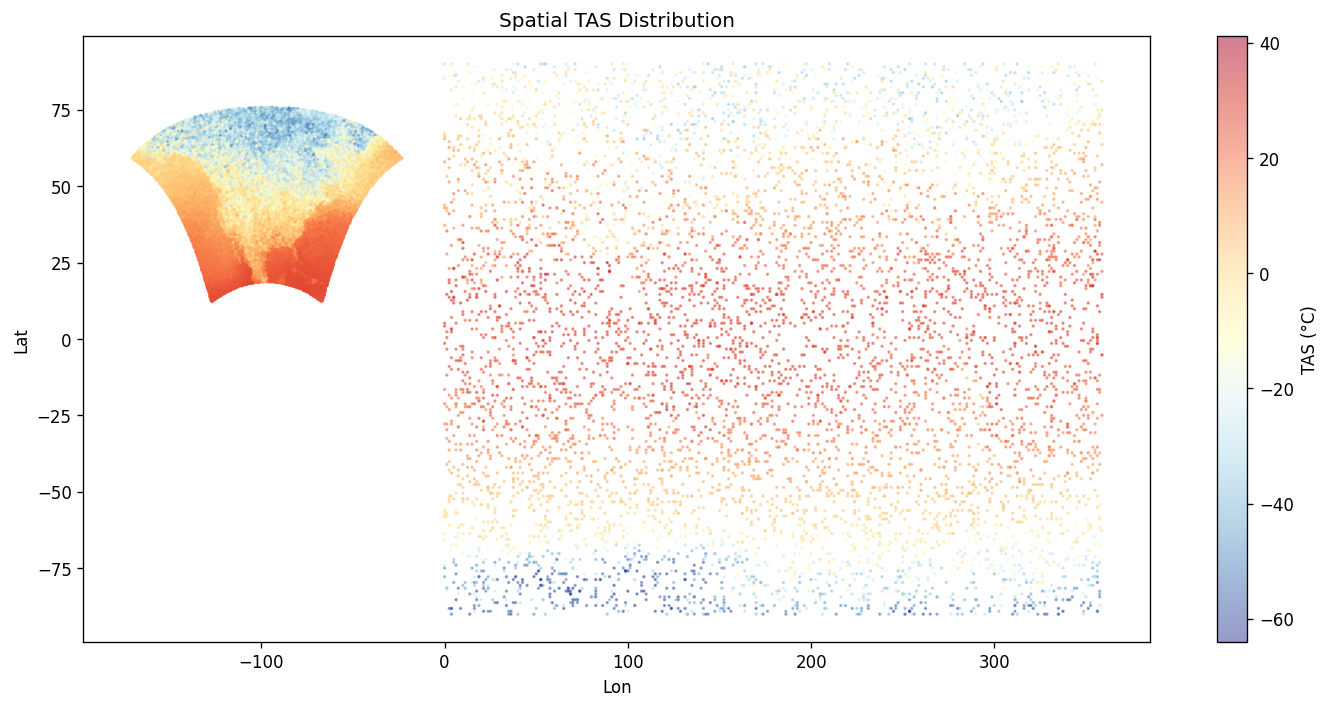
ClimateiQ ingests NA-CORDEX forcing data and ERA5 reanalysis data, then produces downscaled climate projections at about 25 km resolution. Then it algorithmically combines a CNN for spatial pattern recognition with an LSTM for temporal sequencing, and that it generates ensemble projections across five SSP scenarios for 2025–2100. It also presents both a mobile app and a web dashboard, with the mobile side aimed at rapid, offline-capable triage and live point-based inference, while the web dashboard supports multi-scenario analysis, diagnostics, and exportable outputs. The project also includes analytical outputs such as spatial maps for temperature anomaly, precipitation, heat index, and PDSI; a six-sector vulnerability scoreboard covering agriculture, water, urban heat/public health, infrastructure, energy, and ecosystems; milestone tables for threshold-crossing years; and an alerts feed for threshold exceedances. It is also designed to support practitioner workflows like site assessments and reservoir yield modeling, as well as policymaker workflows like adaptation planning and cross-sector coordination.
How we built it
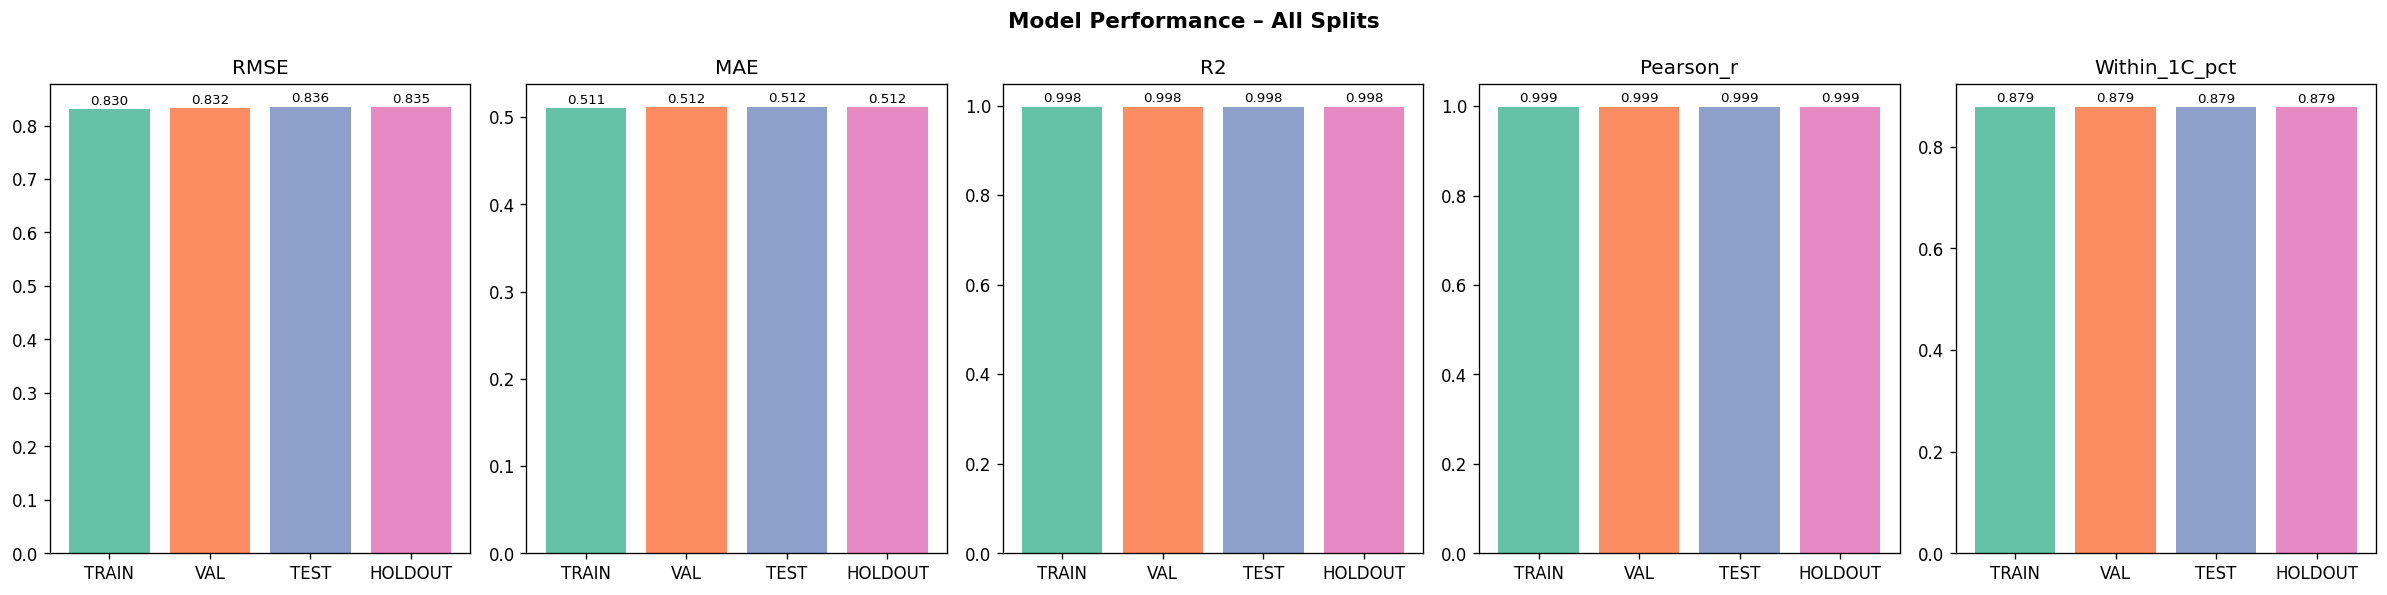
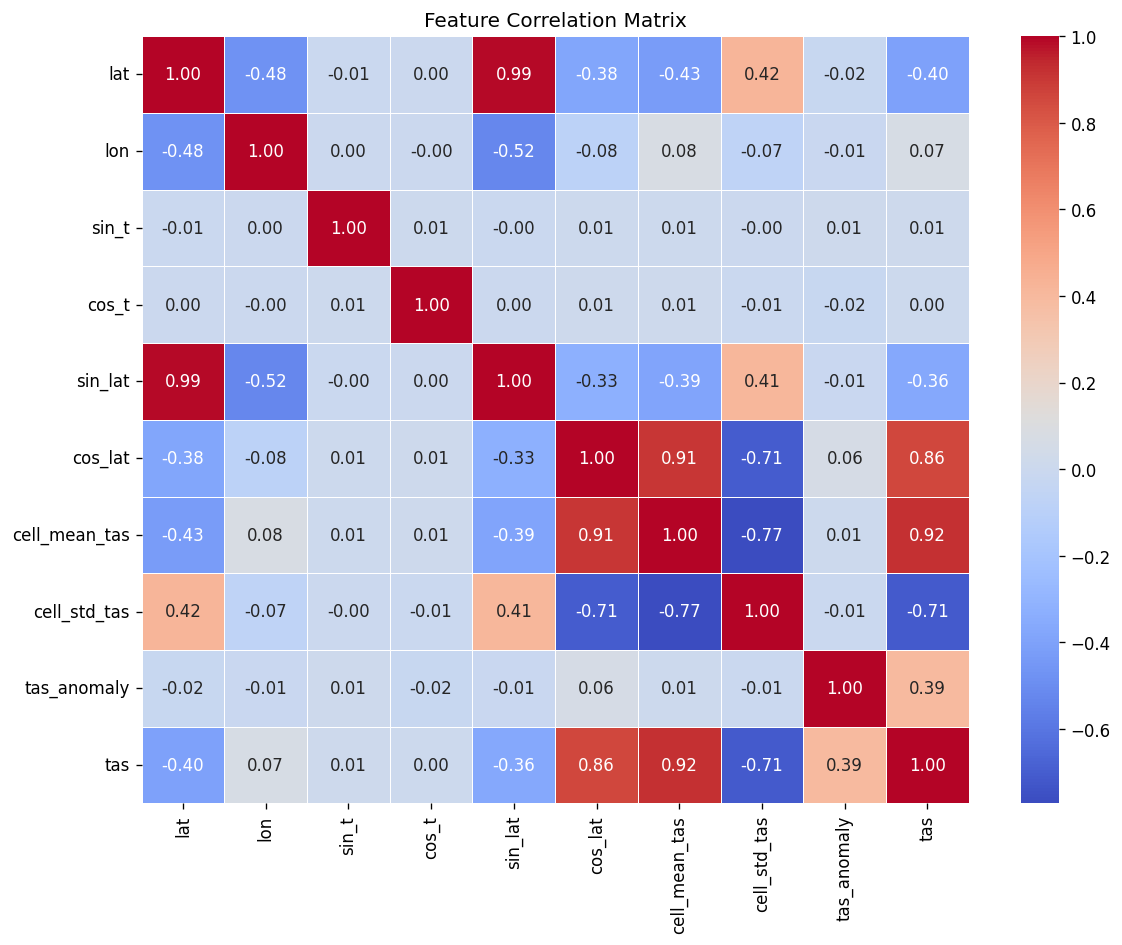
From the Github source tree, the project is organized as a modular pipeline in src/, with separate scripts for configuration/imports, GraphCast loading, NetCDF file discovery, chunked NetCDF loading, preprocessing, feature engineering, train/test/val/holdout splitting and scaling, the neural network model, training, evaluation, a downscaling demo, and the main pipeline orchestrator. That structure shows a clear separation between data ingestion, model definition, training, evaluation, and presentation. The data path begins by discovering .nc files recursively, then loading them, filtering them, and engineering geographic features. The discovery function simply gathers NetCDF files recursively, preprocessing drops missing tas values and filters unrealistic temperature ranges, and feature engineering adds sine/cosine encodings for latitude and longitude. For modeling, the repo defines a DownscaleNet PyTorch network with fully connected layers of 256 and 128 hidden units before a single output node, trained with Adam and MSE loss. The training loop converts inputs to tensors, runs epoch-wise optimization, and prints RMSE during training; the evaluation module computes RMSE, MAE, R², and Pearson correlation. The split/scaling utility uses a 70/30 split and standardization on the training features. The repo also includes a GraphCast loader that downloads the google-deepmind/graphcast repository from Hugging Face and extracts a 2D matrix from .npz files, which suggests the project is drawing on GraphCast-related assets as part of its climate-data workflow. The model_results and graphical_plots folders store the generated analysis images and plots used to communicate model behavior and performance.
Challenges we ran into
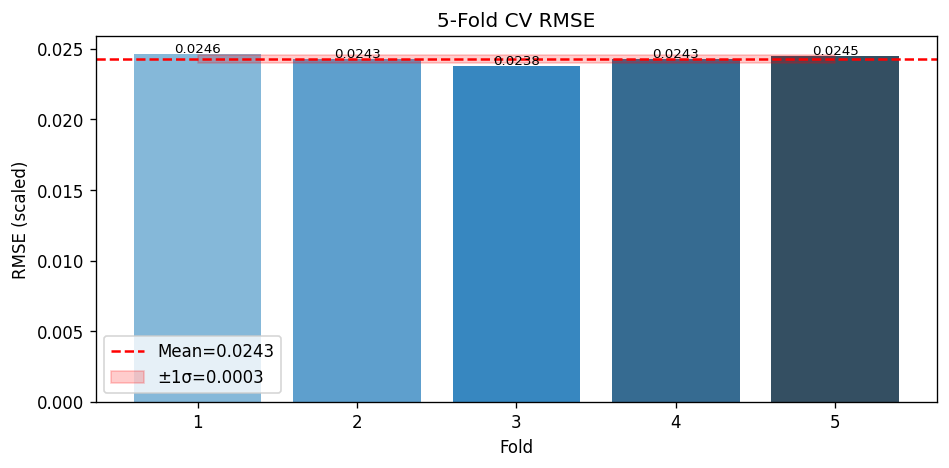
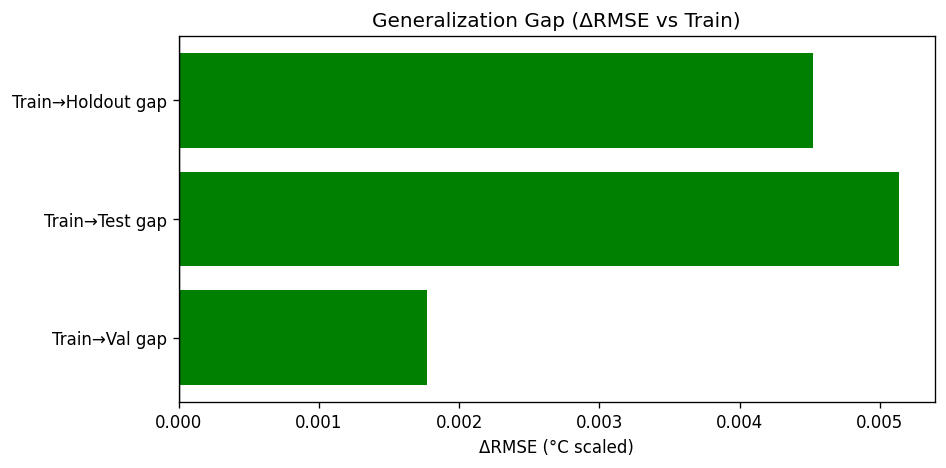
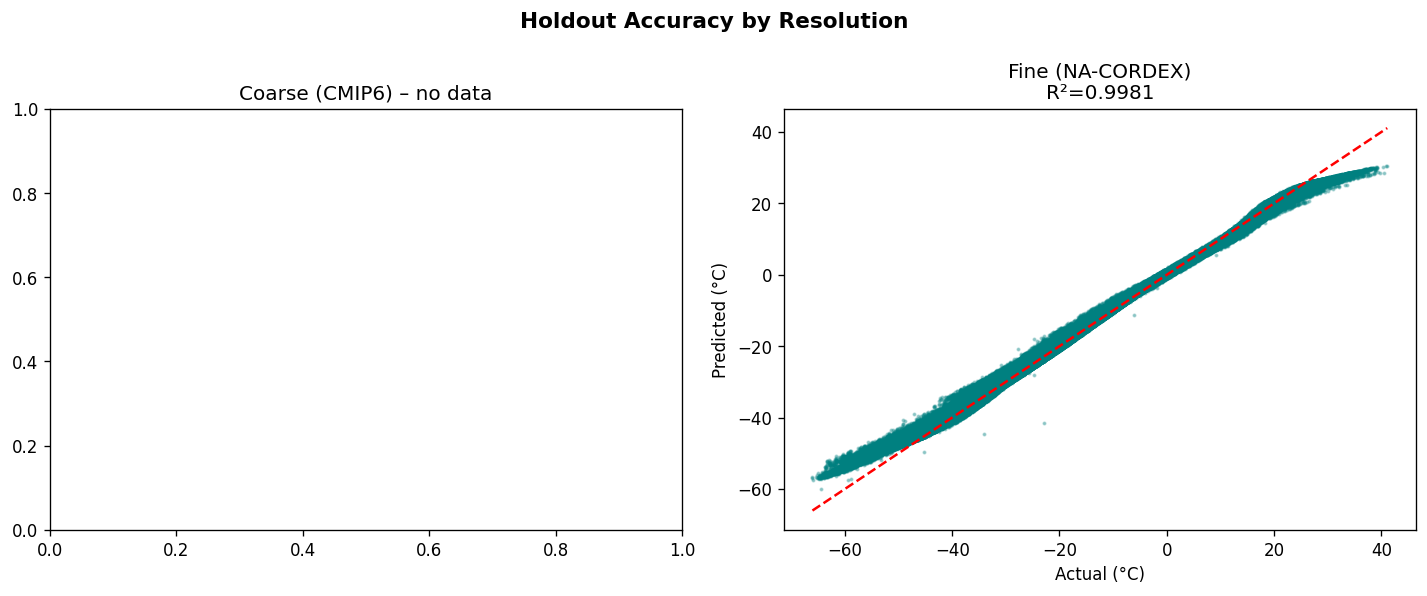
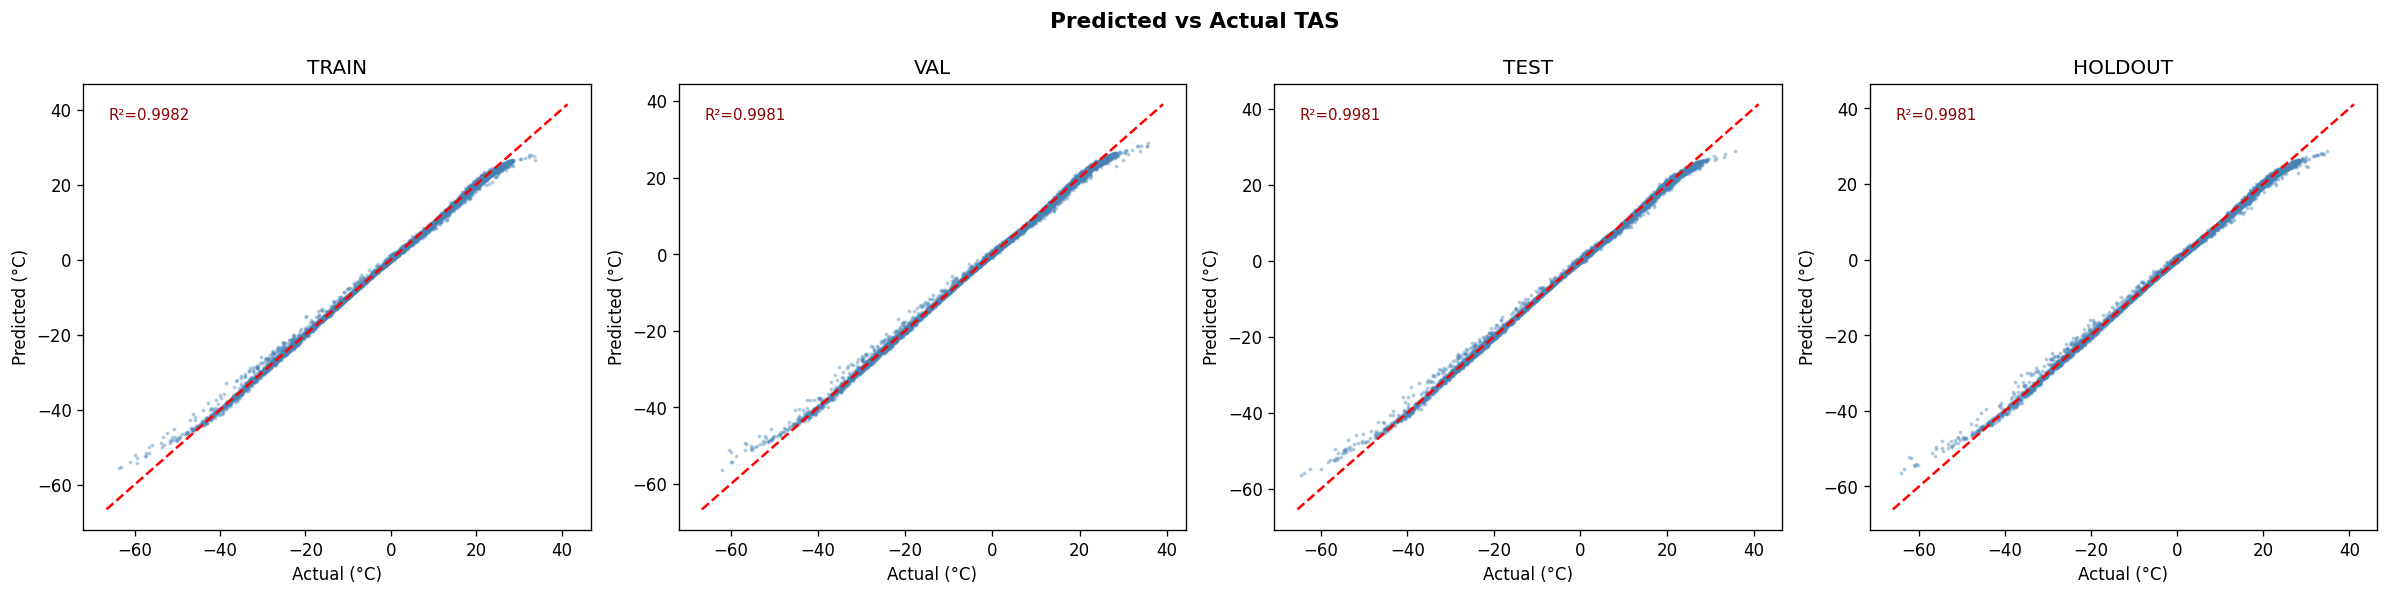
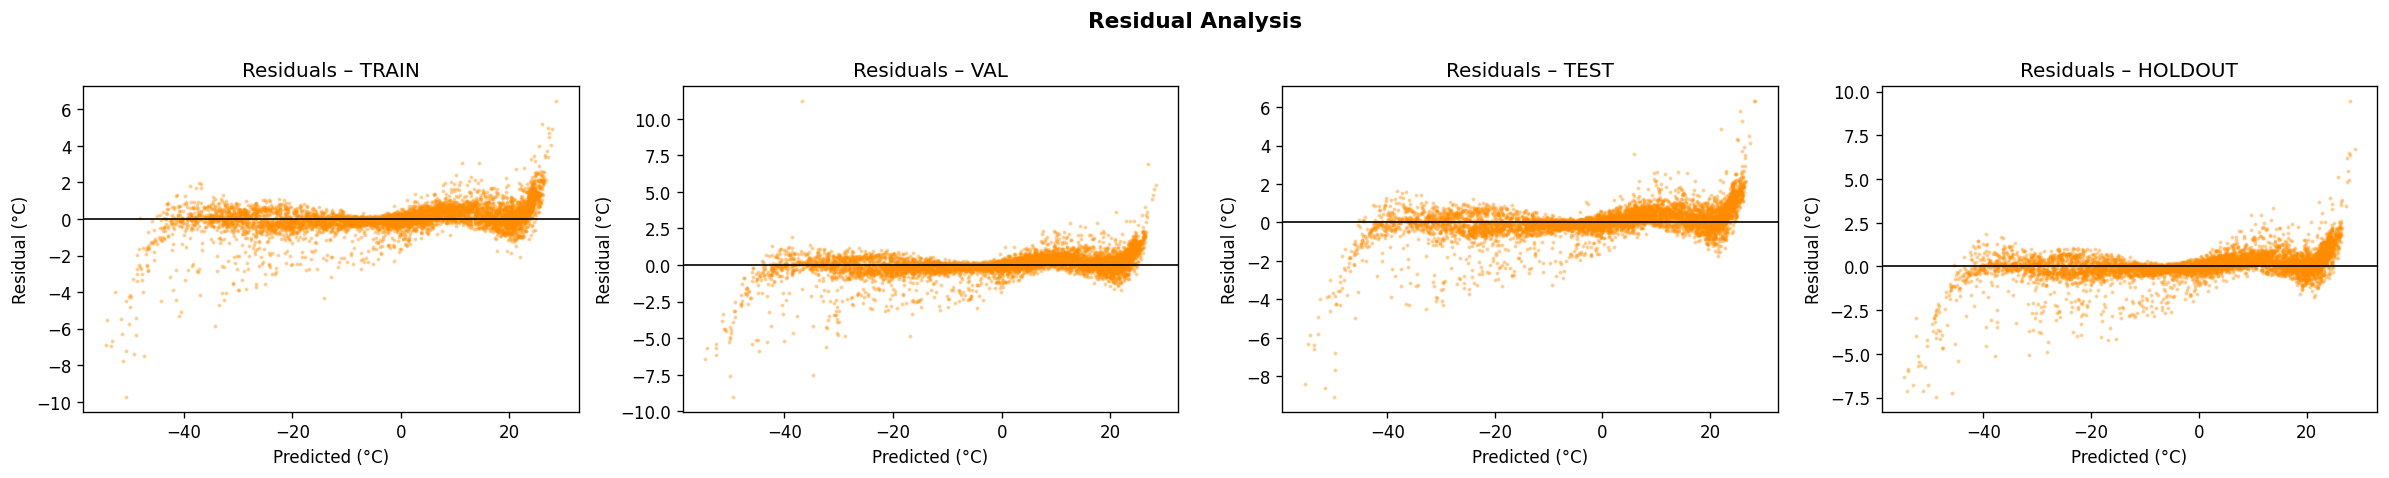
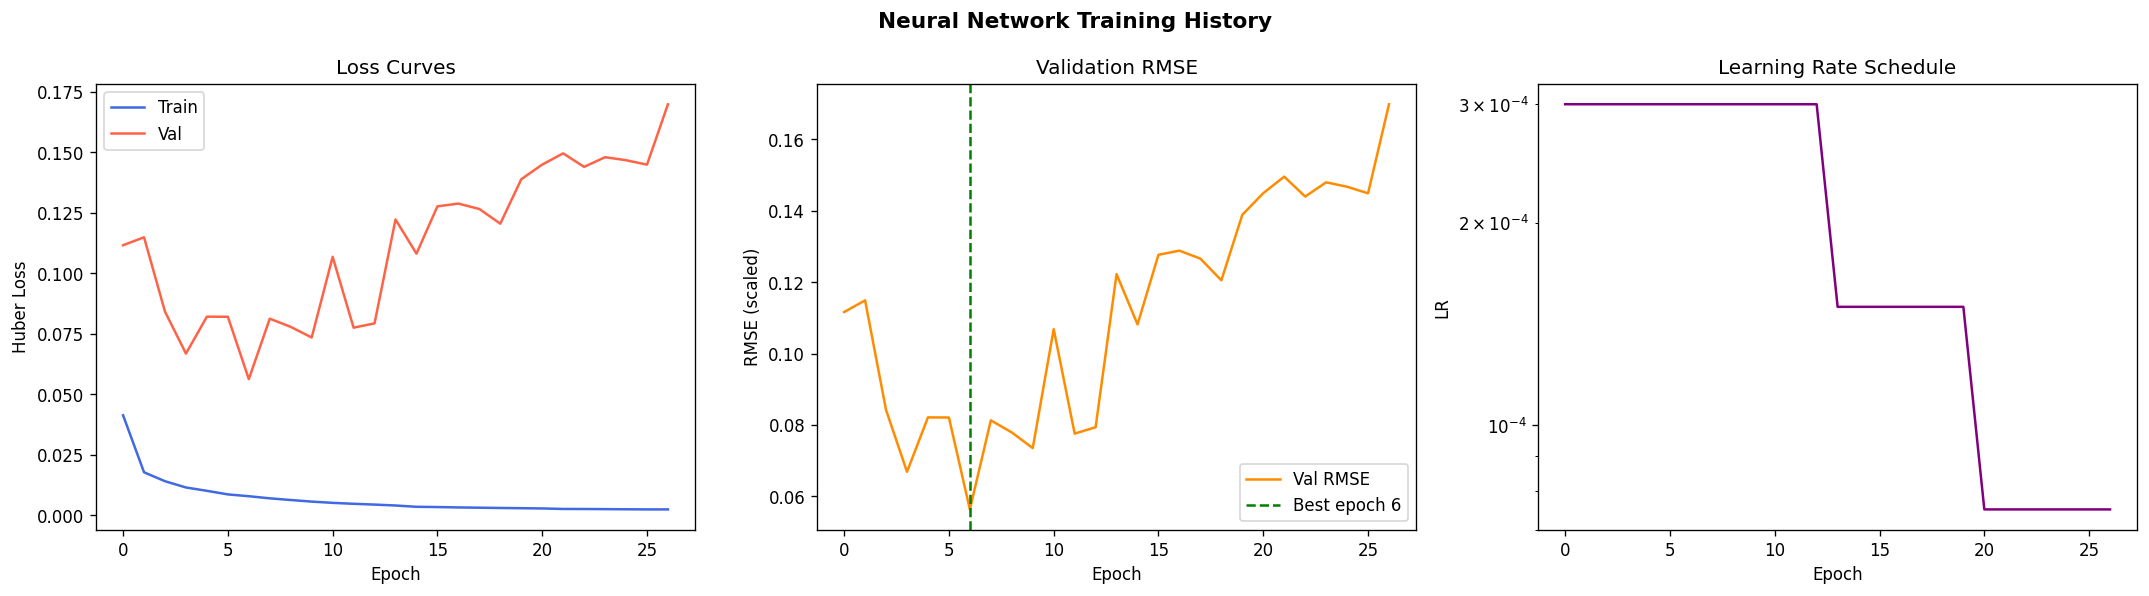
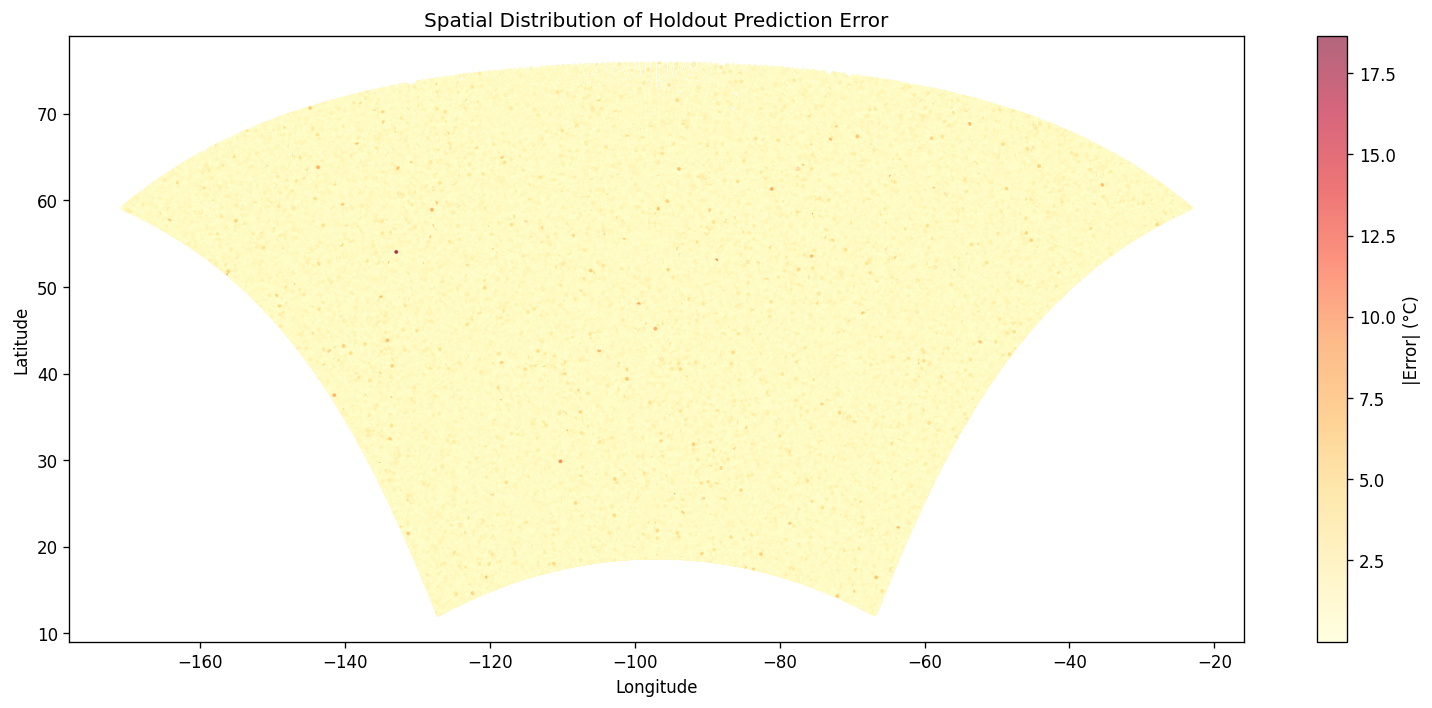
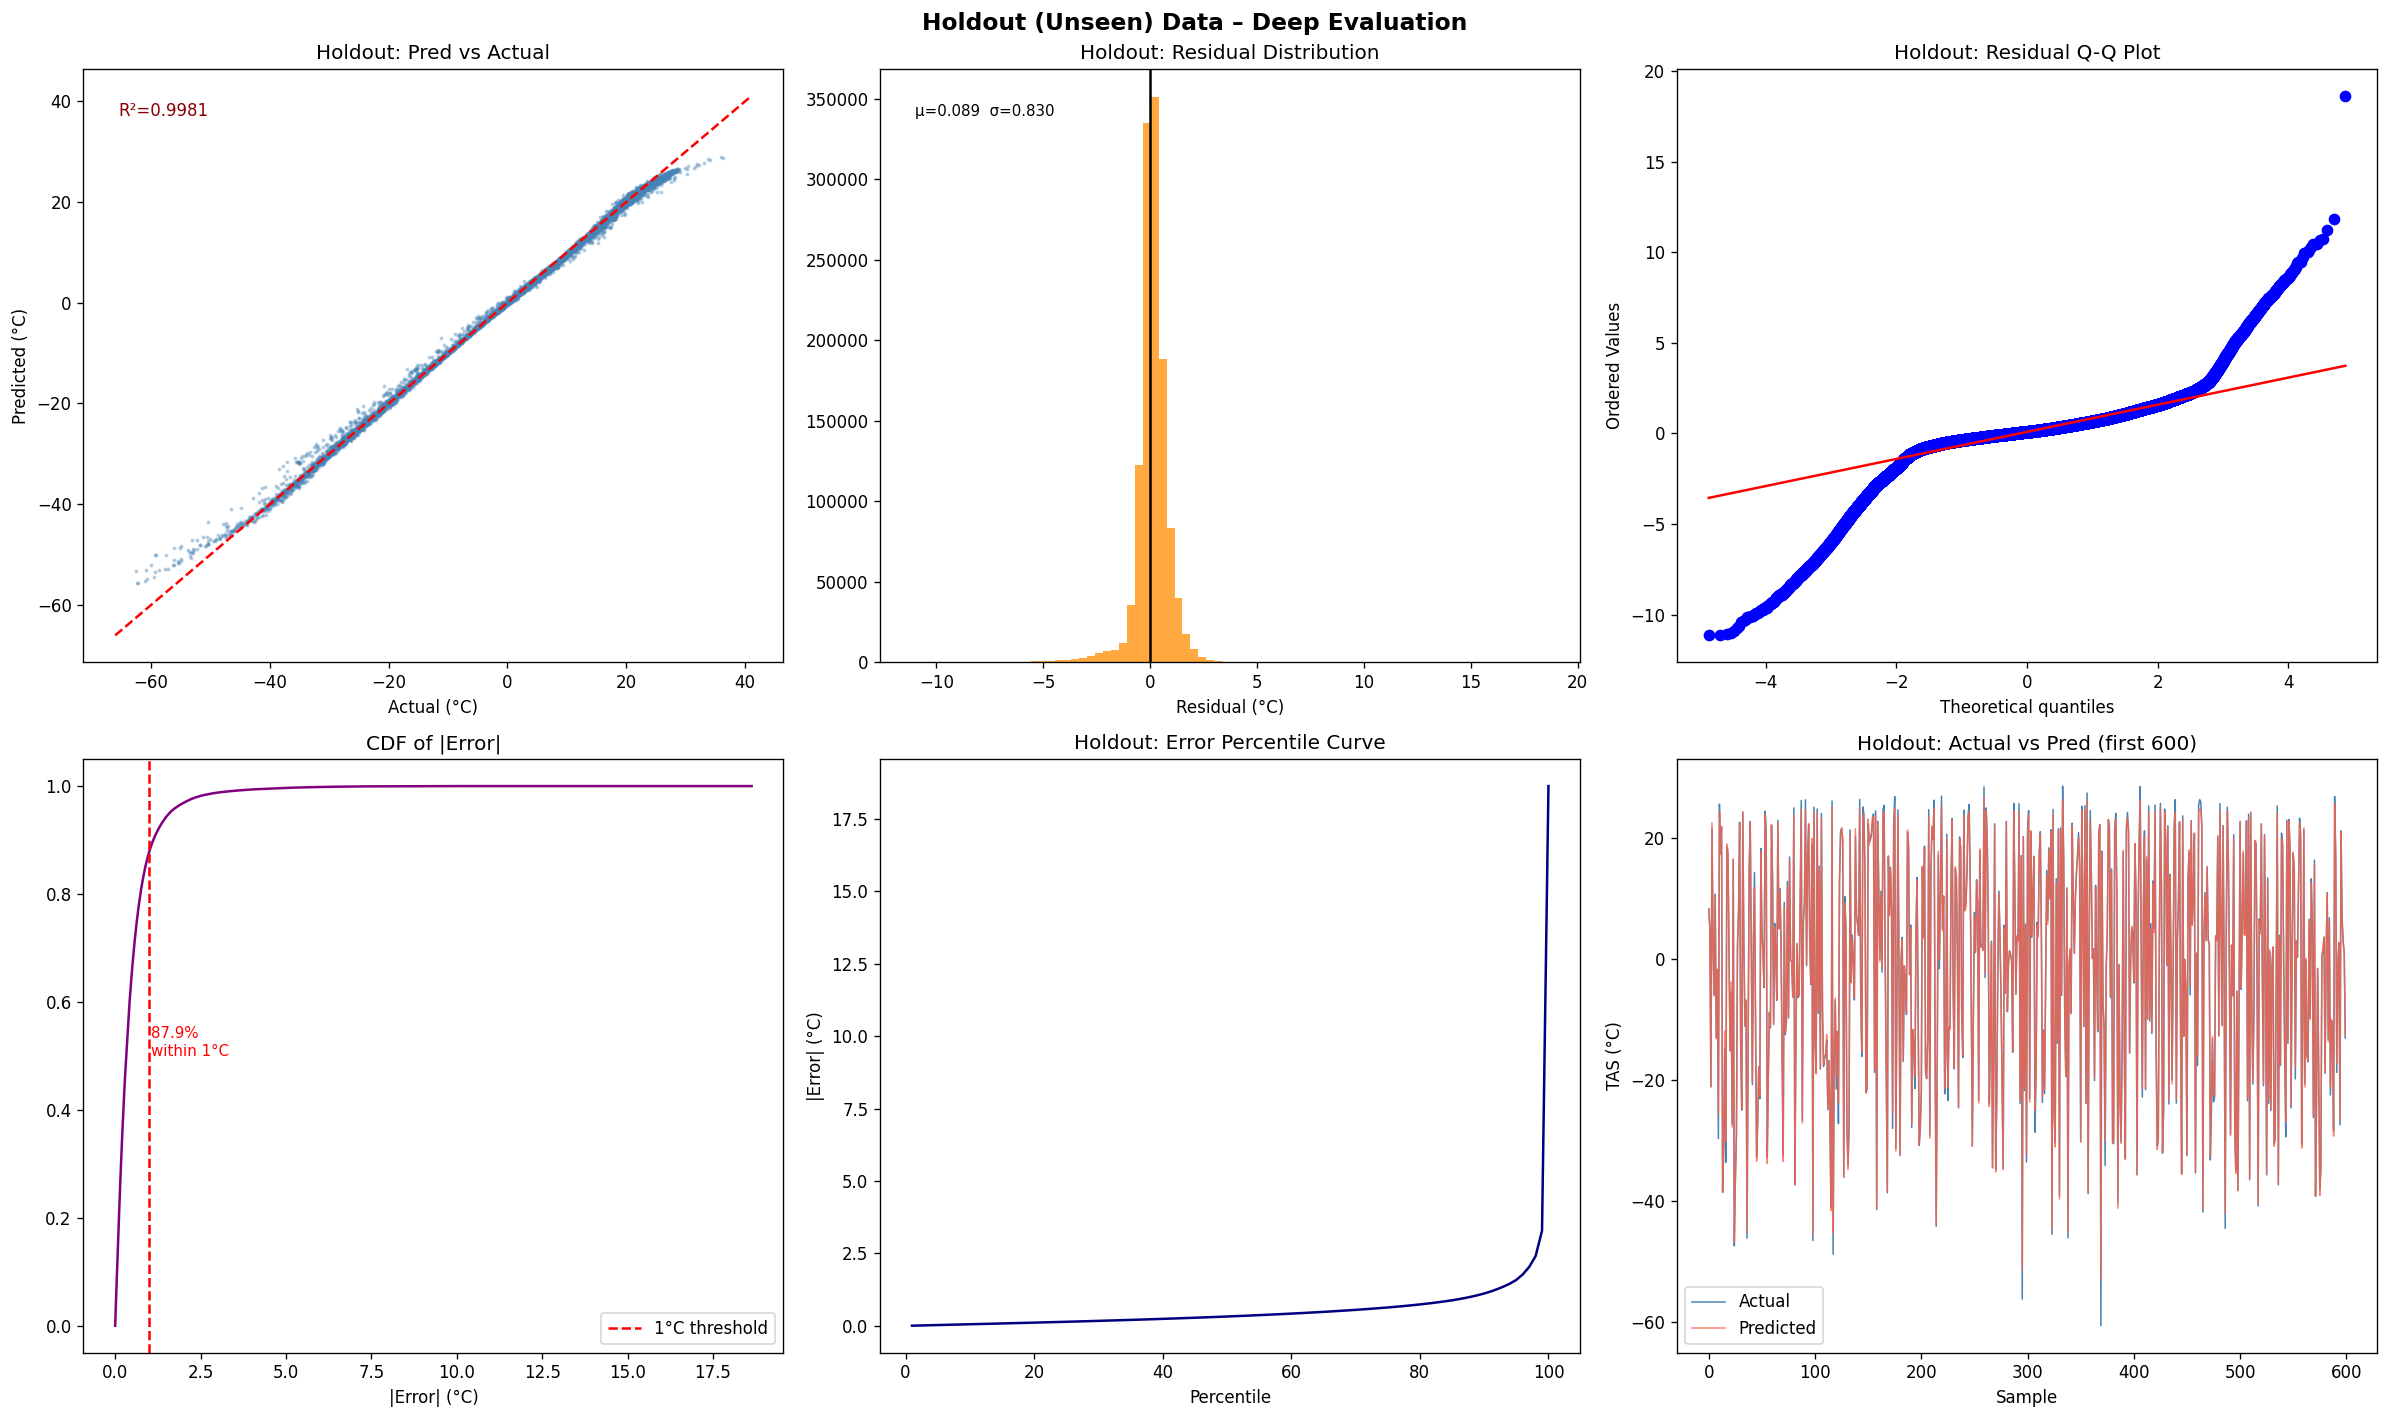
The Github README is candid about the constraints. It says the 25 km grid cannot resolve sub-urban microclimates, some hazard indices are not fully covered, and residual model bias remains and should be reported. That means one challenge was balancing practical downscaling with the unavoidable limits of spatial resolution and variable availability. Another challenge implied by the repository design is making the pipeline reliable across large climate datasets. The presence of chunked loading, preprocessing, scaling, and explicit evaluation plots suggests the team had to manage data volume, standardization, and model validation carefully rather than treating the problem as a simple forecasting task. The documented holdout evaluation and cross-validation artifacts reinforce that validation was a central concern. Accomplishments that we’re proud of A major accomplishment is that the project does not stop at raw prediction. It converts climate data into a decision-support product with mobile and web delivery, scenario comparison, uncertainty visibility, sector-level scoring, and threshold alerts. That is a much stronger product story than a standalone model notebook. The repository also shows strong empirical reporting. It highlights model diagnostics such as R², RMSE, and cross-validation folds, and the model_results directory includes training-history, prediction-vs-actual, residual, generalization-gap, metrics-summary, holdout, cross-validation, spatial-error, and resolution-accuracy plots. Those assets indicate the team invested in both model performance and explainability.
What we learned
This project has taught the value of combining statistical or deep-learning downscaling with operational presentation. The code shows that even a compact pipeline can become useful when the data flow is disciplined: discover files, preprocess, engineer geographic features, split, scale, train, and evaluate. The README then takes the extra step of translating the outputs into sectoral and policy-facing language, which is exactly what makes climate AI usable in practice. The team learned to be explicit about uncertainty and limits. Rather than overselling the model, the README states where resolution breaks down and where bias remains. That is an important lesson in climate-tech work: usefulness comes from trustworthy boundaries, not just accuracy numbers. What’s next for ClimateiQ an Environment Friendly App The most natural next step is to push from prototype toward a broader operational system. Based on the repository, that would likely mean expanding hazard coverage, improving sub-regional resolution, strengthening calibration and bias correction, and deepening the dashboard’s ability to support real deployment in planning workflows. The README already hints at this direction by emphasizing practitioner and policymaker use cases, exportable products, and explicit uncertainty handling. A second next step would be product hardening: more robust ingestion of climate datasets, richer validation on unseen regions, stronger documentation, and deployment-ready mobile/web integration. The repo already has the bones of a pipeline and reporting layer; the next phase is making it easier to maintain, reproduce, and scale.
Data Layer Expansion: Global to Regional Adaptation
To scale ClimateiQ globally, the data layer has to move beyond a North America–centric setup. The current pipeline relies heavily on NA-CORDEX and ERA5, which is useful for a prototype, but expansion across continents requires a more region-aware data strategy. For Africa, the system will incorporate AFR-CORDEX domains such as AFR-44 and AFR-22; for Europe, EUR-11; and for Asia, domains such as WAS-44 and EAS-22. ERA5 should remain in the stack as a global baseline because it provides a consistent reanalysis reference across all regions. In Africa especially, the model will also ingest satellite-derived datasets such as CHIRPS for precipitation and MODIS products for land surface temperature and vegetation indices, since ground-station coverage is often sparse. This expansion requires more than just adding new files to the pipeline. The data ingestion layer, including the NetCDF discovery and loading components, should be refactored to support multiple regional dataset schemas, variable naming differences across CORDEX domains, and inconsistent metadata conventions. A more flexible ingestion system would allow ClimateiQ to accept different geospatial and temporal formats without requiring major manual rewrites for each continent. That makes the platform more portable and significantly easier to extend. Africa presents a specific challenge because station density is low in many places, which means the model cannot depend too heavily on dense supervised labels. To handle this, ClimateiQ will be designed to work well with sparse supervision. Techniques such as kriging, inverse distance weighting, transfer learning, and hybrid physics-plus-ML bias correction can help the model remain robust even where observations are incomplete. This is especially important for climate applications where the quality of the prediction is often constrained by the quality and availability of the input data.
2. Model Generalization Strategy
The current DownscaleNet architecture is suitable as a lightweight prototype, but a global climate system needs a more generalizable modeling strategy. A region-aware model is essential because climate patterns vary dramatically from continent to continent. One practical improvement is to introduce region embeddings or climate-regime features so the model can distinguish between Africa, Europe, Asia, and other geographies. This prevents the system from incorrectly applying North American climate assumptions to regions like the Sahel or the Horn of Africa, where the drivers of rainfall, heat, and seasonality are very different. The architecture itself should also evolve. Since the project already points toward CNN and LSTM ideas, the next step would be to strengthen the spatiotemporal learning stack and eventually consider more advanced approaches such as spatiotemporal transformers or graph-based models. That direction aligns well with the GraphCast-inspired parts of the repository. Africa’s climate variability depends on interacting large-scale and local processes, including monsoon systems, ENSO teleconnections, and strong regional feedback loops, so the model needs to capture both spatial structure and time-dependent behavior. Scenario handling also needs to be standardized across continents. If ClimateiQ is going to compare projections globally, SSP1 through SSP5 must remain consistent across all datasets, with normalized units and baseline periods. Without that, cross-continent outputs would not be comparable, which would weaken the decision-making value of the platform.
3. Geographic Feature Engineering: Especially Important for Africa
The current pipeline already uses basic geographic encodings such as sine and cosine transformations of latitude and longitude, which helps the model learn spatial relationships. For Africa expansion, those features should be expanded significantly. Elevation becomes especially important in East Africa, where highlands strongly affect local climate. Distance to coast should also be included because maritime influence shapes rainfall and temperature patterns, particularly in West Africa. Vegetation indices can help the model distinguish between more arid zones such as the Sahel and wetter tropical regions such as the Congo Basin, while soil moisture proxies can improve realism in drought-prone systems. These additions matter because climate impact is not only a function of atmospheric forcing. Terrain, land cover, proximity to oceans, and water availability all shape how climate signals translate into lived experience. Better geographic features make the model more physically grounded and improve its usefulness for local applications.
4. Sector Adaptation: Localizing the Impact Models
ClimateiQ’s six-sector vulnerability scoreboard is a strong concept, but it should be recalibrated for each region rather than applied uniformly everywhere. In Africa, agriculture should receive especially high priority because many communities depend on rain-fed farming and are highly sensitive to rainfall timing and heat stress. Water stress is another critical category, particularly in the Sahel and the Horn of Africa, where rainfall variability can produce serious seasonal shortages. Heat stress also deserves greater emphasis because it affects both urban and rural productivity. Energy analysis should be tailored to regional realities, including the variability of hydropower systems in some countries. The scoring logic should not rely on generic global thresholds. Different regions experience and respond to heat, drought, and rainfall anomalies in different ways, so the thresholds need to be local. A temperature extreme that is manageable in one country may be highly disruptive in another. This is why the vulnerability layer must be region-specific if the app is to be credible and truly useful.
5. Policy and Decision Layer Localization
The policy layer is where many climate applications fail when they try to scale globally. To be useful in Africa, ClimateiQ has to align its outputs with local and regional planning frameworks, including National Adaptation Plans and African Union climate strategies. This makes the application more than a visualization tool; it becomes a policy-support instrument that speaks the language of the institutions using it. The output formatting should also change. Instead of showing only abstract climate variables such as “temperature anomaly +2°C,” the app should translate those variables into impact-oriented metrics. For example, it should communicate things like maize yield risk increases, changes in the number of days above critical heat thresholds, or likely water-stress escalation. That kind of translation is essential for adoption because decision-makers and practitioners need actionable information, not only meteorological indicators.
6. Infrastructure and Deployment Constraints in Africa
Deployment in Africa requires special attention to connectivity and hardware limitations. The mobile app’s offline capability is a major advantage and should be strengthened further. On-device inference should be supported through model quantization and lightweight deployment formats, allowing the app to function even on modest devices. A model under a practical size threshold, such as 50 MB, would be much easier to distribute and maintain in low-resource settings. Batch synchronization can then be used when connectivity becomes available again. Edge deployment also matters. Rather than relying only on centralized cloud infrastructure, ClimateiQ could be deployed through NGOs, government agencies, agricultural extension workers, and local partner institutions. This kind of distributed deployment model is much better suited to regions where internet access is intermittent and where local intermediaries are often the main bridge to end users.
7. Validation and Ground Truthing
A global climate platform cannot rely only on internal metrics such as RMSE or R². For Africa expansion, validation should include local ground truthing through partnerships with meteorological agencies, universities, and domain experts. Historical droughts, floods, and heat events should be used to test whether the model captures real-world climate impacts accurately. Field surveys can also provide useful confirmation where formal station data is incomplete. This matters because climate models can look statistically strong while still missing the realities that matter to users. Validation must therefore include both quantitative evaluation and contextual verification. That combination creates trust and makes the outputs more defensible in policy and operational settings.
8. UI and UX Localization
As ClimateiQ expands, the user interface should also become more localized. Language support should include at least English, French, Arabic, and Swahili to cover a broad set of users across Africa. The system should also be tailored to different user personas, including policymakers, farmers, NGOs, and technical analysts. Each group needs different levels of detail and different kinds of visual presentation. The dashboard should be simplified for non-technical users. Technical jargon should be reduced, and visual risk indicators such as color-coded maps, thresholds, and simple summaries should be emphasized. That kind of design makes the app easier to understand and more likely to be used consistently by people who are not climate scientists.
9. Scaling Architecture: A Multi-Continent System
At a systems level, ClimateiQ should be refactored into a modular multi-continent architecture. The data layer should be implemented as a set of region-specific plugins so different continents can plug into the same backbone without breaking compatibility. The model layer should contain a shared global foundation plus region-specific fine-tuned models. The scenario engine should ensure SSP consistency worldwide. The output layer should handle localization so that the final presentation matches regional conventions, units, languages, and policy needs. That architecture would make ClimateiQ much more maintainable. Instead of treating each continent as a separate codebase, the platform would operate as a common framework with localized extensions. That is the most scalable way to grow from a regional prototype into a global climate intelligence product.
10. Strategic Roadmap for Africa Expansion
A practical expansion strategy would begin with a first phase focused on data integration and a baseline model. In this phase, AFR-CORDEX and ERA5 should be brought into the pipeline, and a foundational Africa-focused downscaling model should be trained. The second phase should focus on localization by adding Africa-specific geographic features and adapting vulnerability scoring to reflect local conditions. The third phase should involve pilot deployment in countries such as Nigeria, Kenya, and South Africa, since they provide a useful mix of climate regimes, infrastructure conditions, and policy contexts. The fourth phase should expand the platform across the rest of the continent, including the Sahel, Central Africa, and North Africa. There are also clear risks that need to be managed. Data inconsistency across regions can reduce model reliability. Overfitting to data-rich continents could make the system less effective in Africa, where observations are sparser. Policymakers may misinterpret outputs if they are presented too technically, and infrastructure limitations can slow adoption. These risks do not make expansion impossible, but they do mean the rollout must be deliberate and well supported. The Highest-Leverage Improvement If only one major improvement is made, it should be a shift from climate prediction to decision intelligence. That means ClimateiQ should not stop at forecasting temperature or rainfall changes. It should translate those changes into economic, agricultural, and human-impact metrics that matter to real users. This is especially important in Africa, where practical usefulness often matters more than pure predictive precision. A climate system that helps users make better decisions is more valuable than one that simply produces more numbers.
Bottom Line
To expand ClimateiQ globally and into Africa, the platform has to become more adaptable at every layer. Technically, that means generalizing the pipeline, improving the model architecture, and integrating global and regional datasets. Scientifically, it means accounting for local climate dynamics and geographic variation. Operationally, it means making the outputs actionable for real users. Strategically, it means localizing the data, the model, the interface, and the policy alignment so that the app works not just as a climate model, but as a practical environmental decision system.
Built With
- na-cordex
- python

Log in or sign up for Devpost to join the conversation.