Inspiration
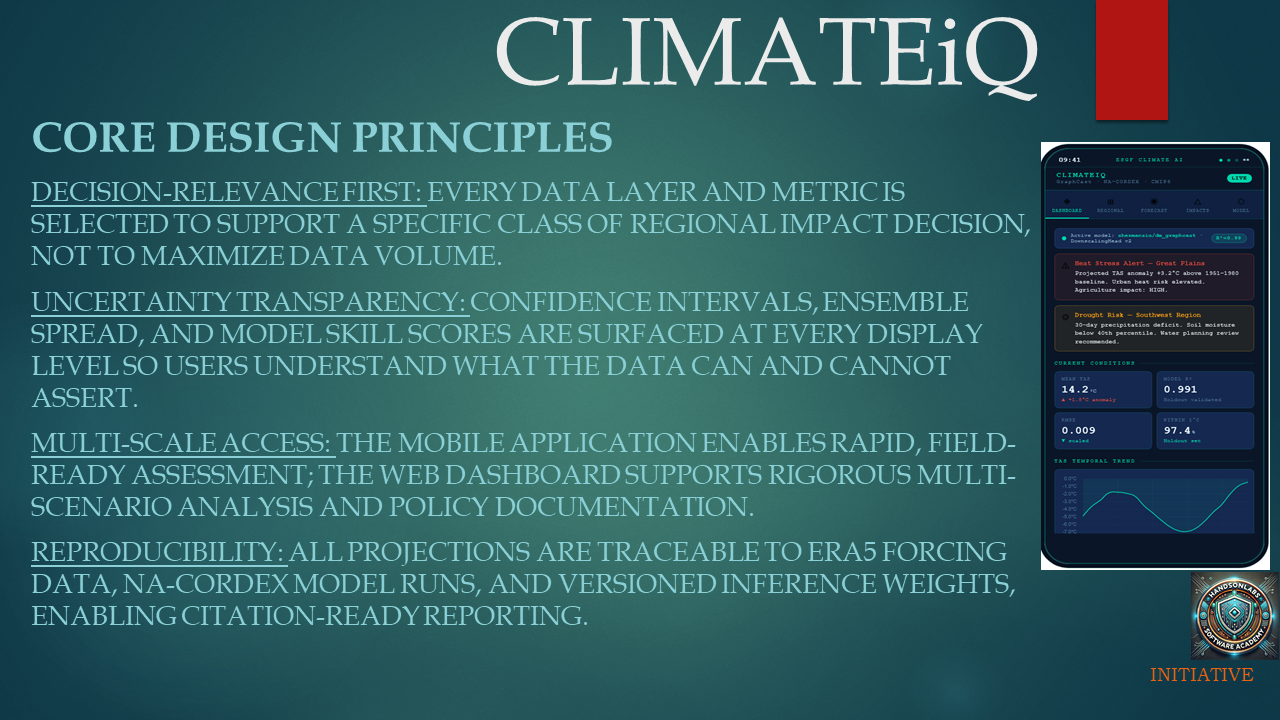
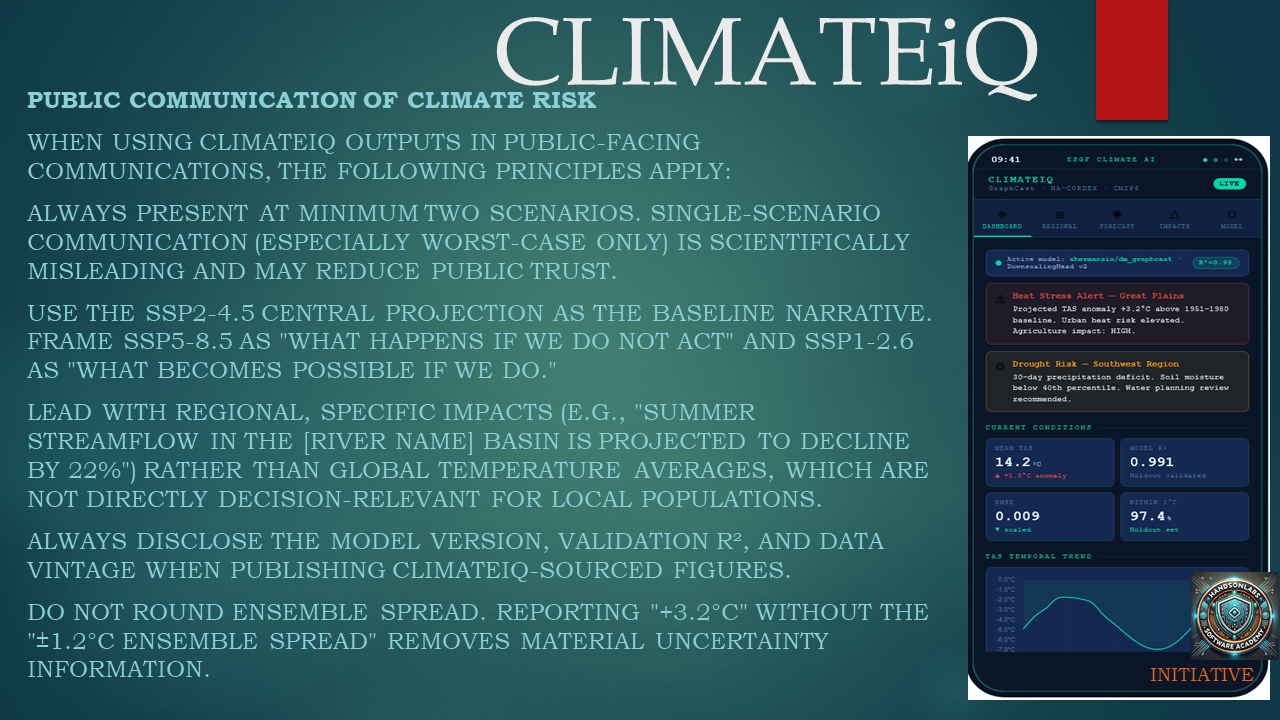
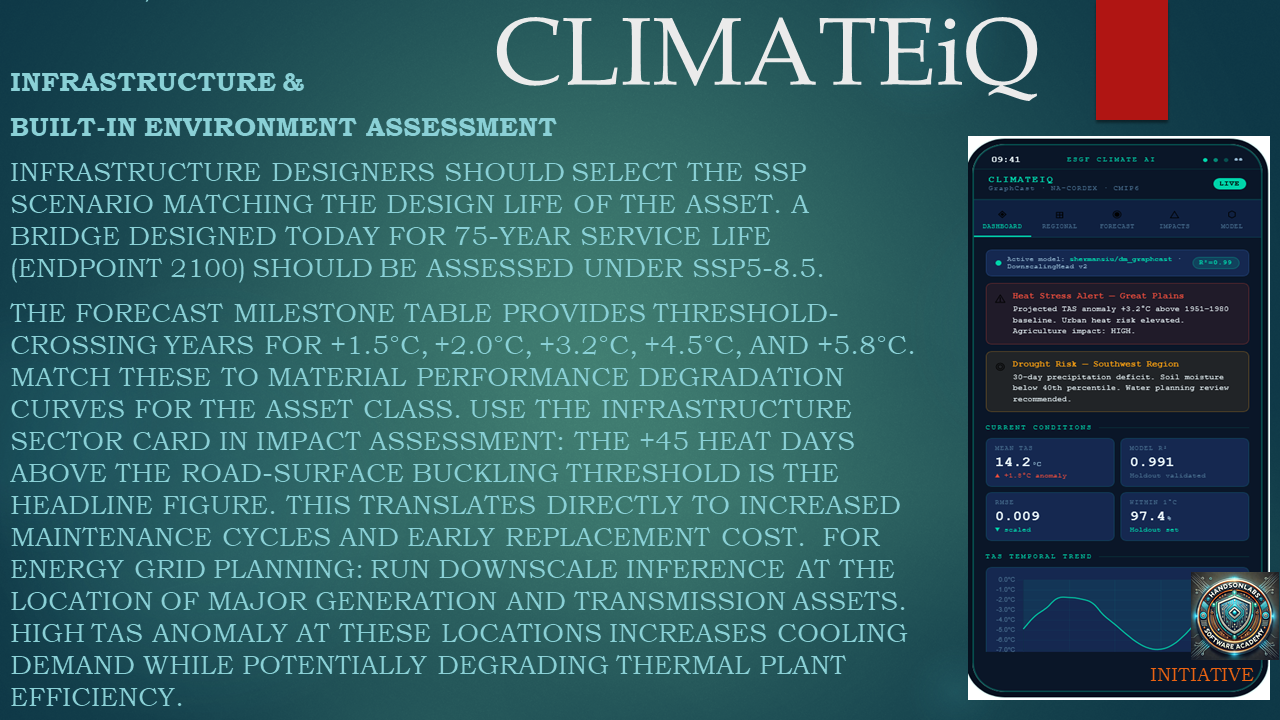
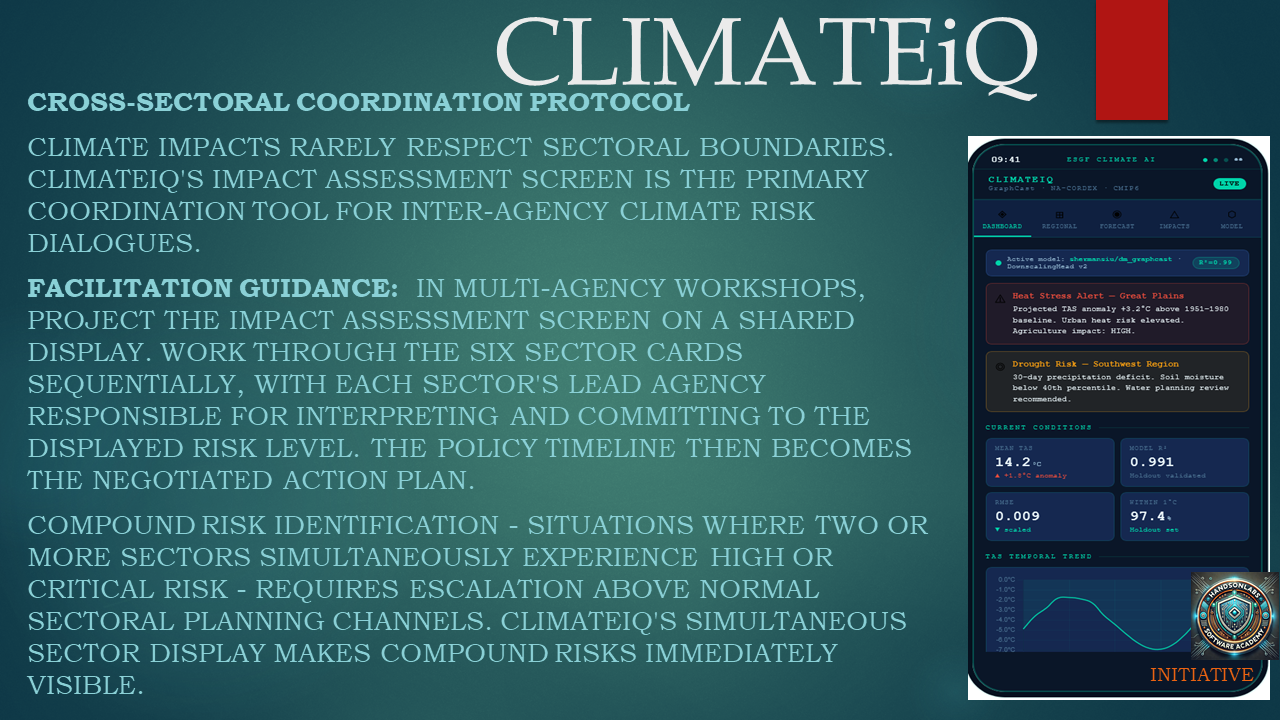
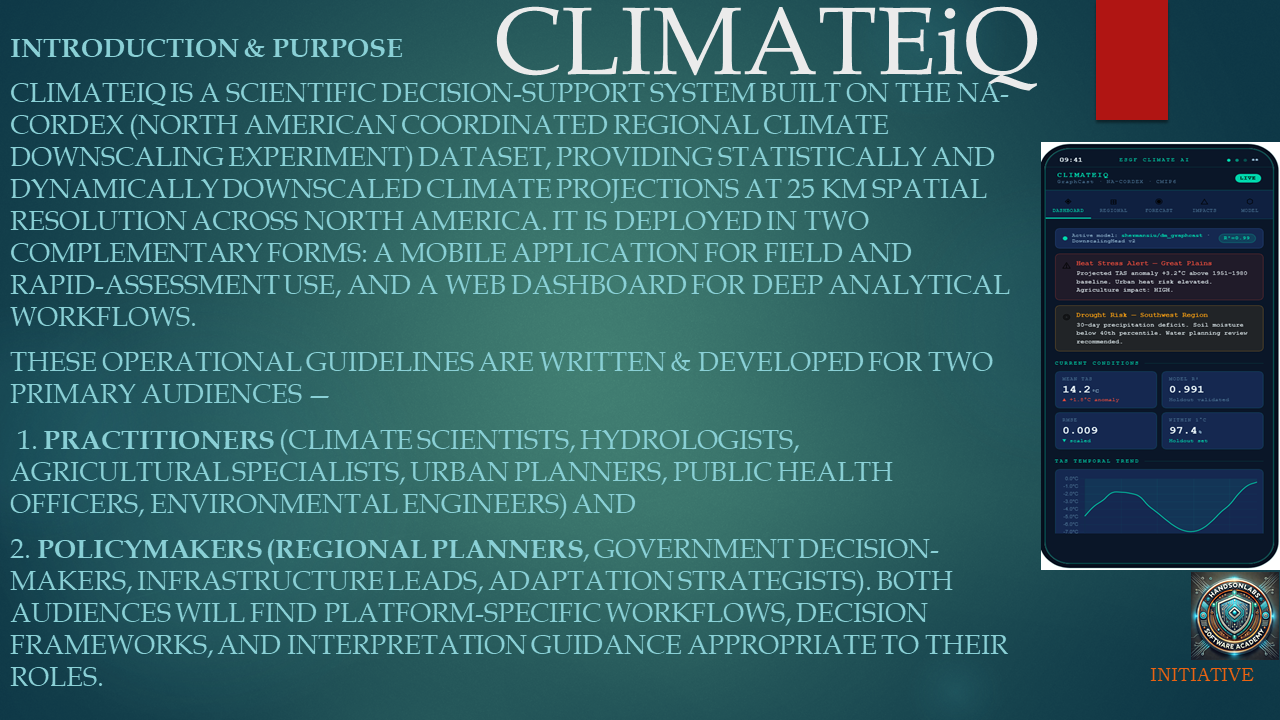
ClimateiQ is clearly motivated by a gap between climate science and operational decision-making: the project does not treat climate output as something to be viewed in isolation, but as something that has to become actionable for real users. The slides explicitly frame the system around “decision relevance,” “uncertainty transparency,” “multi-scale access,” and “reproducibility,” which is a strong signal that the core inspiration was to turn climate projections into something that can actually support adaptation choices, rather than just produce maps and numbers. The audience is also deliberate: practitioners such as climate scientists, hydrologists, agricultural specialists, urban planners, public health officers, and environmental engineers, plus policymakers such as regional planners, government decision-makers, infrastructure leads, and adaptation strategists. That inspiration is reinforced by the application areas shown in the slides: heat stress, drought risk, flood risk, agricultural water balance, reservoir planning, public health exposure, and infrastructure planning. In other words, the project is inspired by the need to make climate projections legible to sectoral decisions, not just to climate experts.
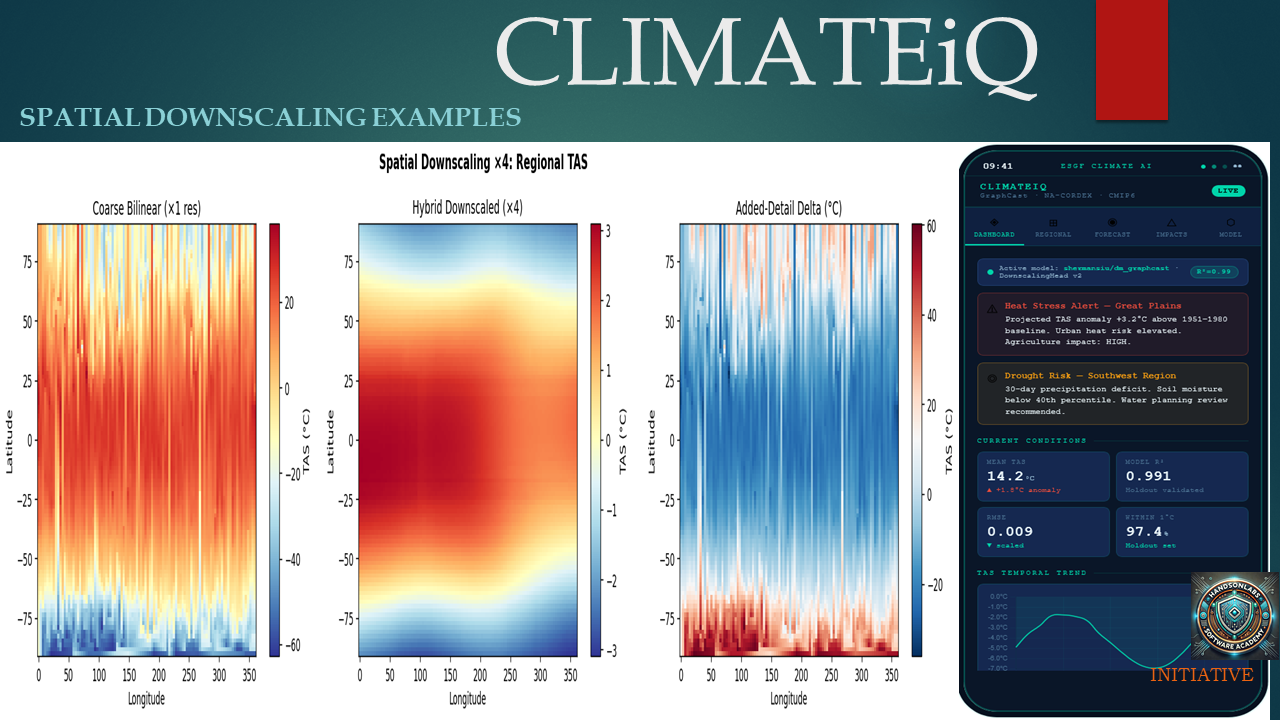
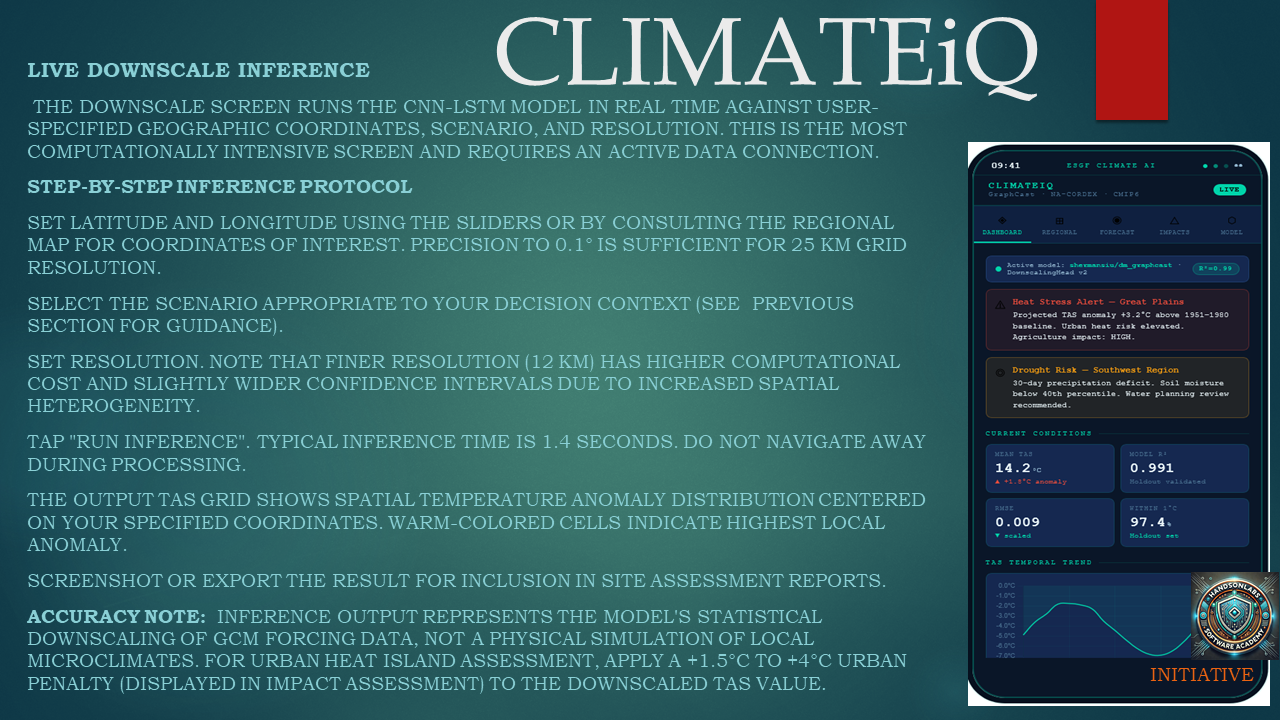
[Downscaling Example ]!(https://github.com/tobimichigan/ClimateiQ/blob/main/graphical_plots/Slide11.PNG)
What it does
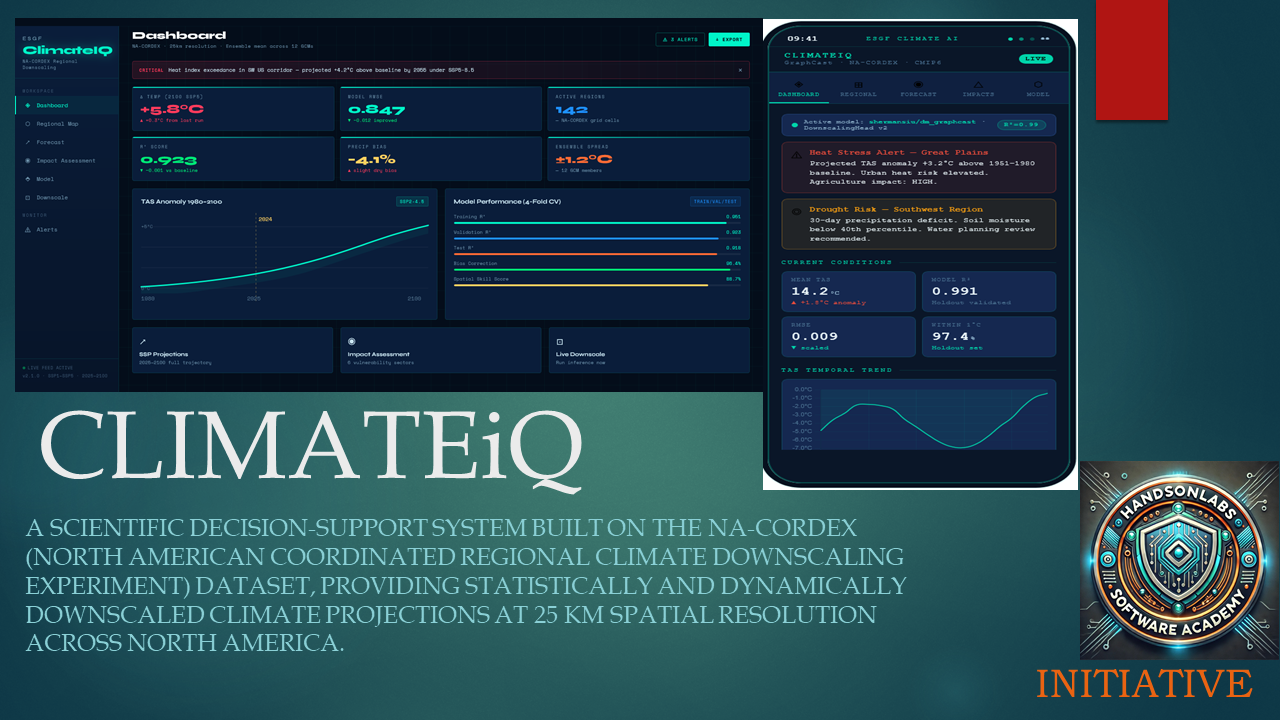
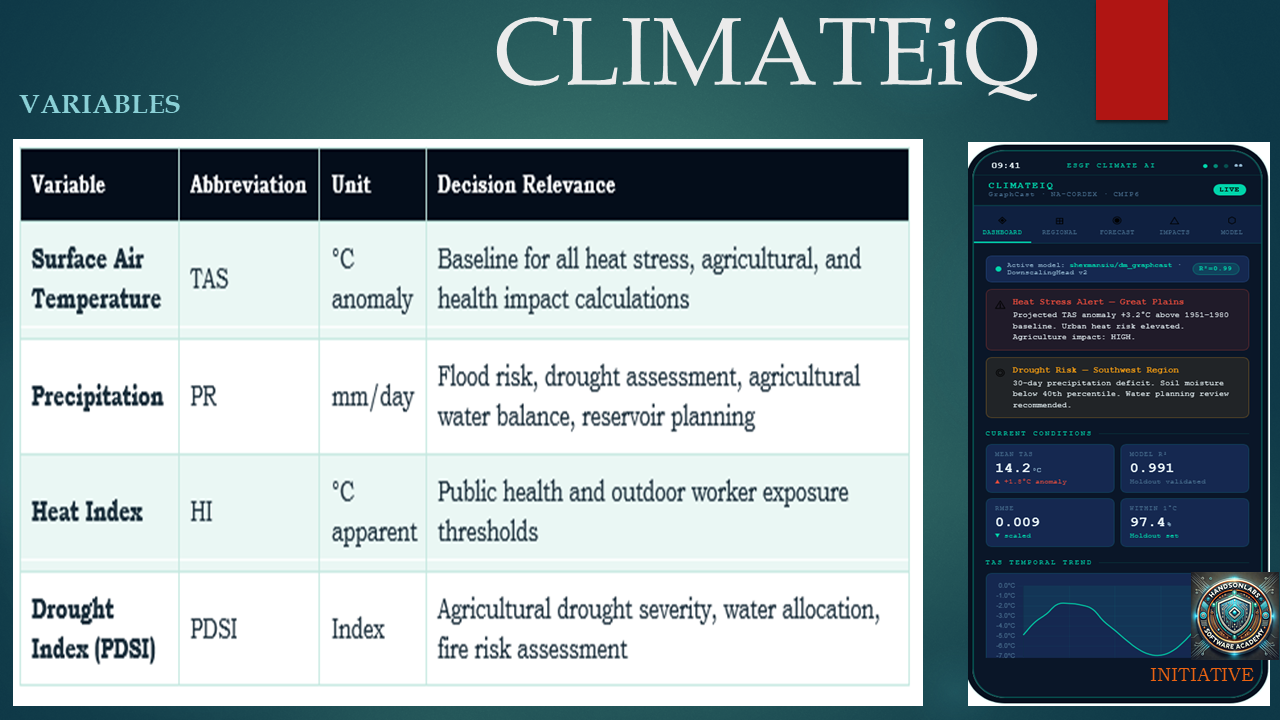
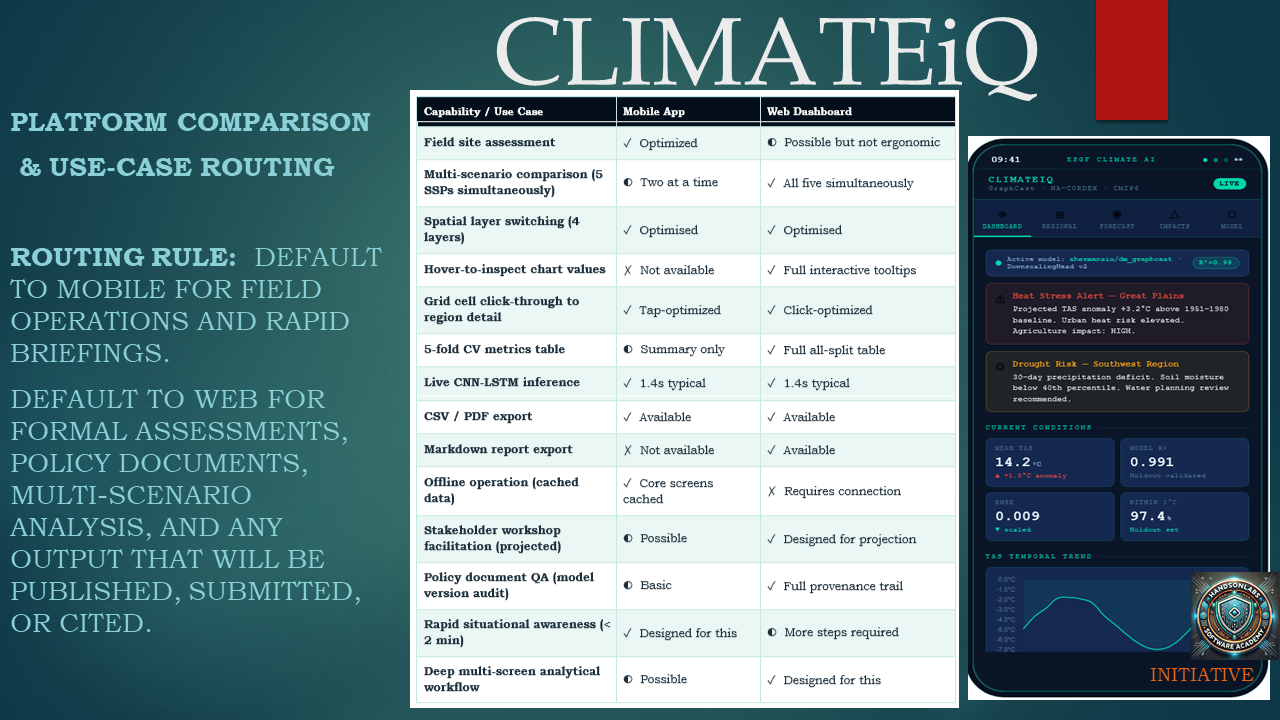
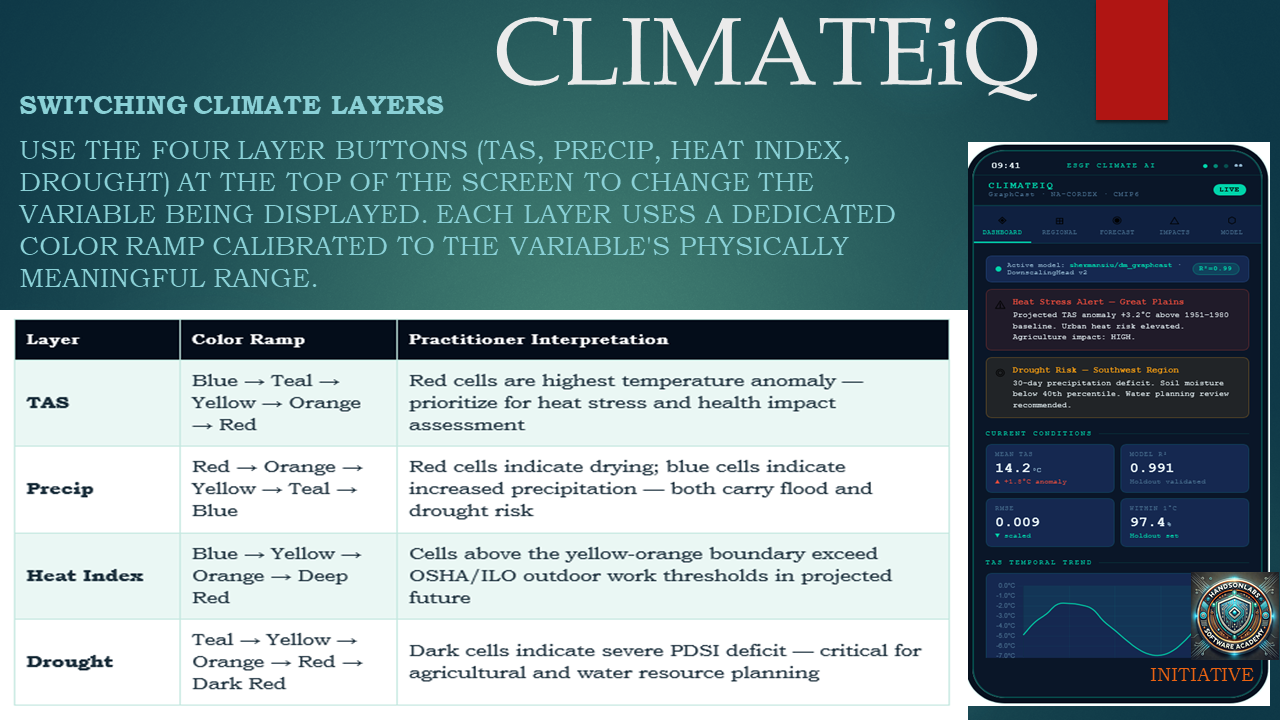
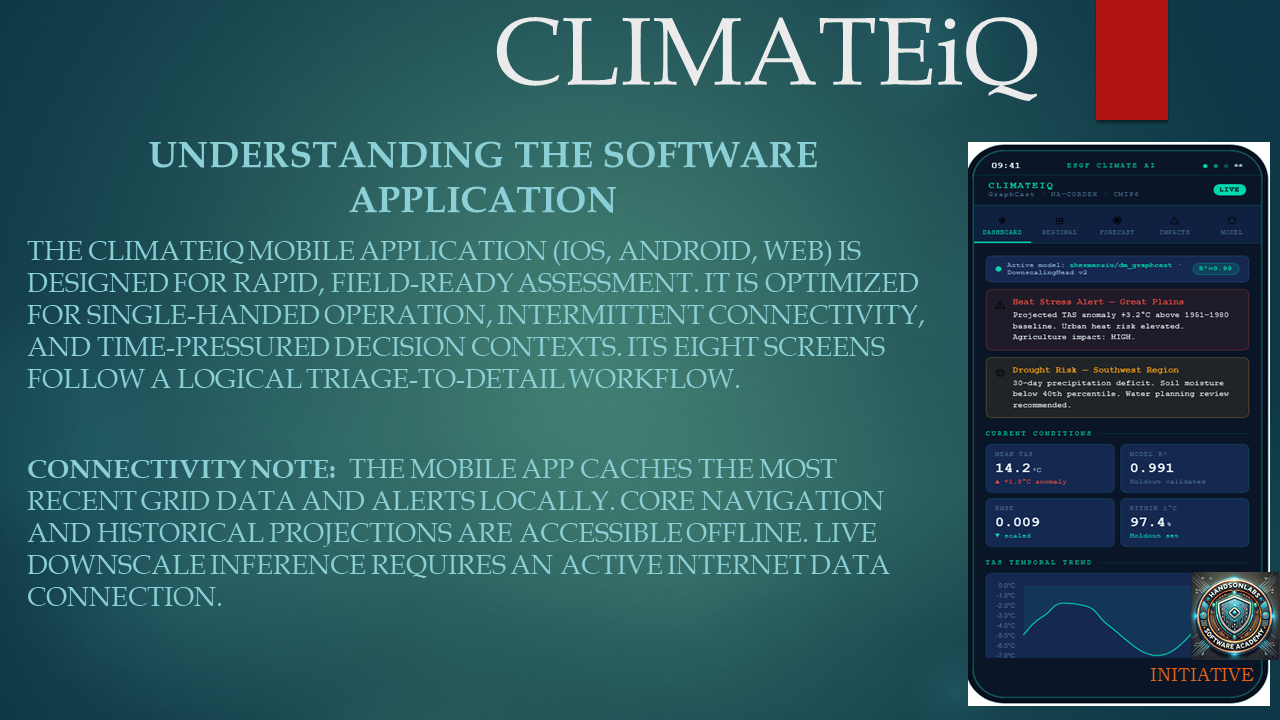
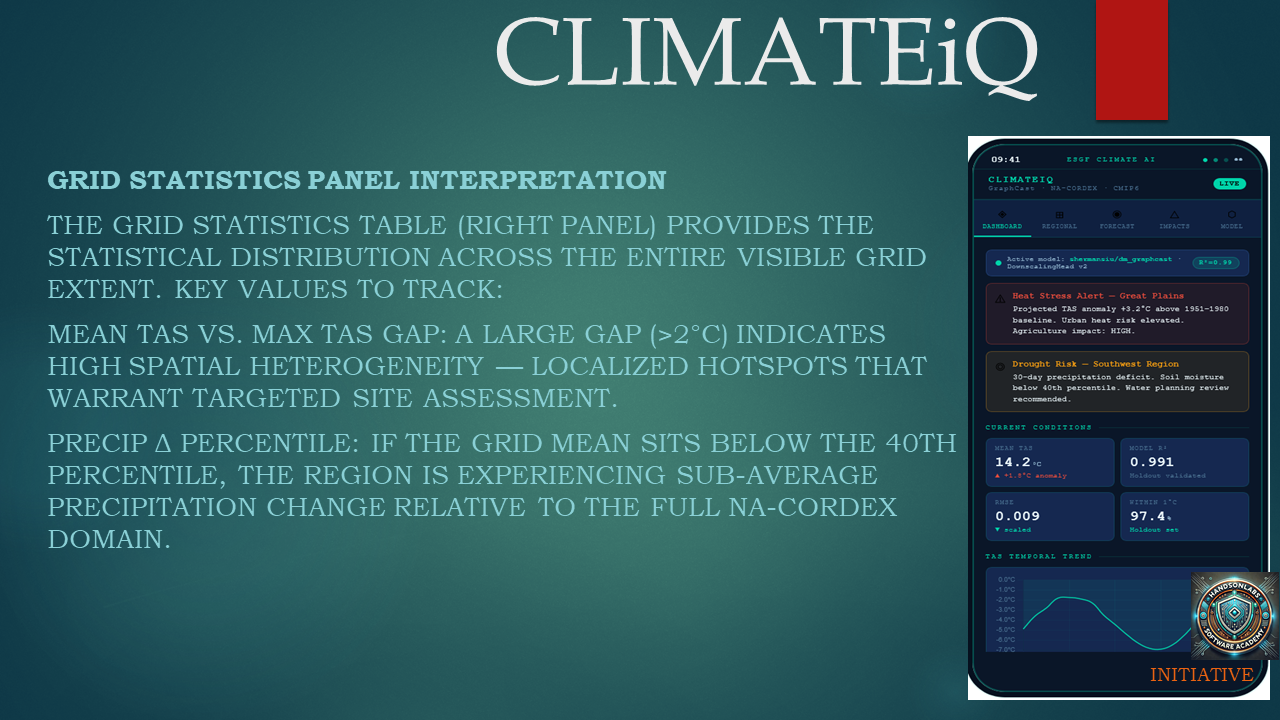
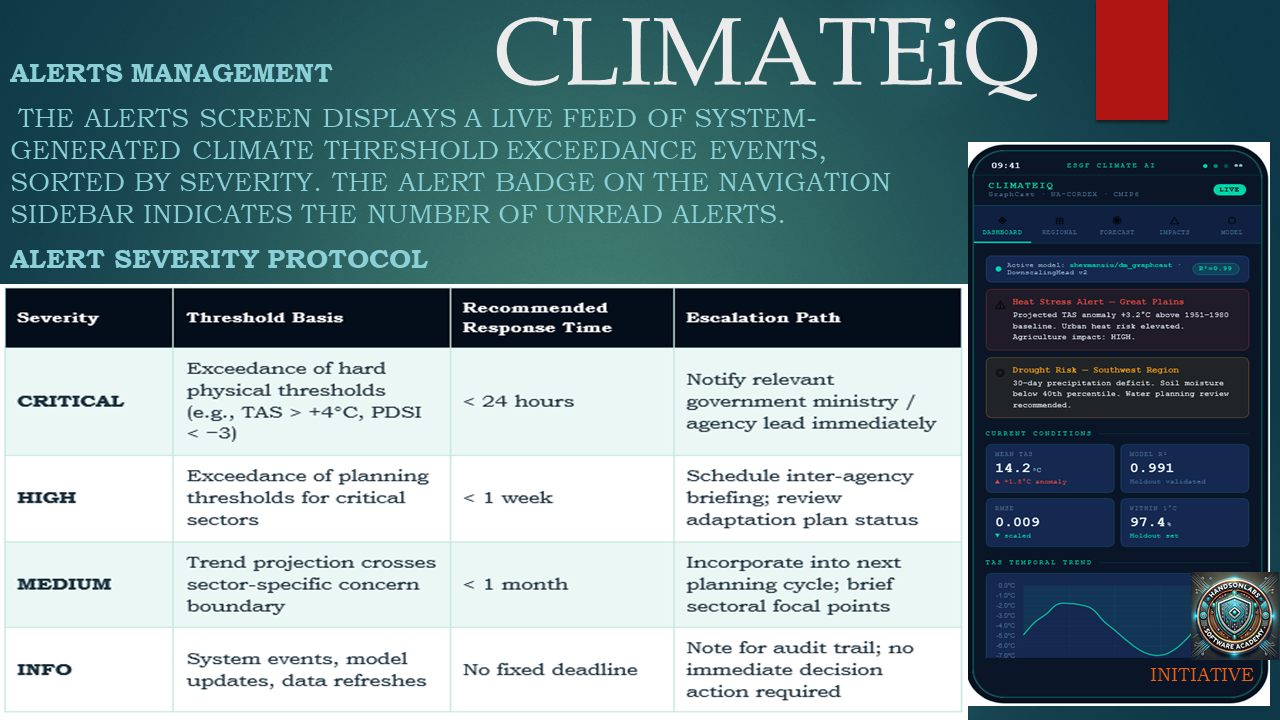
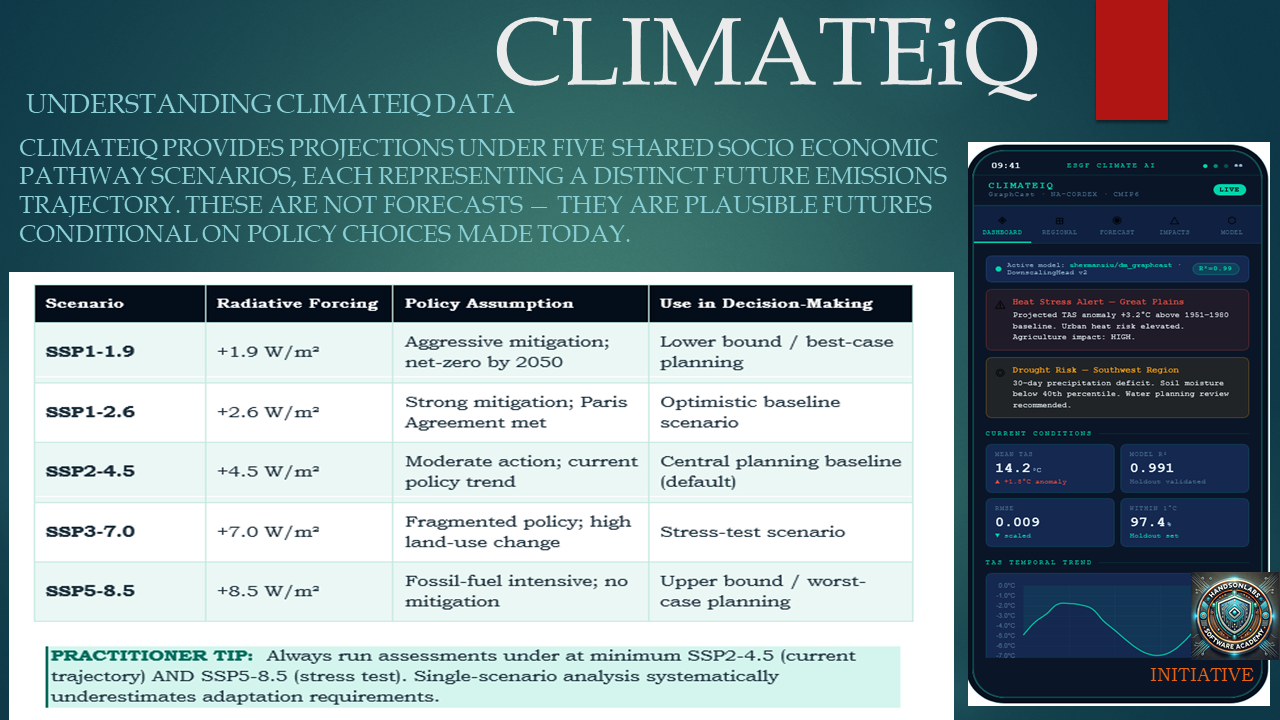
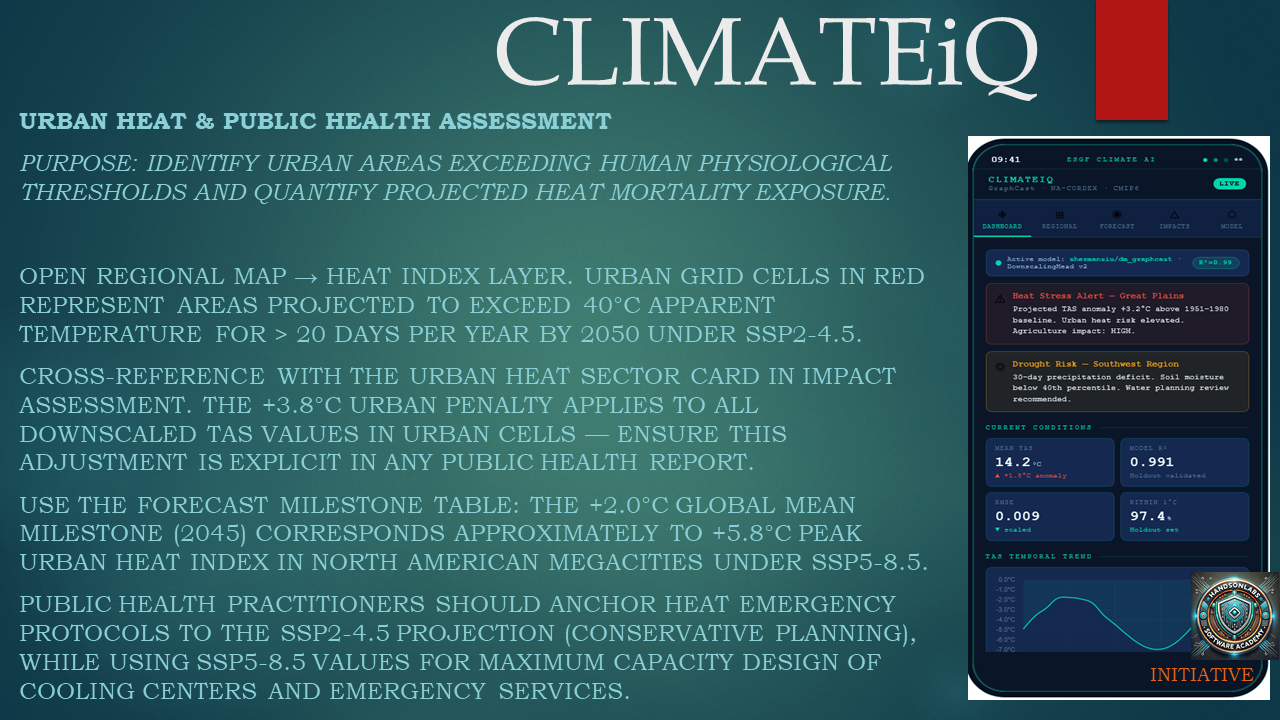
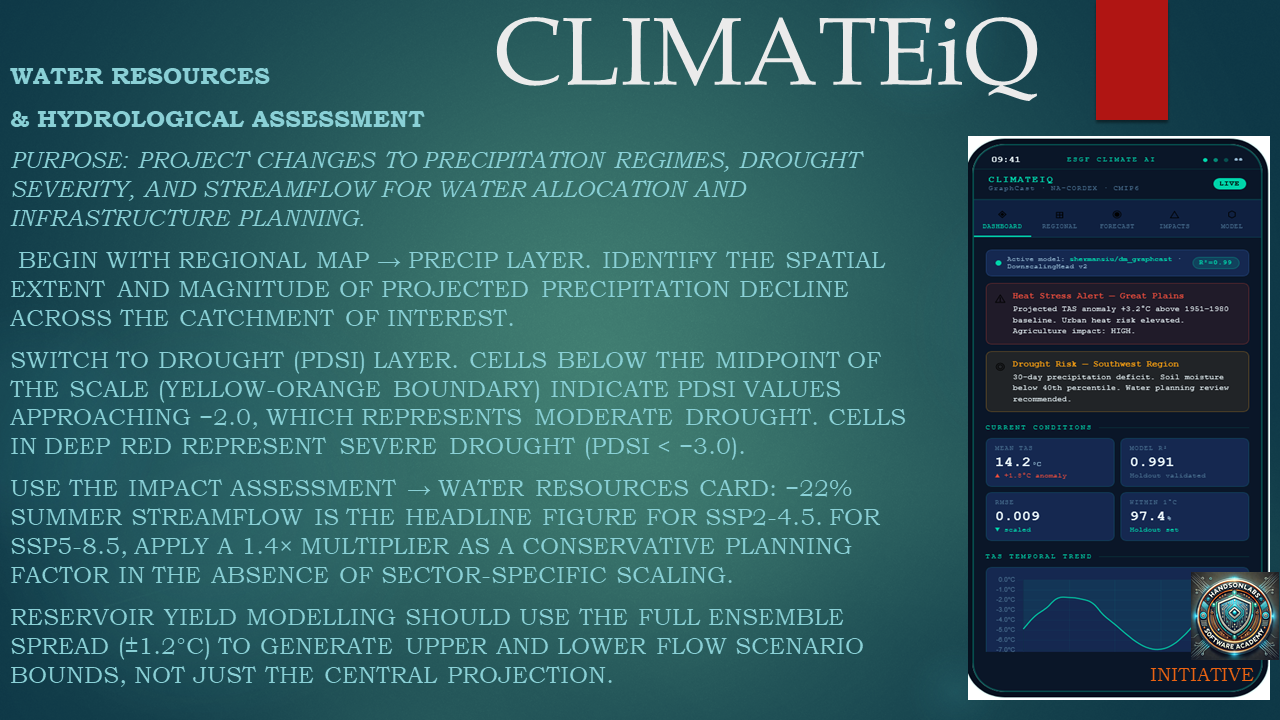
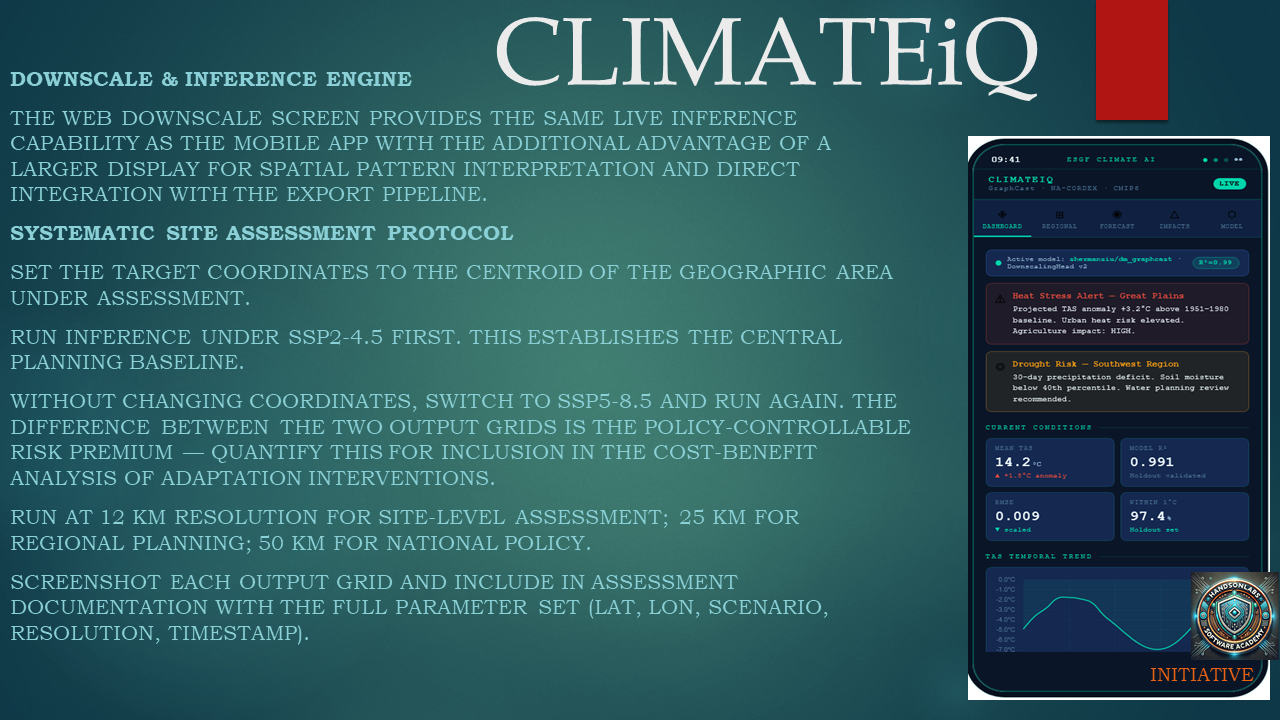
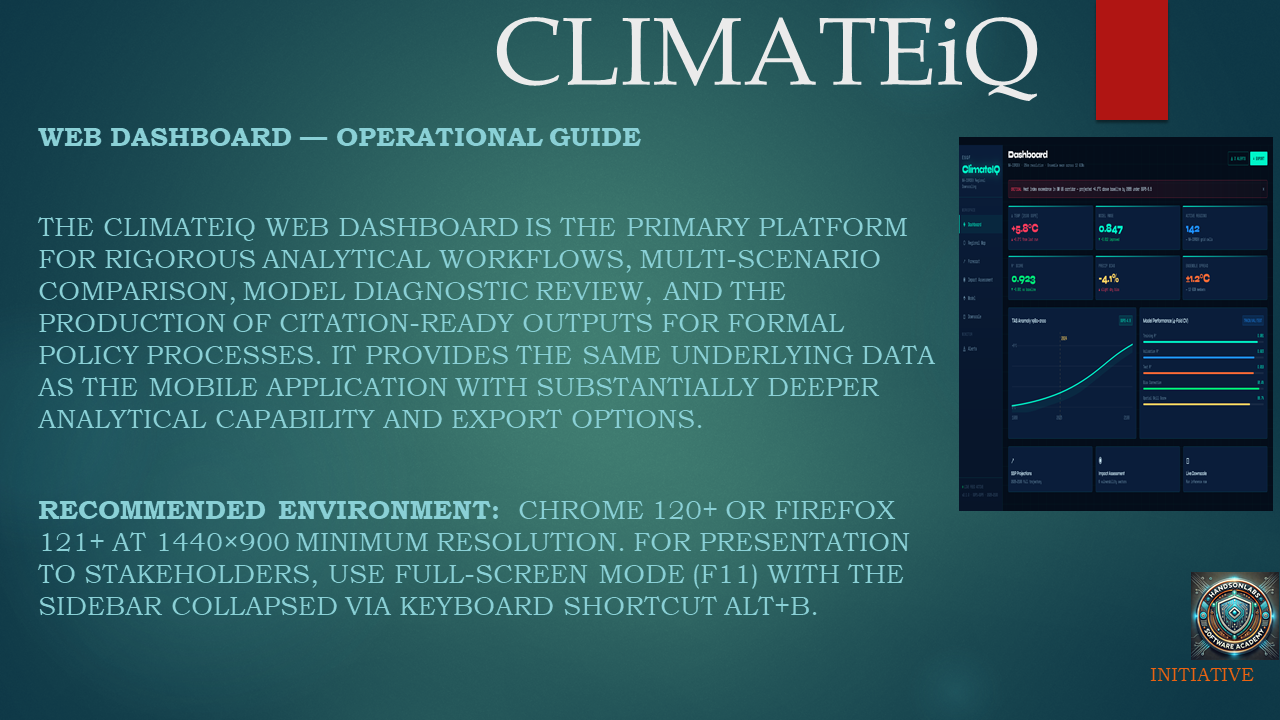
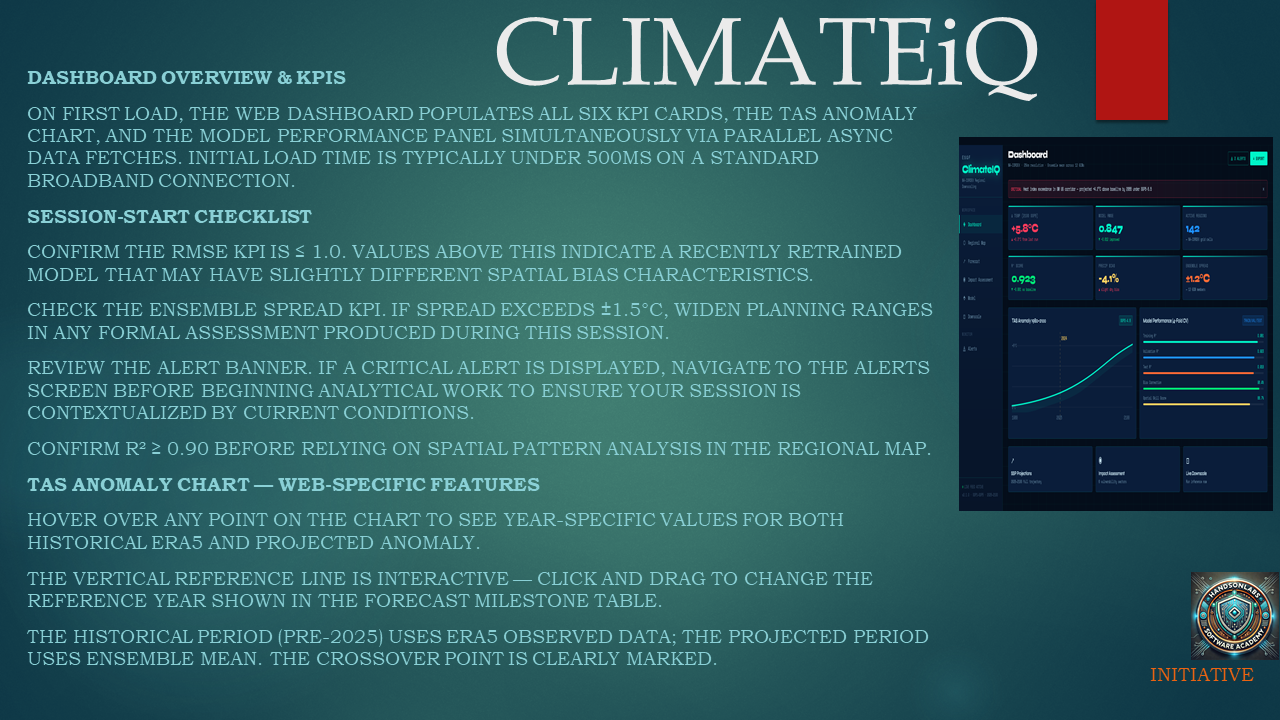
At its core, ClimateiQ is a regional climate decision-support platform that translates model output into sector-focused guidance. The README (on the official Github page) describes it as a system that ingests NA-CORDEX forcing and ERA5 reanalysis data, produces statistically and dynamically downscaled climate projections at about 25 km resolution, and exposes those results through a mobile app and a web dashboard. It supports ensemble projections under five Shared Socioeconomic Pathway scenarios, spans the period 2025–2100, and foregrounds validation metrics and uncertainty instead of hiding them. The visual outputs show a fairly broad product surface. The app and dashboard include current-condition cards, alerts, trend charts, scenario comparisons, and “impact assessment” style views. The slides also show the variables the system focuses on: surface air temperature anomaly (TAS), precipitation (PR), heat index (HI), and drought index (PDSI). Those variables are tied to practical decisions such as heat-stress planning, flood and drought assessment, water allocation, and fire-risk screening. The product is also designed to separate the mobile and web use cases. The mobile app is presented as rapid, field-ready, and optimized for single-handed or time-pressured use, with cached offline access for core screens. The web dashboard is presented as the deeper analytical environment: multi-scenario comparison, model diagnostics, exportable reports, and citation-ready outputs.
How we built it
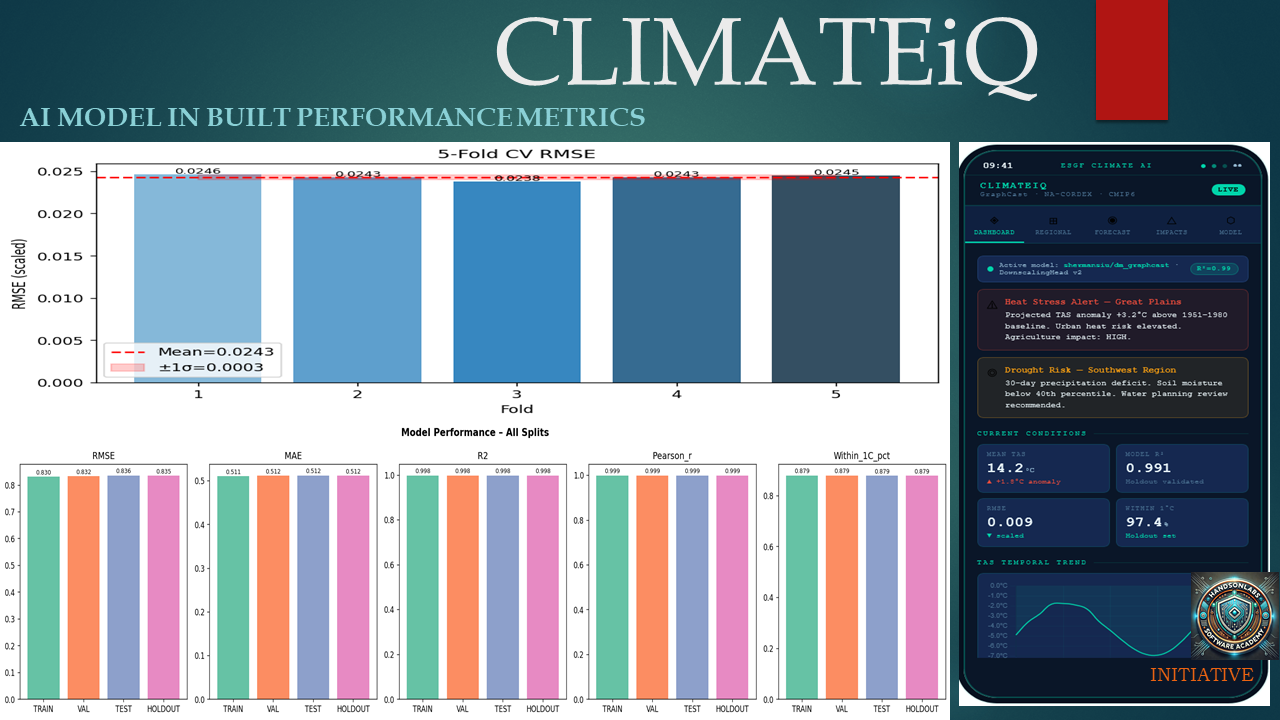
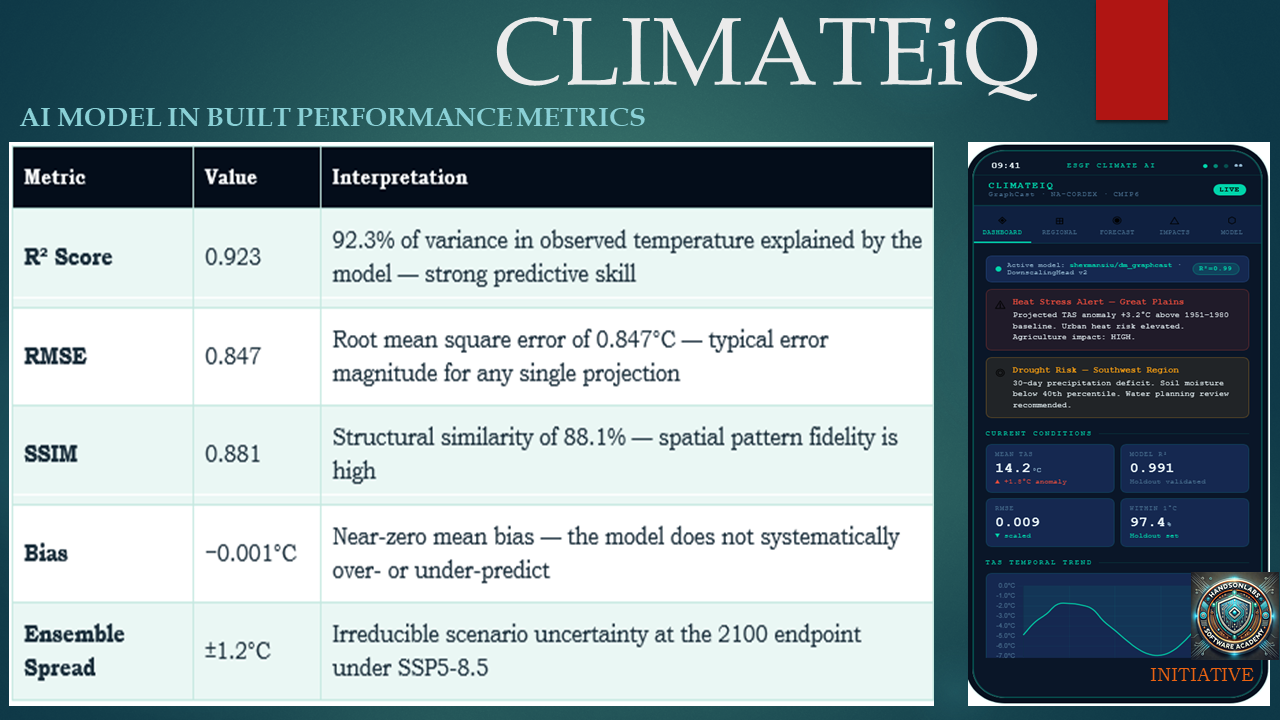
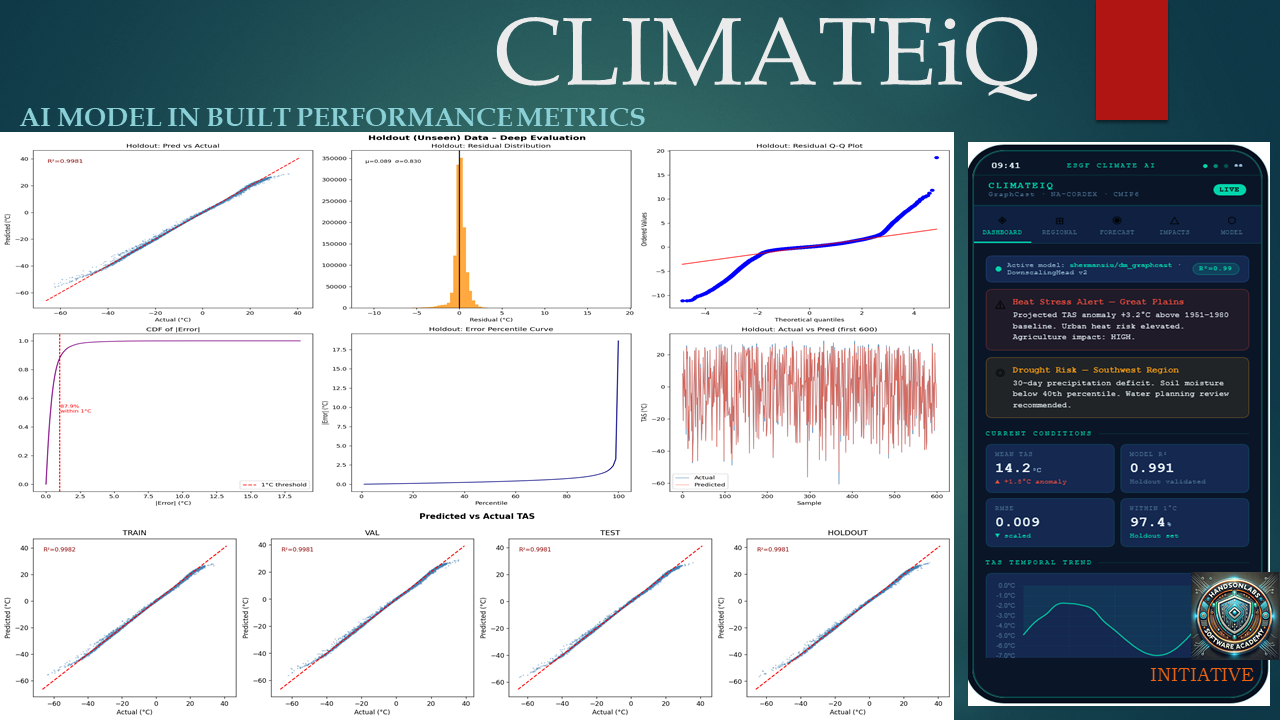
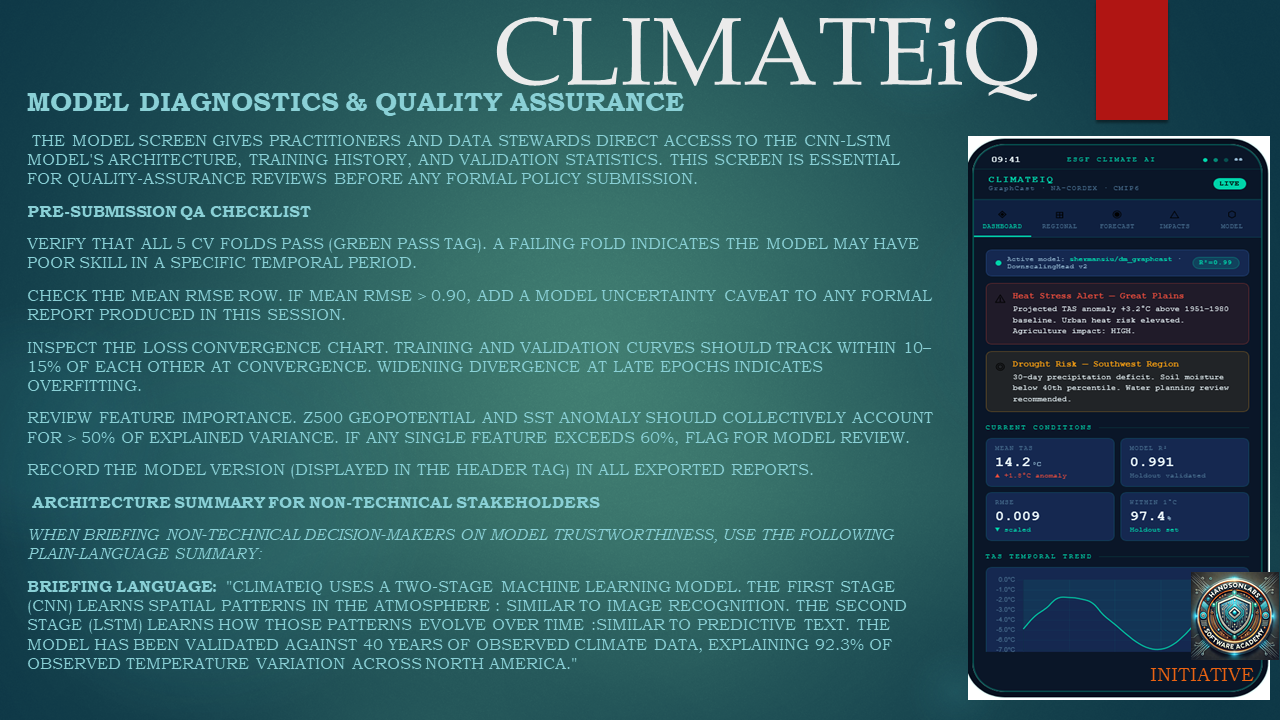
Based on the repository layout and the slide deck, the build is a pipeline of: ingesting climate datasets, training or applying a CNN–LSTM downscaling model, validating it across train/validation/test/holdout splits, and then wrapping the outputs in a user-facing dashboard and mobile application. The repo structure itself supports that reading: the top level contains src, notebook, model_results, and graphical_plots, which suggests a separation between model code, experimentation, saved results, and presentation assets. The model side is not just asserted; it is visualized. One slide summarizes built-in performance metrics such as R², RMSE, SSIM, bias, and ensemble spread. Another shows a deep holdout evaluation with predicted-vs-actual scatter, residual histograms, Q–Q plots, error CDFs, percentile curves, and a time-series comparison. A separate slide shows 5-fold cross-validation RMSE and split-by-split metric stability, and another presents a spatial downscaling comparison that contrasts coarse bilinear input with the hybrid downscaled output and the added-detail delta. Taken together, those figures suggest a fairly standard scientific-ML workflow: fit, validate, inspect residuals, then show the spatial effect of the downscaling.
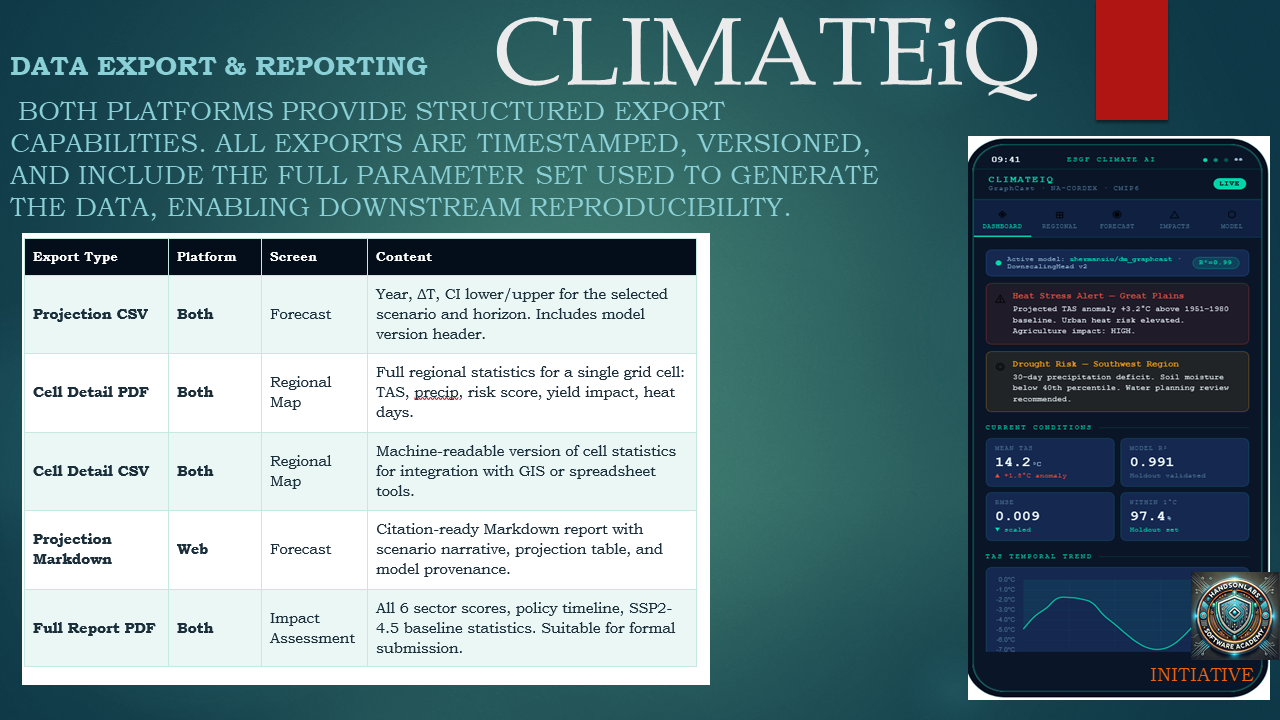
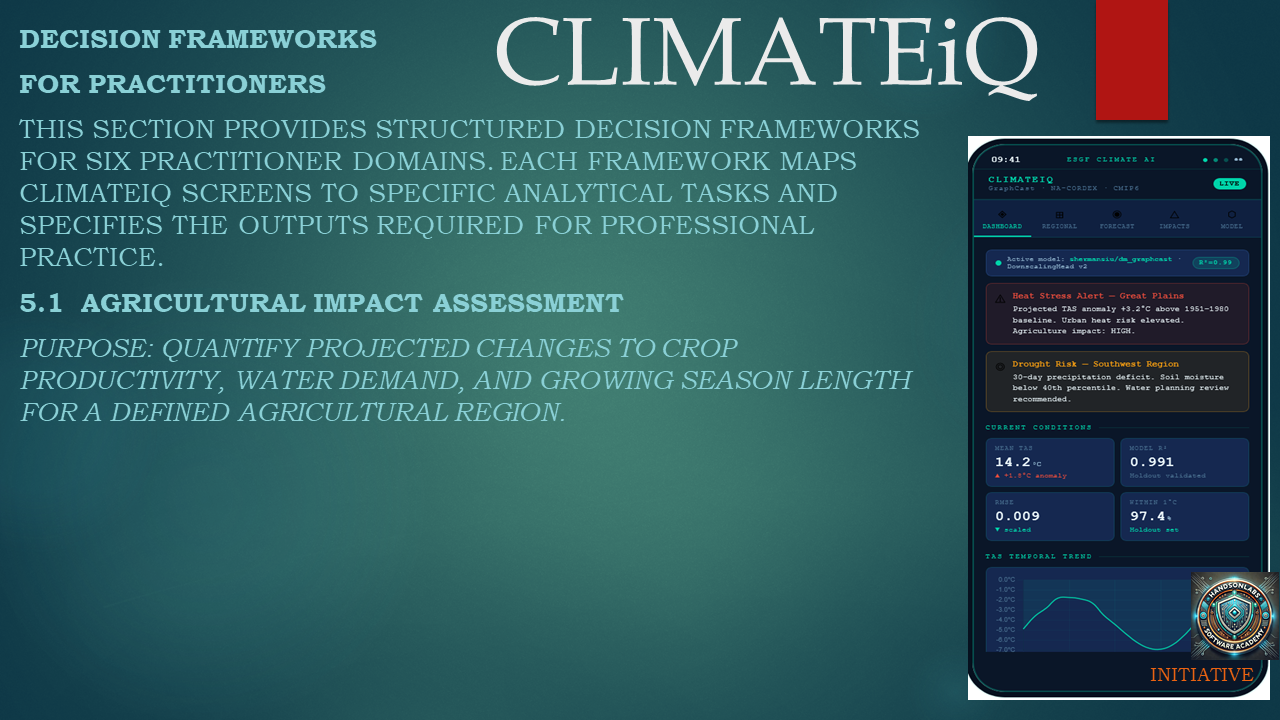
The productization layer is equally deliberate. The slide deck shows a mobile dashboard mockup with a compact card layout, and later slides document output formats such as CSV, PDF, Markdown reports, and full report PDFs. That means the build was not just “model first”; it was engineered to produce decision artifacts in formats that different stakeholders can actually use.
Challenges ran into
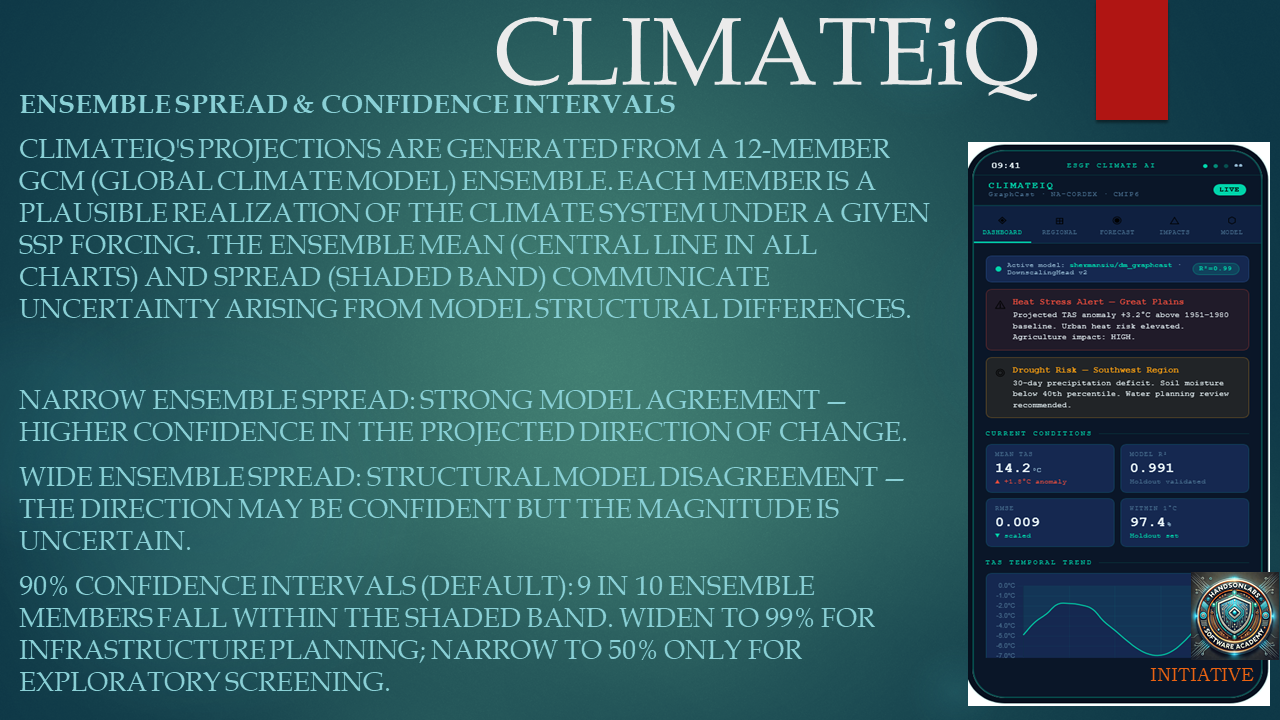
The biggest challenge reflected in the repo is uncertainty management. The slides make it explicit that ClimateiQ must communicate not only the direction of change, but the magnitude of uncertainty around that change. They warn against single-scenario communication, show ensemble spread and confidence intervals, and emphasize that uncertainty in magnitude is not the same as uncertainty in direction. That is a hard design problem because the UI has to be honest without becoming unusably cautious. A second challenge is scale mismatch. The project operates at about 25 km resolution, and the limitations slide is direct that this cannot resolve features smaller than roughly 50 km, including urban-scale heat dynamics, small river catchments, and highly localized precipitation events. It also states that ClimateiQ currently covers only a subset of variables—TAS, PR, HI, and PDSI—so some use cases still require complementary datasets. Those are not minor caveats; they define the boundary between what the tool can screen and what still needs domain-specific follow-up analysis. A third challenge is responsible communication. The deck repeatedly warns that outputs should not be presented as official government projections unless formally endorsed, and that misuse includes treating them as engineering-grade design inputs, operational weather forecasts, or the sole basis for emergency evacuation. The system therefore has to solve both a technical problem and a governance problem: making outputs useful enough to act on, while hard-limiting overclaim.
Accomplishments that we’re proud of
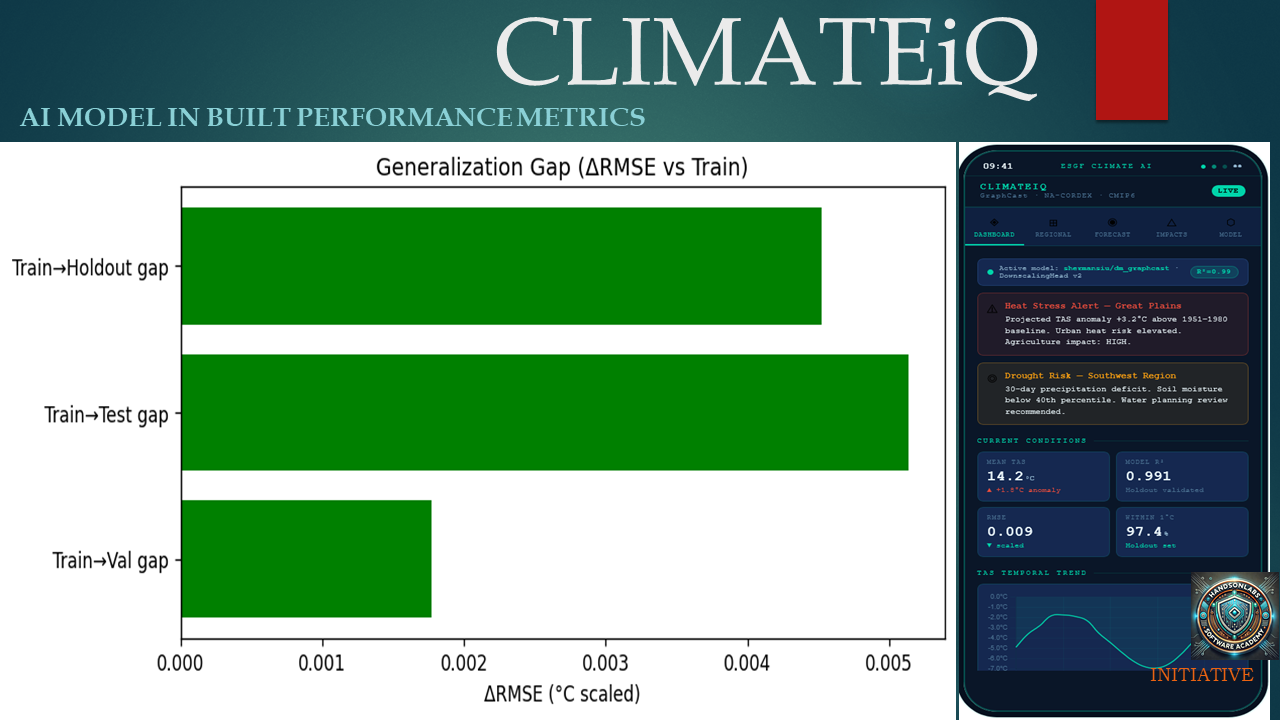
The strongest accomplishment is that the project does not stop at a model score; it builds an interpretable climate product. The slides show a respectable built-in evaluation table with R² = 0.923, RMSE = 0.847, SSIM = 0.881, near-zero bias, and ensemble spread around ±1.2°C at the 2100 endpoint under the worst-case scenario. On top of that, the holdout evaluation slide reports a much deeper diagnostic view, including a holdout scatter with R² ≈ 0.9981 and roughly 87.9% of errors within 1°C. That combination of quantitative fit plus uncertainty reporting is a real strength. Another accomplishment is the clarity of the multi-split evaluation. The cross-validation slide shows very consistent fold performance, and the generalization-gap slide suggests that train-to-validation/test/holdout differences are small rather than explosive. For an ML climate product, that matters because the risk is not just low accuracy; it is brittle generalization. The deck suggests the team worked hard to avoid that failure mode. A third accomplishment is product design. ClimateiQ is not framed as a single map or a one-off report. It is a complete workflow system with a mobile tier for rapid triage, a web tier for deeper analysis, scenario framing, sector prioritization, exportable reports, and policy-oriented briefing templates. That is a meaningful step from “model demo” to “decision platform.”
What was learned
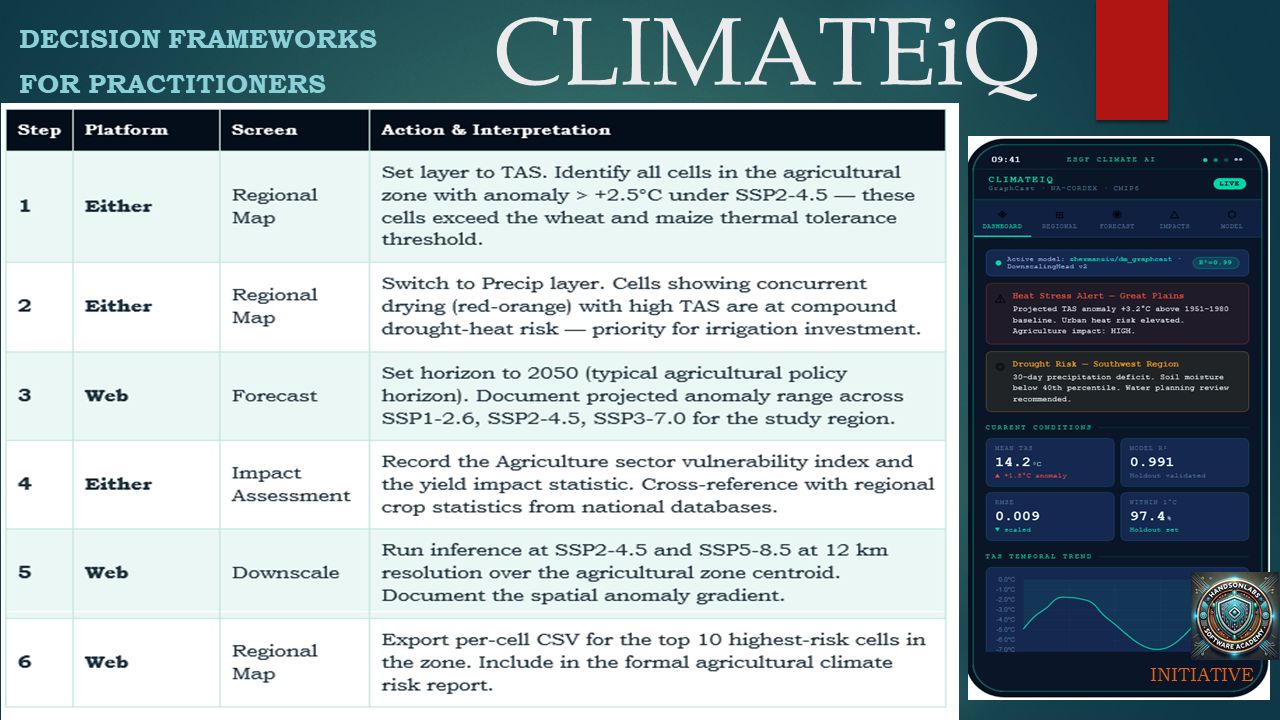
The slides imply a few strong lessons. First, climate tools have to be audience-specific. Practitioners need field-ready triage, while policymakers need scenario framing, comparative analysis, and briefing-ready outputs. The project’s split between mobile and web is a direct response to that. Second, uncertainty is not a footnote; it is part of the product. ClimateiQ spends real estate on ensemble spread, confidence intervals, scenario comparisons, and cautionary guidance about how to report the results. That suggests an important learning: for climate decision support, a model that is technically strong but poorly interpreted can still be operationally weak. Third, reproducibility and provenance are essential. The deck says outputs should be traceable to ERA5 forcing, NA-CORDEX runs, and versioned inference weights, and the export/report slides emphasize timestamps, versions, and model headers. That means the team learned that climate AI is only credible when downstream users can audit the lineage of a projection.
What’s next for ClimateiQ for Policy Makers and Practitioners
The roadmap implied by the deck is to go deeper regionally and more specific operationally. The final slide explicitly calls out future work exploring African-based datasets, which points to the most obvious next step: local calibration, broader regional coverage, and stronger relevance outside the current NA-CORDEX framing. The limitations slide also points toward higher-resolution or supplementary analyses for urban heat, small catchments, and localized precipitation, so the next version should probably add nested regional workflows or companion data sources for those cases.
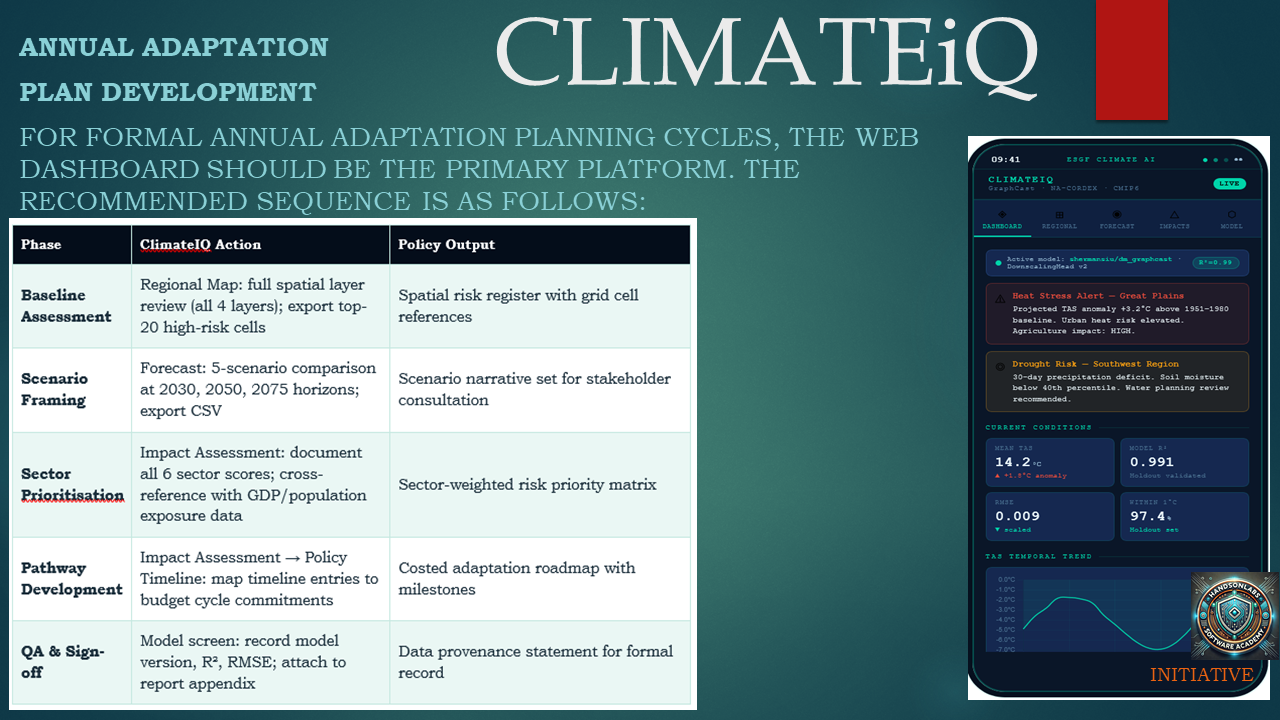
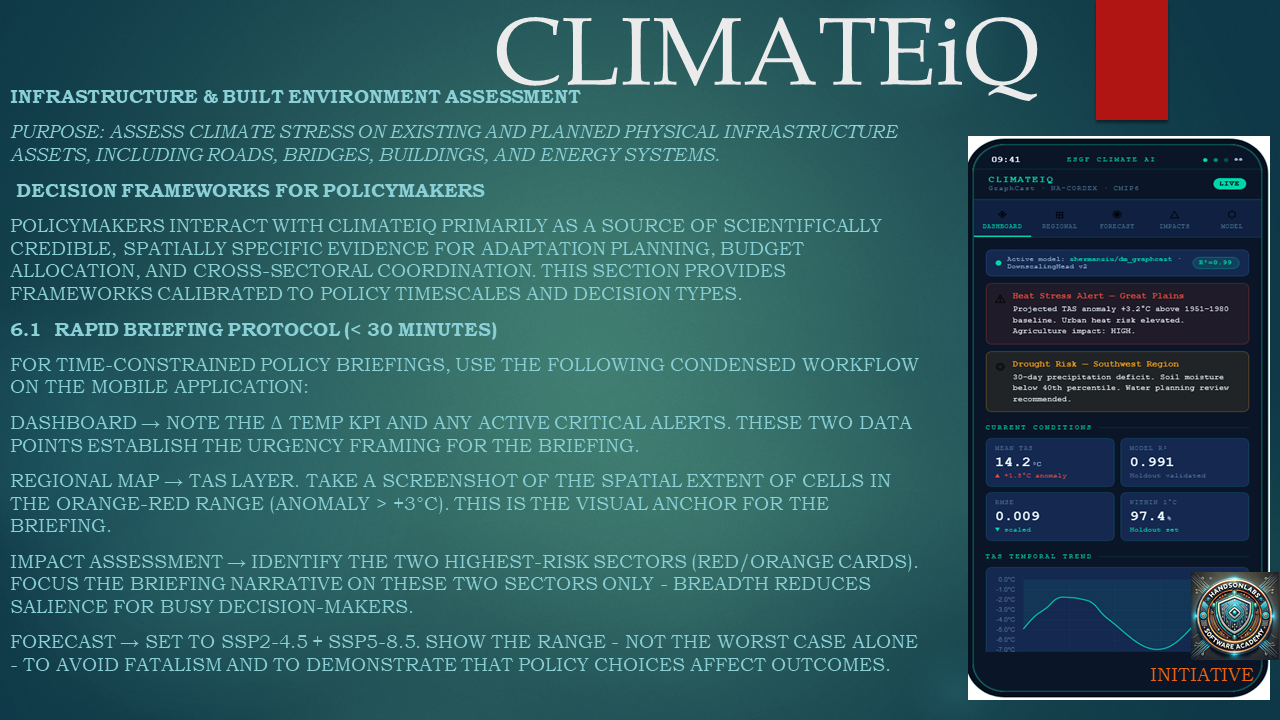
For policymakers, the next step is likely tighter integration into annual adaptation planning, budget cycles, and cross-sector coordination. The policy slides already outline a briefing protocol, scenario framing, sector prioritization, pathway development, and QA/sign-off; the logical extension is to make those steps more formal, more exportable, and easier to embed in governmental workflows. For practitioners, the next step is probably better site-level specificity, more sector variables, and a stronger handoff from screening to follow-up analysis.
Overall Contribution of ClimateiQ
ClimateiQ’s contribution sits at the intersection of climate science, machine learning, and decision intelligence, and its real value is not just in building a predictive model, but in operationalizing climate data into actionable insight.
- Bridging the “Last-Mile” Gap in Climate Data A major systemic problem in climate science is that high-quality data exists, but is underutilized in decision-making. ClimateiQ directly addresses this by:
Translating raw climate projections (ERA5, NA-CORDEX) into interpretable indicators Structuring outputs around real-world risks (heat stress, drought, flooding) Designing outputs for non-technical stakeholders, not just researchers
Contribution: It transforms climate data from scientific output into decision input.
- Advancing AI-Driven Climate Downscaling ClimateiQ contributes technically through its CNN–LSTM hybrid architecture, which:
Captures spatial patterns (via CNNs) Models temporal dynamics (via LSTMs) Produces higher-resolution (~25 km) projections from coarser inputs
It goes beyond basic modeling by including:
Cross-validation and holdout testing Multiple evaluation metrics (R², RMSE, SSIM, bias) Residual and distribution diagnostics
Contribution: A robust, validated ML-based downscaling framework tailored for climate applications—not just accuracy, but reliability and interpretability.
- Embedding Uncertainty as a First-Class Feature
- Unlike many climate tools that obscure uncertainty, ClimateiQ:
Uses multi-scenario SSP projections Visualizes ensemble spread and confidence intervals Explicitly distinguishes: certainty in direction vs uncertainty in magnitude
Contribution: Promotes responsible climate intelligence, where decisions are informed by risk ranges, not just point estimates.
Delivering a Dual-Interface Decision Platform
ClimateiQ is not just a backend model—it is a complete product system:
Mobile App Fast, field-ready insights Offline-capable snapshots Real-time alerts and summaries Web Dashboard Scenario comparison (SSPs) Deep analytics and trend exploration Exportable reports (CSV, PDF, Markdown)
Contribution: Creates a multi-tier decision-support ecosystem, aligning tools with how different stakeholders actually work.
Structuring Climate Intelligence for Policy Workflows
ClimateiQ explicitly maps outputs to policy and practitioner workflows, including: Scenario framing Sector prioritization Impact assessment Adaptation pathway planning Reporting and communication
It also defines clear usage boundaries, preventing misuse in:
Engineering design Emergency forecasting Official projections without validation
Contribution: A policy-aligned climate analytics framework, not just a technical tool.
Emphasizing Reproducibility and Transparency
ClimateiQ enforces:
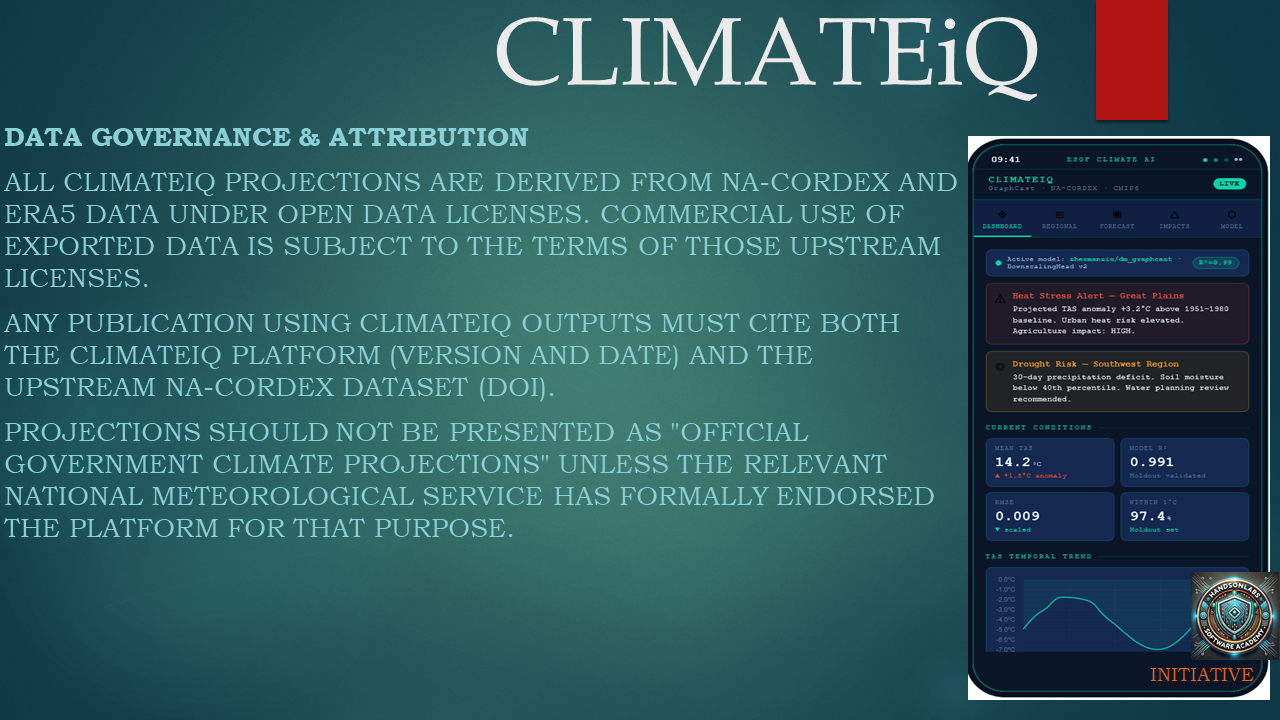
Data provenance (ERA5, NA-CORDEX traceability) Versioned models and outputs Exportable, auditable reports Explicit methodological documentation
Contribution: Builds trustworthy climate AI, where outputs can be audited, reproduced, and validated—critical for institutional adoption.
Defining a Scalable Foundation for Regional Climate Intelligence
The project is designed to evolve:
Extend to region-specific datasets (e.g., Africa-focused data) Add new variables and sectors Improve spatial resolution and localization Integrate into government planning systems
Contribution: Acts as a scalable blueprint for future climate decision platforms, especially in data-constrained regions.
Bottom Line
ClimateiQ’s overall contribution is not just “a climate model” or “a dashboard.”
It is a full-stack climate intelligence system that:
Converts complex climate data → actionable decisions Integrates AI modeling + uncertainty + usability Aligns with real policy and practitioner workflows
In one sentence: ClimateiQ moves climate analytics from prediction to decision-making infrastructure.
Built With
- na-cordex
- python


Log in or sign up for Devpost to join the conversation.