-
-

System Architecture
-
Flight departure monitoring
-
Co2 emissions by fuel and sector

Inspiration
Carbon emissions have consistently posed a significant threat to the environment, contributing to various issues like global warming, alterations in weather patterns, and rising average temperatures. Unfortunately, due to human negligence and a lack of sufficient attention to the matter, carbon emissions have become a pressing global concern. This issue urgently demands global attention. Through this project, our goal is to harness the capabilities of cloud computing services to analyze and mitigate carbon emissions associated with flights, and electricity and fossil fuels consumption. These factors collectively contribute to significant carbon footprints, and addressing them is crucial for environmental sustainability.
What it does
The scope of this project includes building an interactive dashboard that allows users to perform comprehensive data analysis and time series forecasting of carbon emissions related data, and study the long term adverse effects of carbon footprint on environment and ecology through a causal inference of the data. They can additionally educate themselves about the sustainability initiatives and green solutions for curbing these issues.
- Monitor and analyze carbon emissions associated with a broad range of emission generating activities in the modern world.
- Understand the correlation between fuel usage (Coal, Natural Gas, Petroleum) and CO2 emissions associated with different sectors such as Commercial, Industrial, Residential, etc.
- Provide a platform for non-profit organizations to advocate for sustainability and green solutions at an organizational level and to raise awareness about individual carbon footprint and motivate the general public to be eco-friendly and environmentally responsible.
How we built it
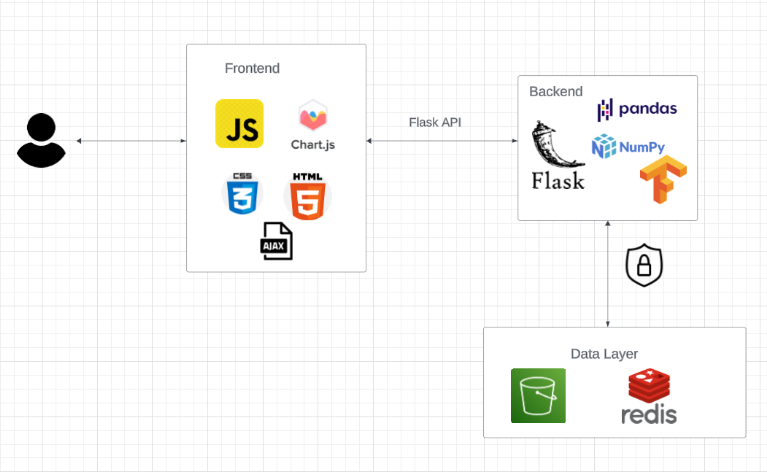
The components of this architecture include:
- Data Collection Data is collected from various third party REST API sources. We will be focusing on flight monitoring data, fuel & sector emissions data, and CO2 emissions generated from electricity consumption. For the purposes of this project, the region for all the data components will be restricted to the USA. The detailed methodologies and data source links to extract data are listed below: a. Air Traffic Monitoring & Carbon Emissions Calculation In this task, we will be calculating aggregated carbon emissions generated by daily flight departures in frequently visited US airports. Due to API constraints and limited computational resources, we have shortlisted 30 domestic/international airports that have a high air traffic around the year and we will be focusing solely on US domestic departures in these airports.
Process:
The API can fetch daily air traffic data with a delay of 1 day i.e the latest data that will be available today will be that of yesterday. Every time the dashboard is invoked, it will fetch the latest air traffic figures and calculate the carbon emissions generated from them.
Since the data updates daily, the data is cached on the system first time the dashboard is run in the day, for latency optimization.
We build an adjacency graph of flights for monitoring the current air traffic to make sure we are not double counting the carbon emissions.
b. CO2 Emissions Aggregate and C02 coefficients
Process :
Calculate CO2 emissions based on fuel, sector and US states.
Fuel type: Coal, Natural Gas, Petroleums
Sector: Commercial CO2 emissions, Industrial CO2 emissions, Transportation CO2 emissions, Electric power CO2 emissions, Residential CO2 emissions.
Calculate electricity, coal, natural gas and petroleum consumption over the decades and map it with the C02 emissions being generated. Look at factors such as sulfur content, heat content etc. that harm the environment.
Predict future CO2 emissions in different states based on current consumption patterns.
- Data Transformation and Storage The data from the API sources is extracted on lambda functions on a daily basis via Amazon EventBridge. Within these lambda functions, data cleaning, data manipulation and data transformation is done to get the desired results. Furthermore, these calculations are stored in Amazon S3 in a JSON format. As part of our data management strategy, we are in the process of storing this data in an S3 bucket. This approach not only facilitates data storage and management but also allows us to implement caching mechanisms to minimize unnecessary API calls. We are storing the data from our APIs in S3 buckets. Storing API data in S3 buckets in JSON format benefits our project in multiple ways. It ensures scalability for growing data needs, data durability, efficient management, high availability, cost-effectiveness, and data security. The caching option reduces API calls, improving performance and lowering costs. S3's easy integration with cloud services further enhances our project's functionality.
The following lambda functions have been created:
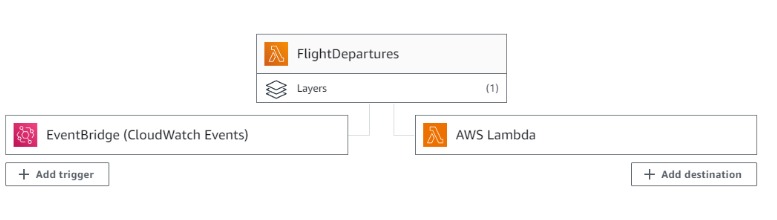
Flight Departure Monitoring The objective of this function is to monitor domestic flight departures in the US via API. It's triggered to run on a daily basis at 12 AM UTC via Amazon EventBridge. The delay of the API information is 1 day and the window is 1 day i.e latest flight departure information from day after to yesterday is obtained.
Flight Emissions Calculation The objective of this function is to calculate the carbon emissions associated with the flight journeys in the US that we obtained from the previous function. It is triggered to run on a daily basis after the successful completion of the flight departures monitoring lambda function. This data can help us in visualizing the carbon emissions generated in the atmosphere in the US from just domestic flights.
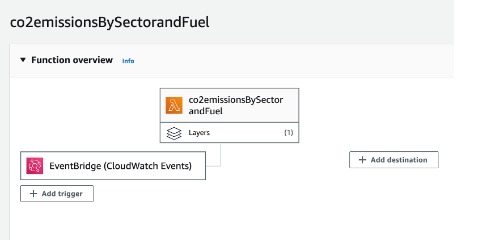
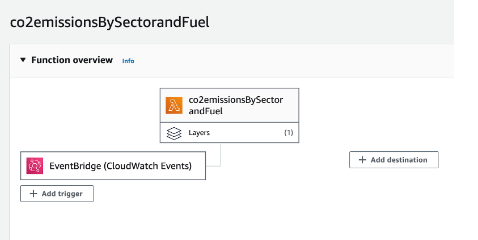
CO2 aggregate emissions by sector and fuel The objective of this function is to collect the CO2 emissions from different sectors and the fuel responsible for that emission for multiple states and regions in the US and analyze how that data and CO2 emissions has been varying over the decades.
Challenges we ran into
- Issues with external API - downtime
- Lambda function integration - library dependencies conflicts
- Methodology to calculate carbon emissions from flights monitoring data
- Dynamically rendering chart.js plots on Flask frontend using JavaScript asynchronous functions
Accomplishments that we're proud of
We have implemented the following two features on the dashboard:
Flight Emissions a. Total CO2 emissions generated in the last 6 months b. Total flights departed in last 6 months c. Monthly Aggregate Emissions from US flight departures d. Weekly Aggregate Emissions from US flight departures e. Maximum and Average Carbon Emissions on a monthly basis f. Airport Aggregate Emissions of top 10 airports with largest flight traffic g. Comparison of top 3 airports with largest amount of flight traffic and emissions generation on a monthly basis. h. Monthly distance covered by flights. i. Airport monthly statistics (total emissions) by month of top 10 airports with largest flight traffic and emissions generation.
Sector & Fuel Emissions a. The dashboard is interactive based on the fuel type chosen - All fuels, Coal, Petroleum, Natural Gas. b. CO2 Emissions calculation based on fuel, sector and US state. c. US Region statistics of carbon emissions based on fuel type chosen. d. Sector statistics (All sectors, Residential, Industrial, Commercial) based on fuel type chosen. e. Sector emissions generation on a yearly basis. f. Individual insights of carbon emissions generated by different fuel types from 1970 to 2021. g. Comparison of fuel emissions in the last 10 years.
NGO Interface a. Built an interface to influence sustainable and environmentally responsible initiatives on a government and organizational level, and direct funds to the right cause. b. This would educate the public on the ongoing climate change crisis through the massive amounts of carbon emissions being generated daily, and influence them to take sustainable actions on an individual/community level by collaborating with non-profit environmental organizations.
What we learned
We learned how to use the following services:
- AWS S3, EventBridge and Lambda
- chart.js for rendering charts
- Redis for caching and optimization
- AJAX for dynamic content retrieval
- UI - HTML/CSS/JavaScript
- Building end-to-end Flask application
What's next for ClimateGuard
As part of future work, we would like to incorporate the following characteristics:
- Build a comprehensive and interactive dashboard which provides a centralized platform to visualize carbon emissions from various sectors such as flights, fuel, websites, cloud platforms, electricity generation, vehicles, etc.
- Build a real time streaming data pipeline that automatically extracts latest data from all our sources on an hourly/daily basis.
- Incorporate predictive analytics and time series forecasting models in our dashboard.
- Calculate the impact of CO2 emissions on the environment by assessing the meteorological patterns of different US locations such as heatwaves, floods and glacier melts, and ecological imbalances.
- Integrate green solutions and alternatives on common carbon emission generating activities and provide social benefits to citizens who incorporate these green choices.


Log in or sign up for Devpost to join the conversation.