The question behind ClimateChain BD
Sylhet's June 2024 floods showed how quickly heavy monsoon rainfall can become displacement, damaged homes, and urgent relief needs. They also exposed a quieter problem: the evidence behind climate decisions is often scattered, opaque, or impossible to audit after the fact.
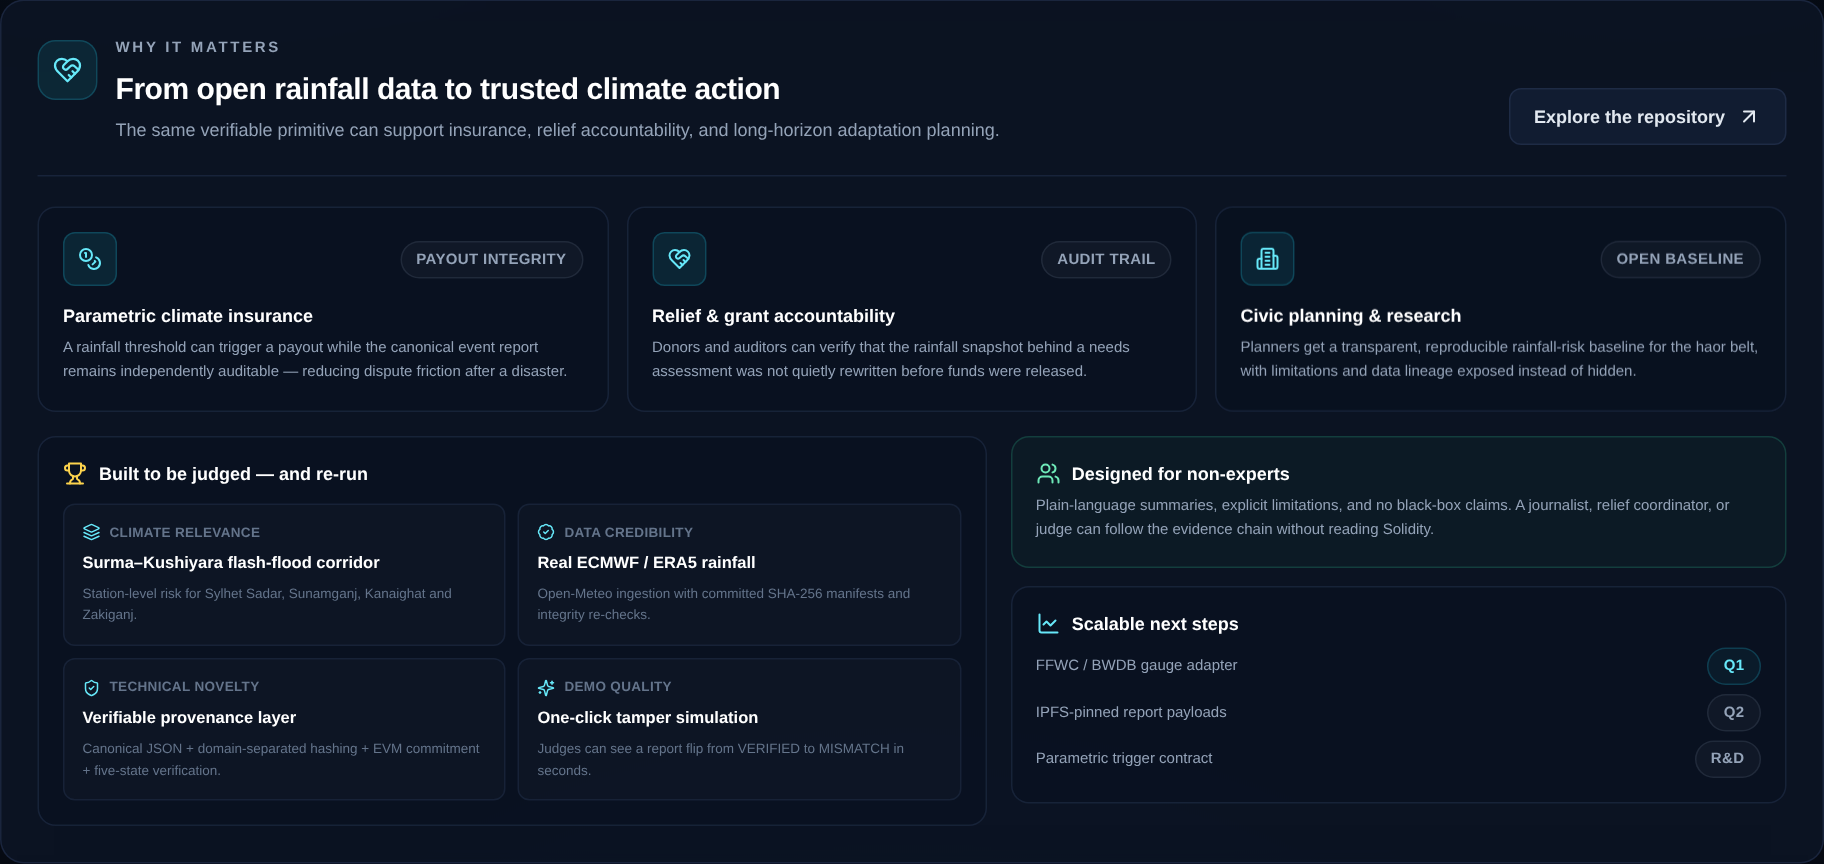
If a rainfall report can trigger an insurance payout or release relief funding, how does anyone know the report was not changed later? Most dashboards show a score. Very few let an outsider check the data lineage, recompute the result, or see whether the system is honest about what it does not know.
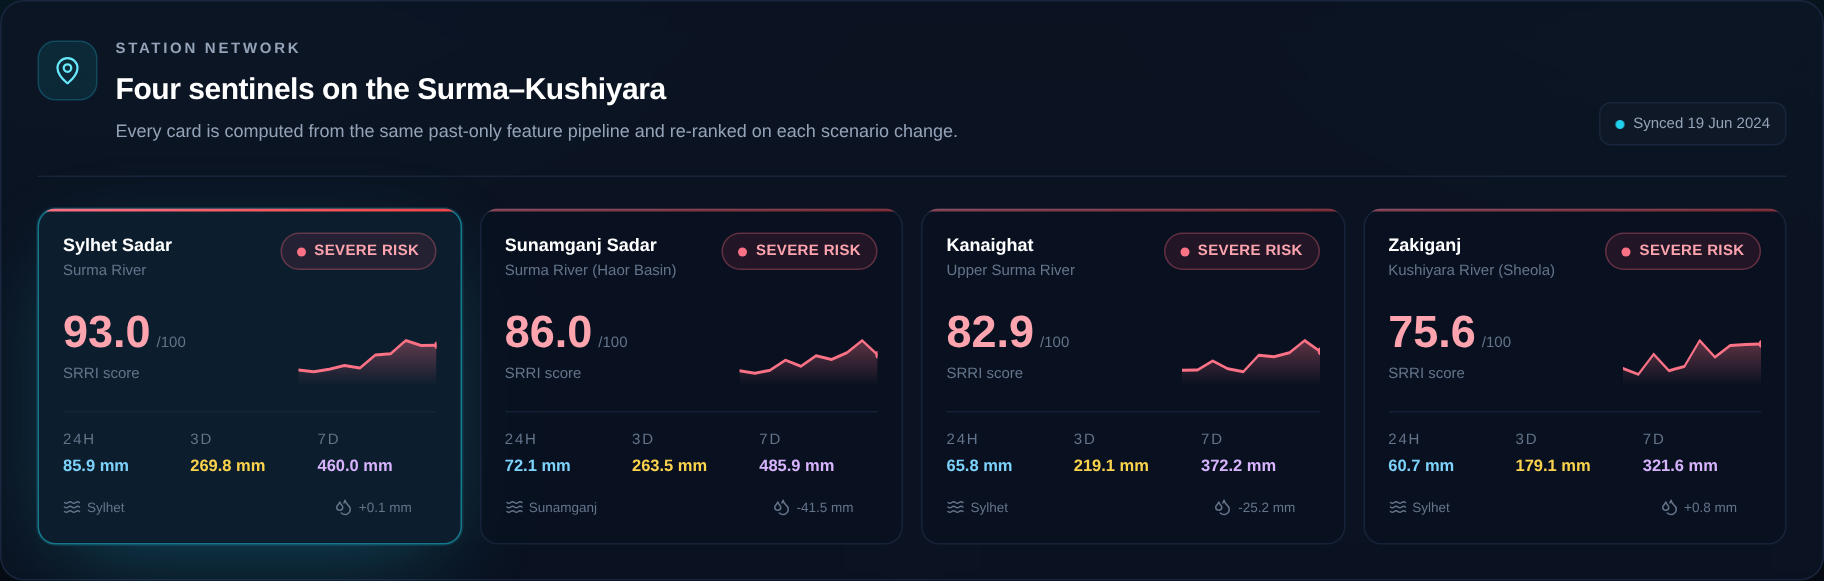
ClimateChain BD is my attempt to close that trust gap for four stations in the Surma–Kushiyara basin: Sylhet Sadar, Sunamganj Sadar, Kanaighat, and Zakiganj.
What it does
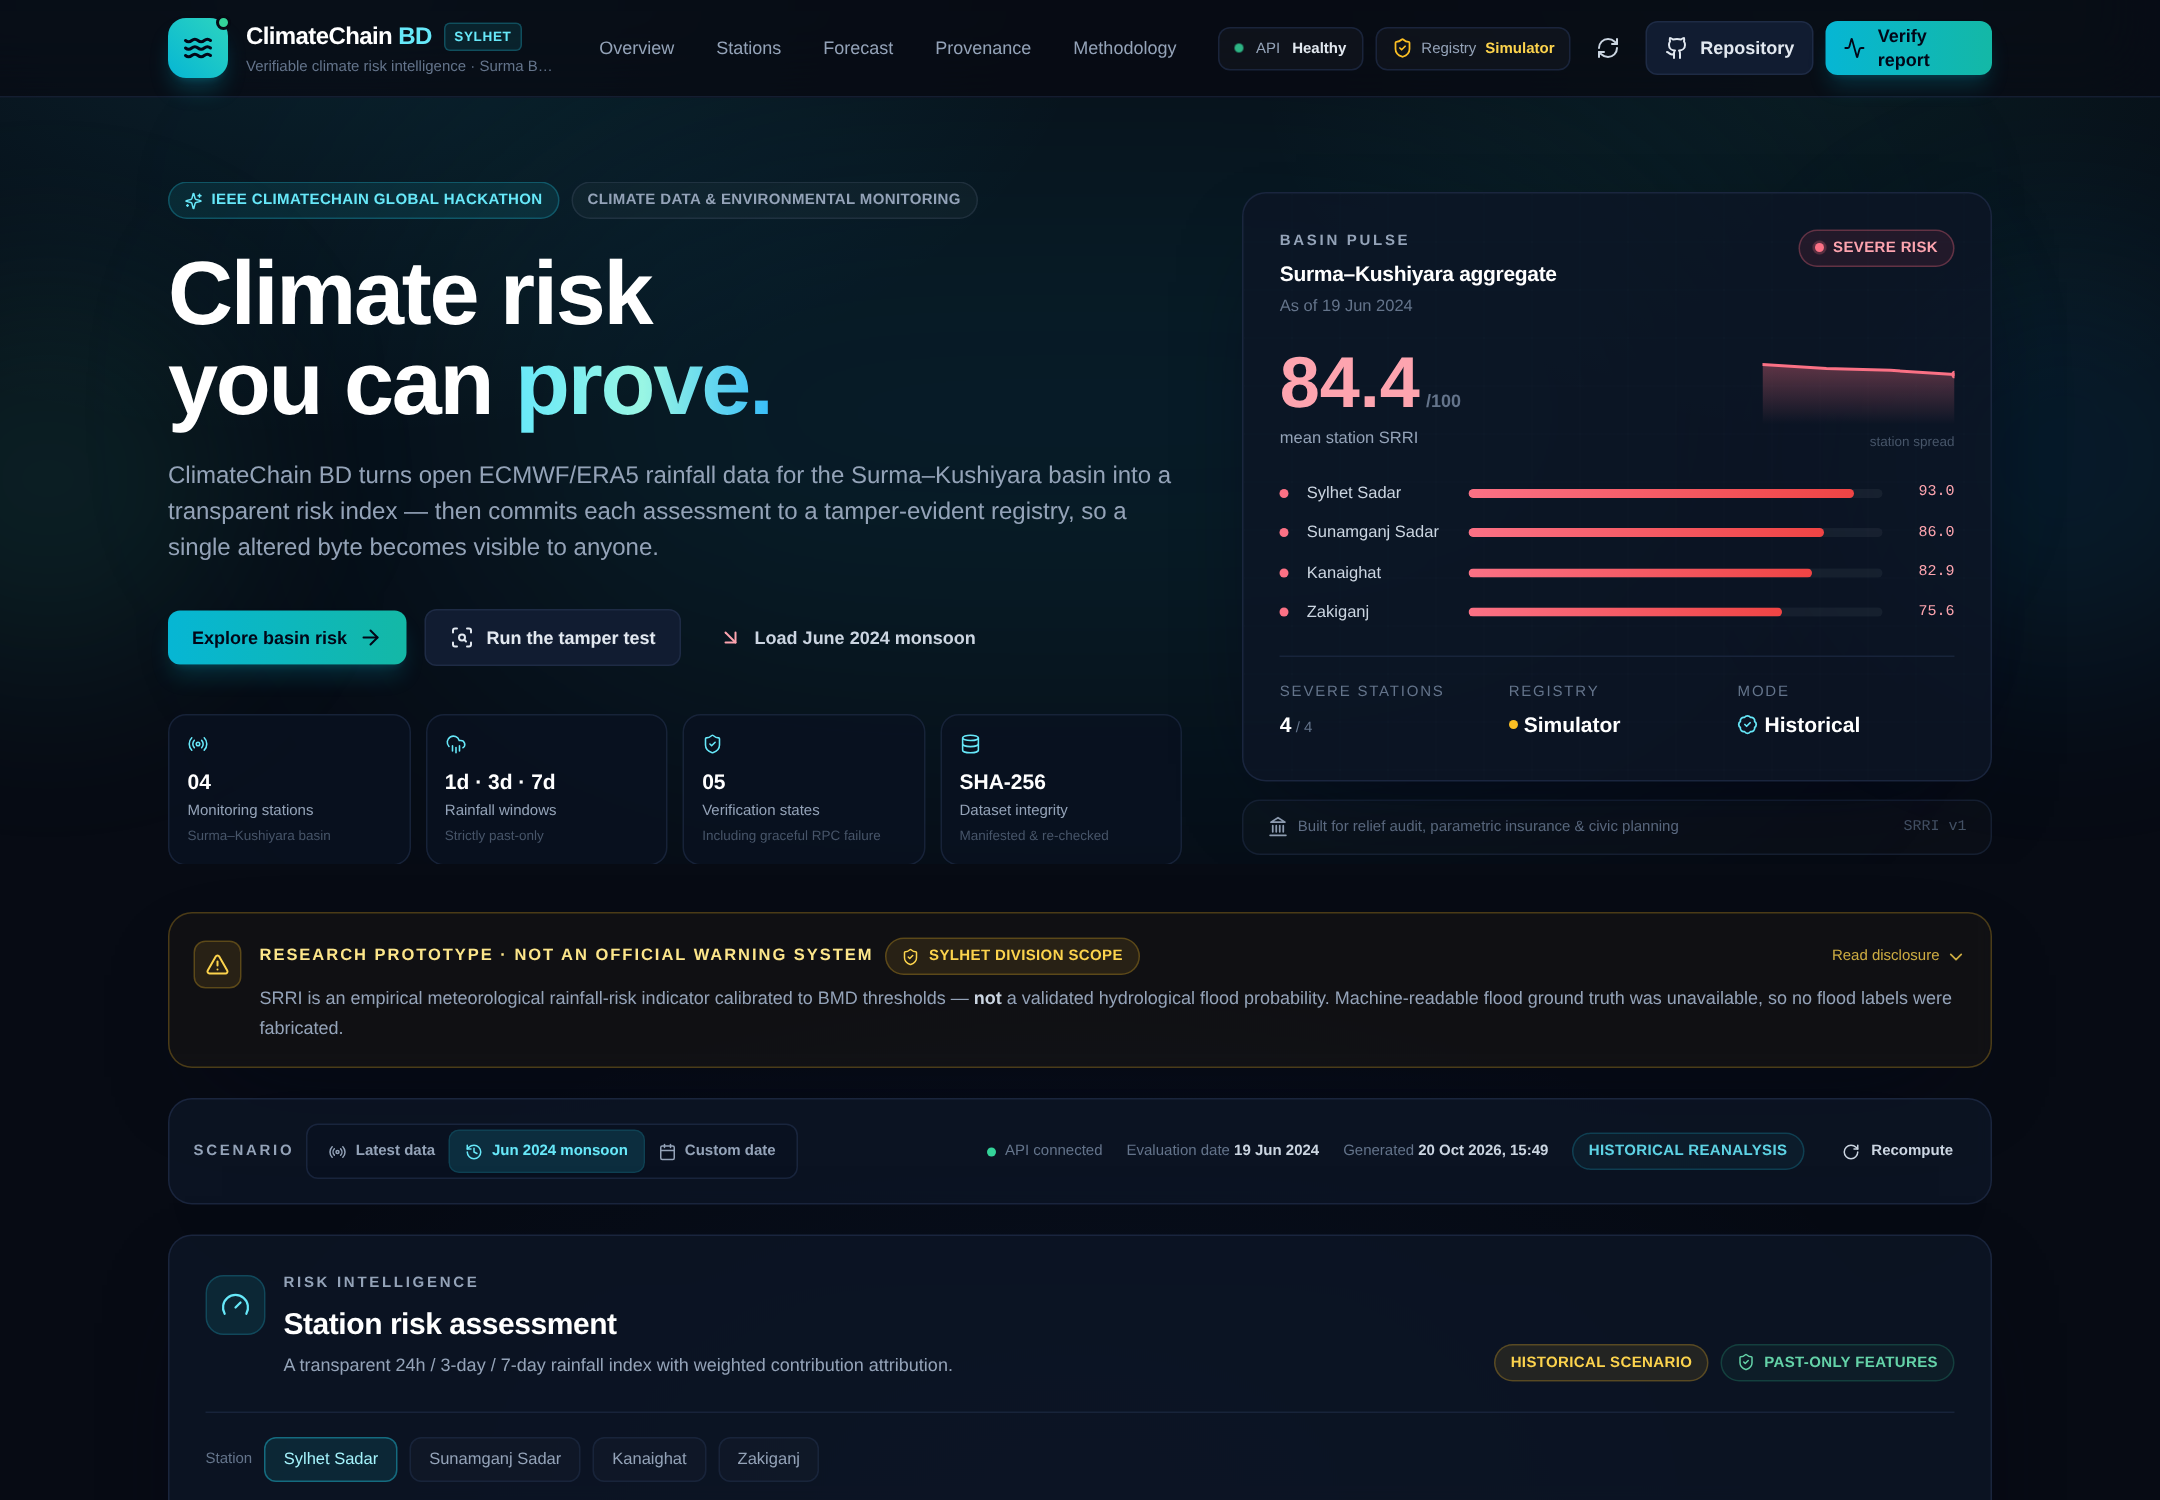
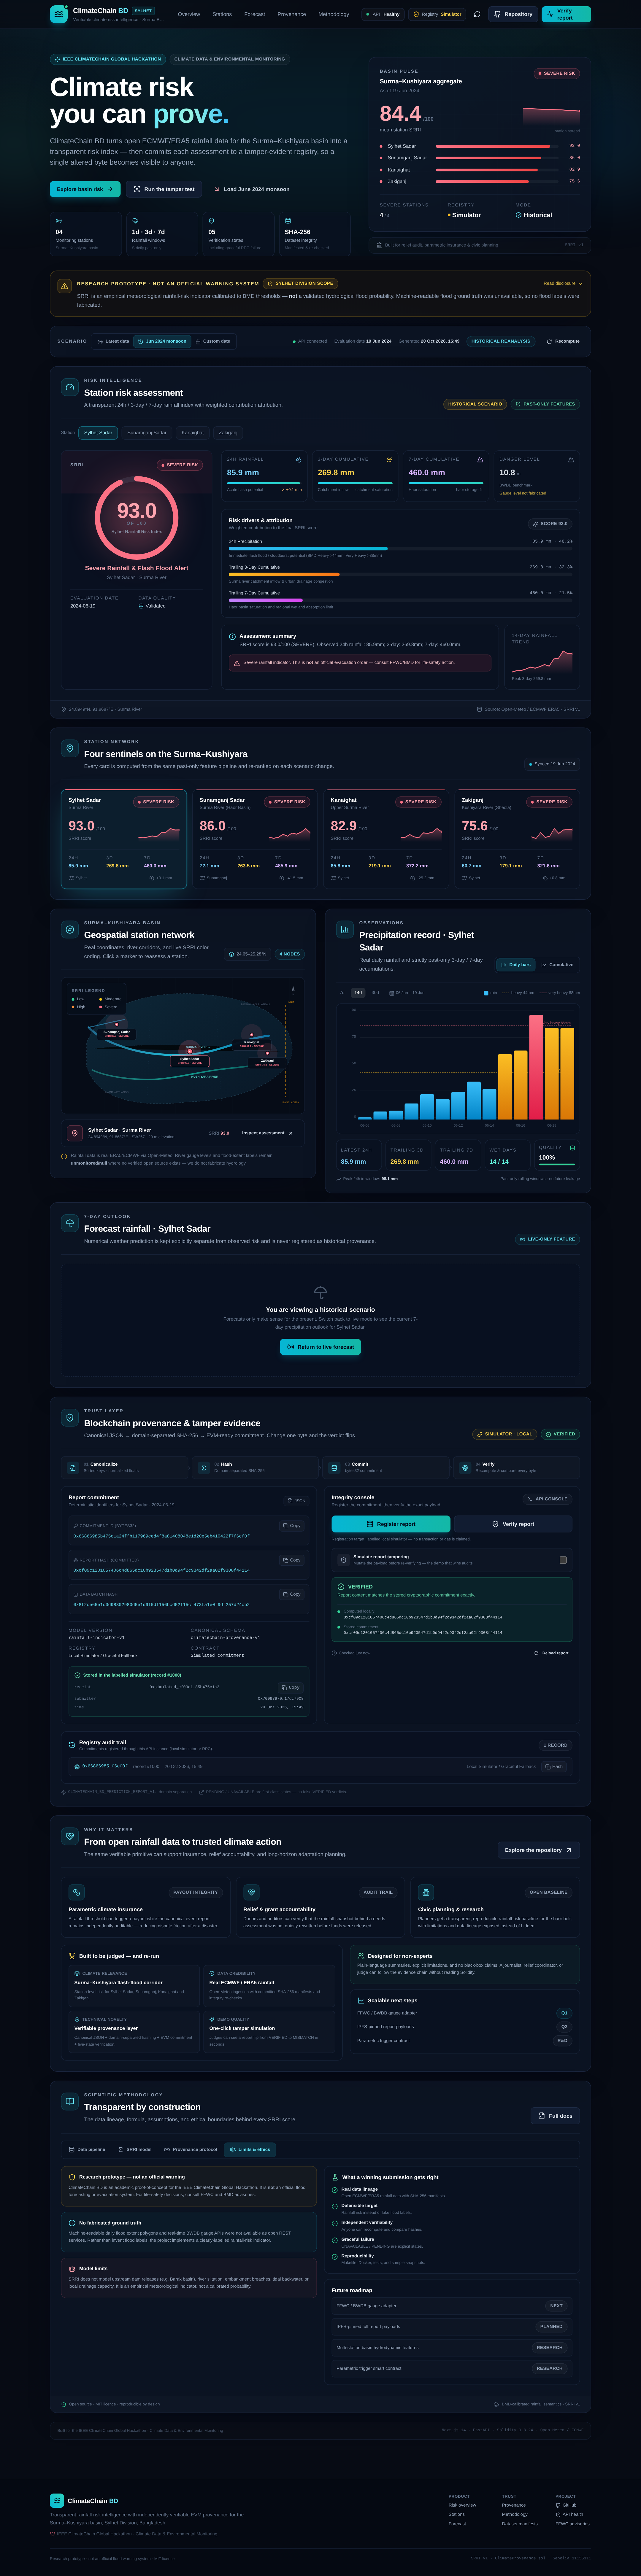
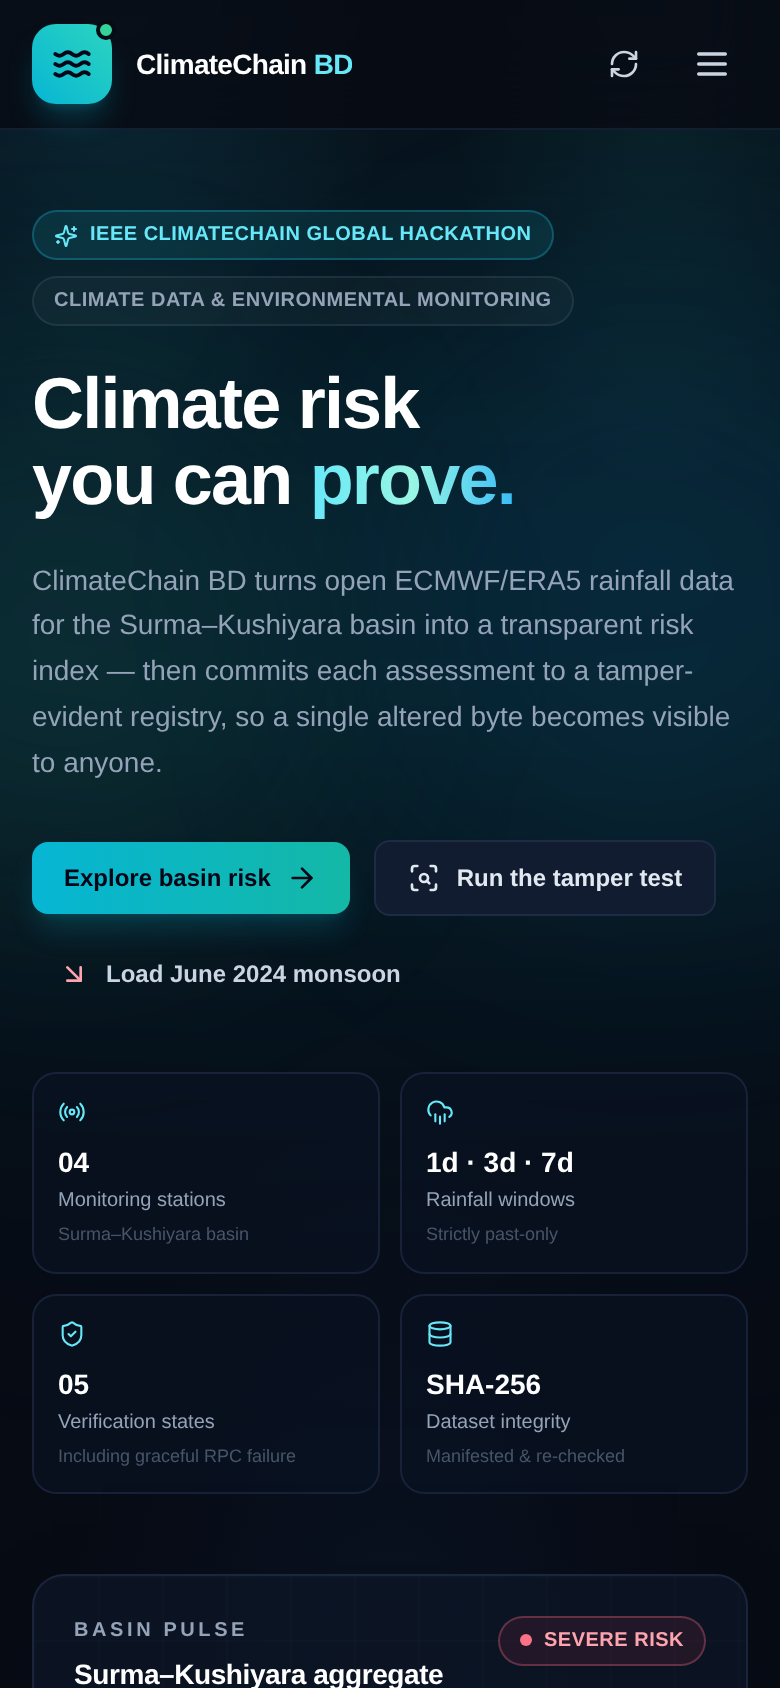
ClimateChain BD turns open ECMWF/ERA5 rainfall data into a transparent rainfall-risk assessment, then makes that assessment tamper-evident.
- Scenario replay: latest available data, the 19 June 2024 monsoon, or any custom historical date.
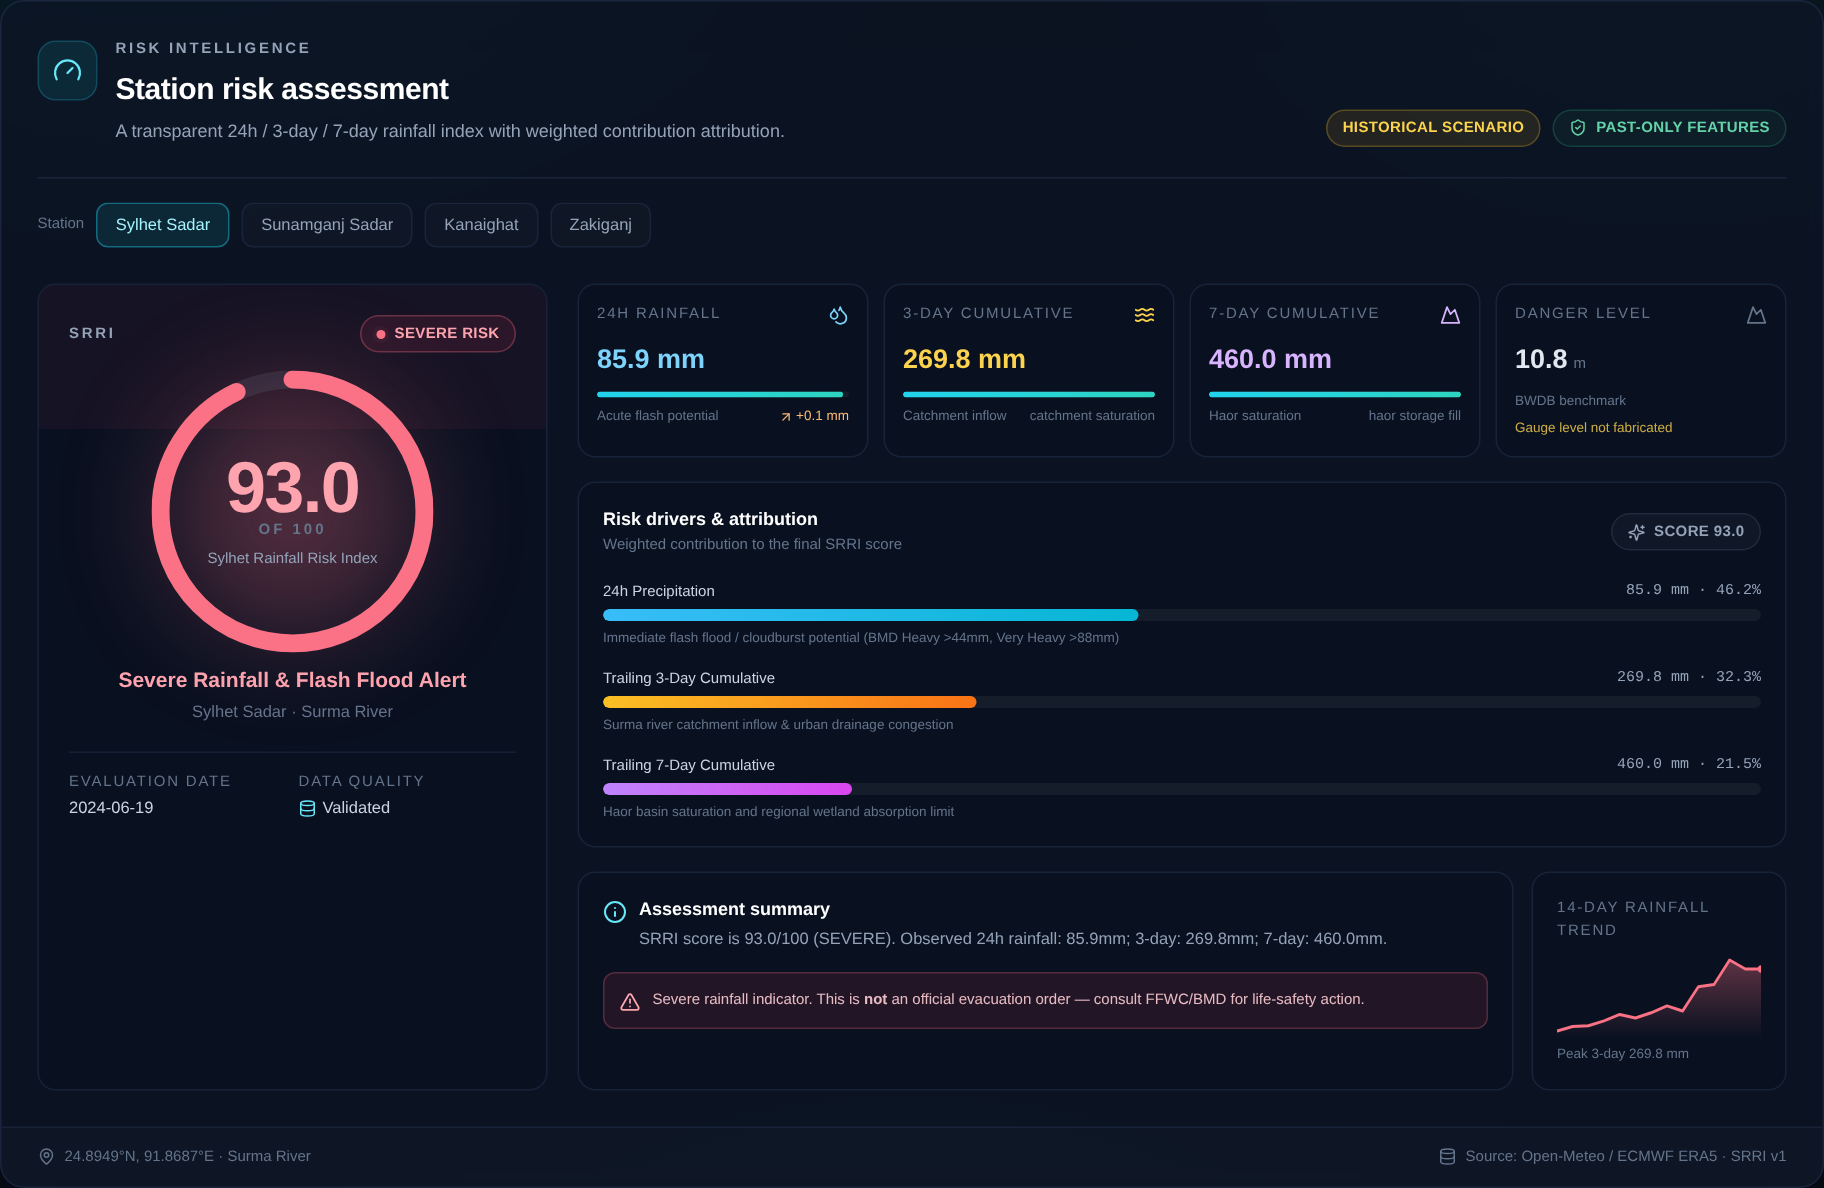
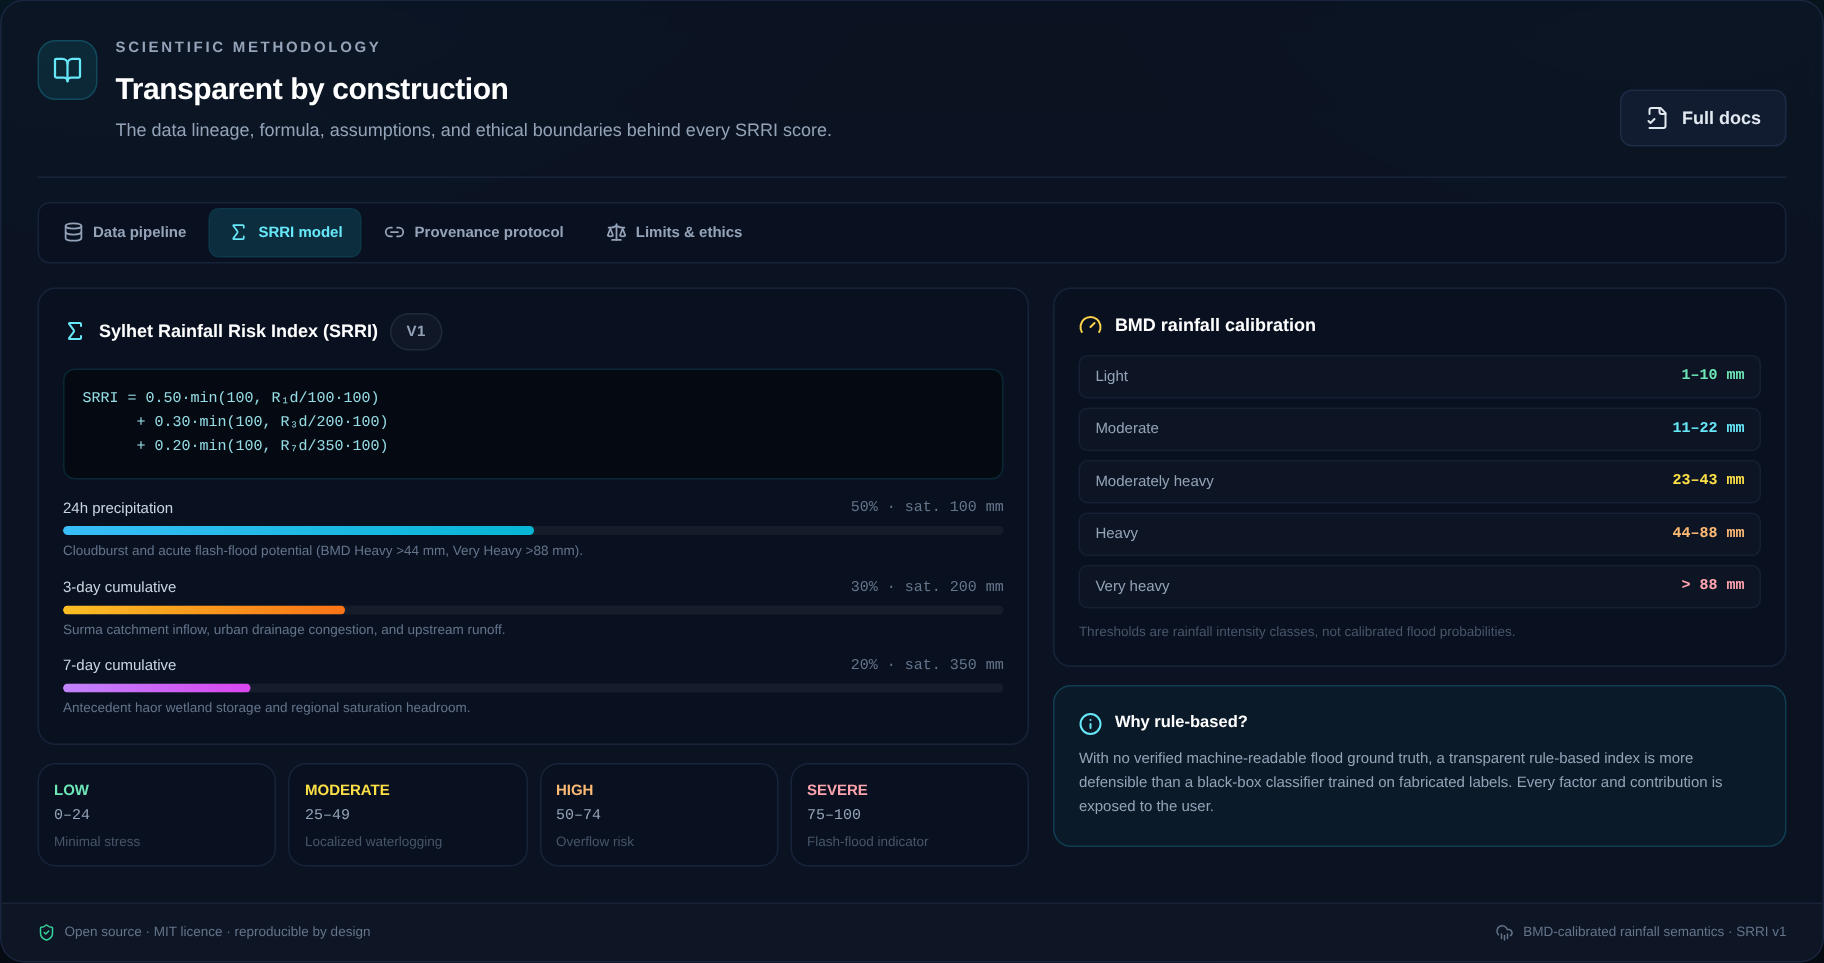
- Station-level SRRI: an explainable 0–100 index built from 24-hour, 3-day, and 7-day rainfall.
- Basin overview: four stations ranked together, with an aggregate basin score.
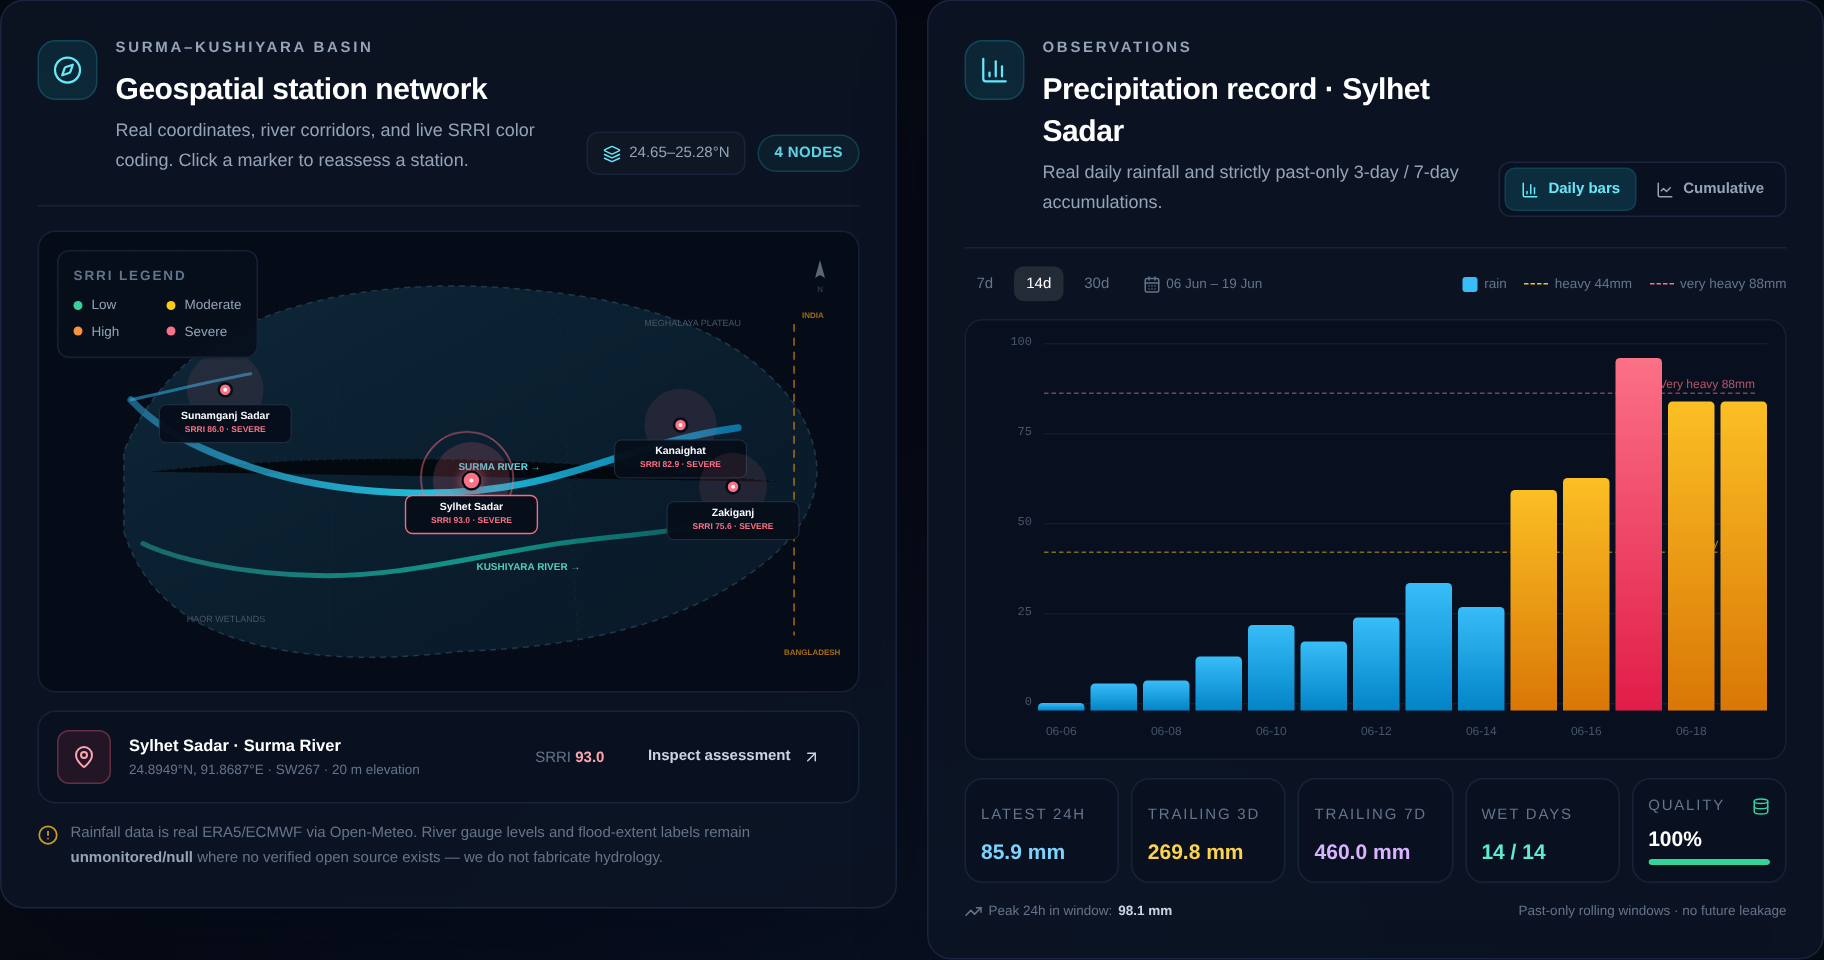
- Evidence panel: daily rainfall chart, interactive basin map, past-only trend, and data-quality state.
- Forecast separation: a live 7-day outlook that is explicitly excluded from historical provenance.
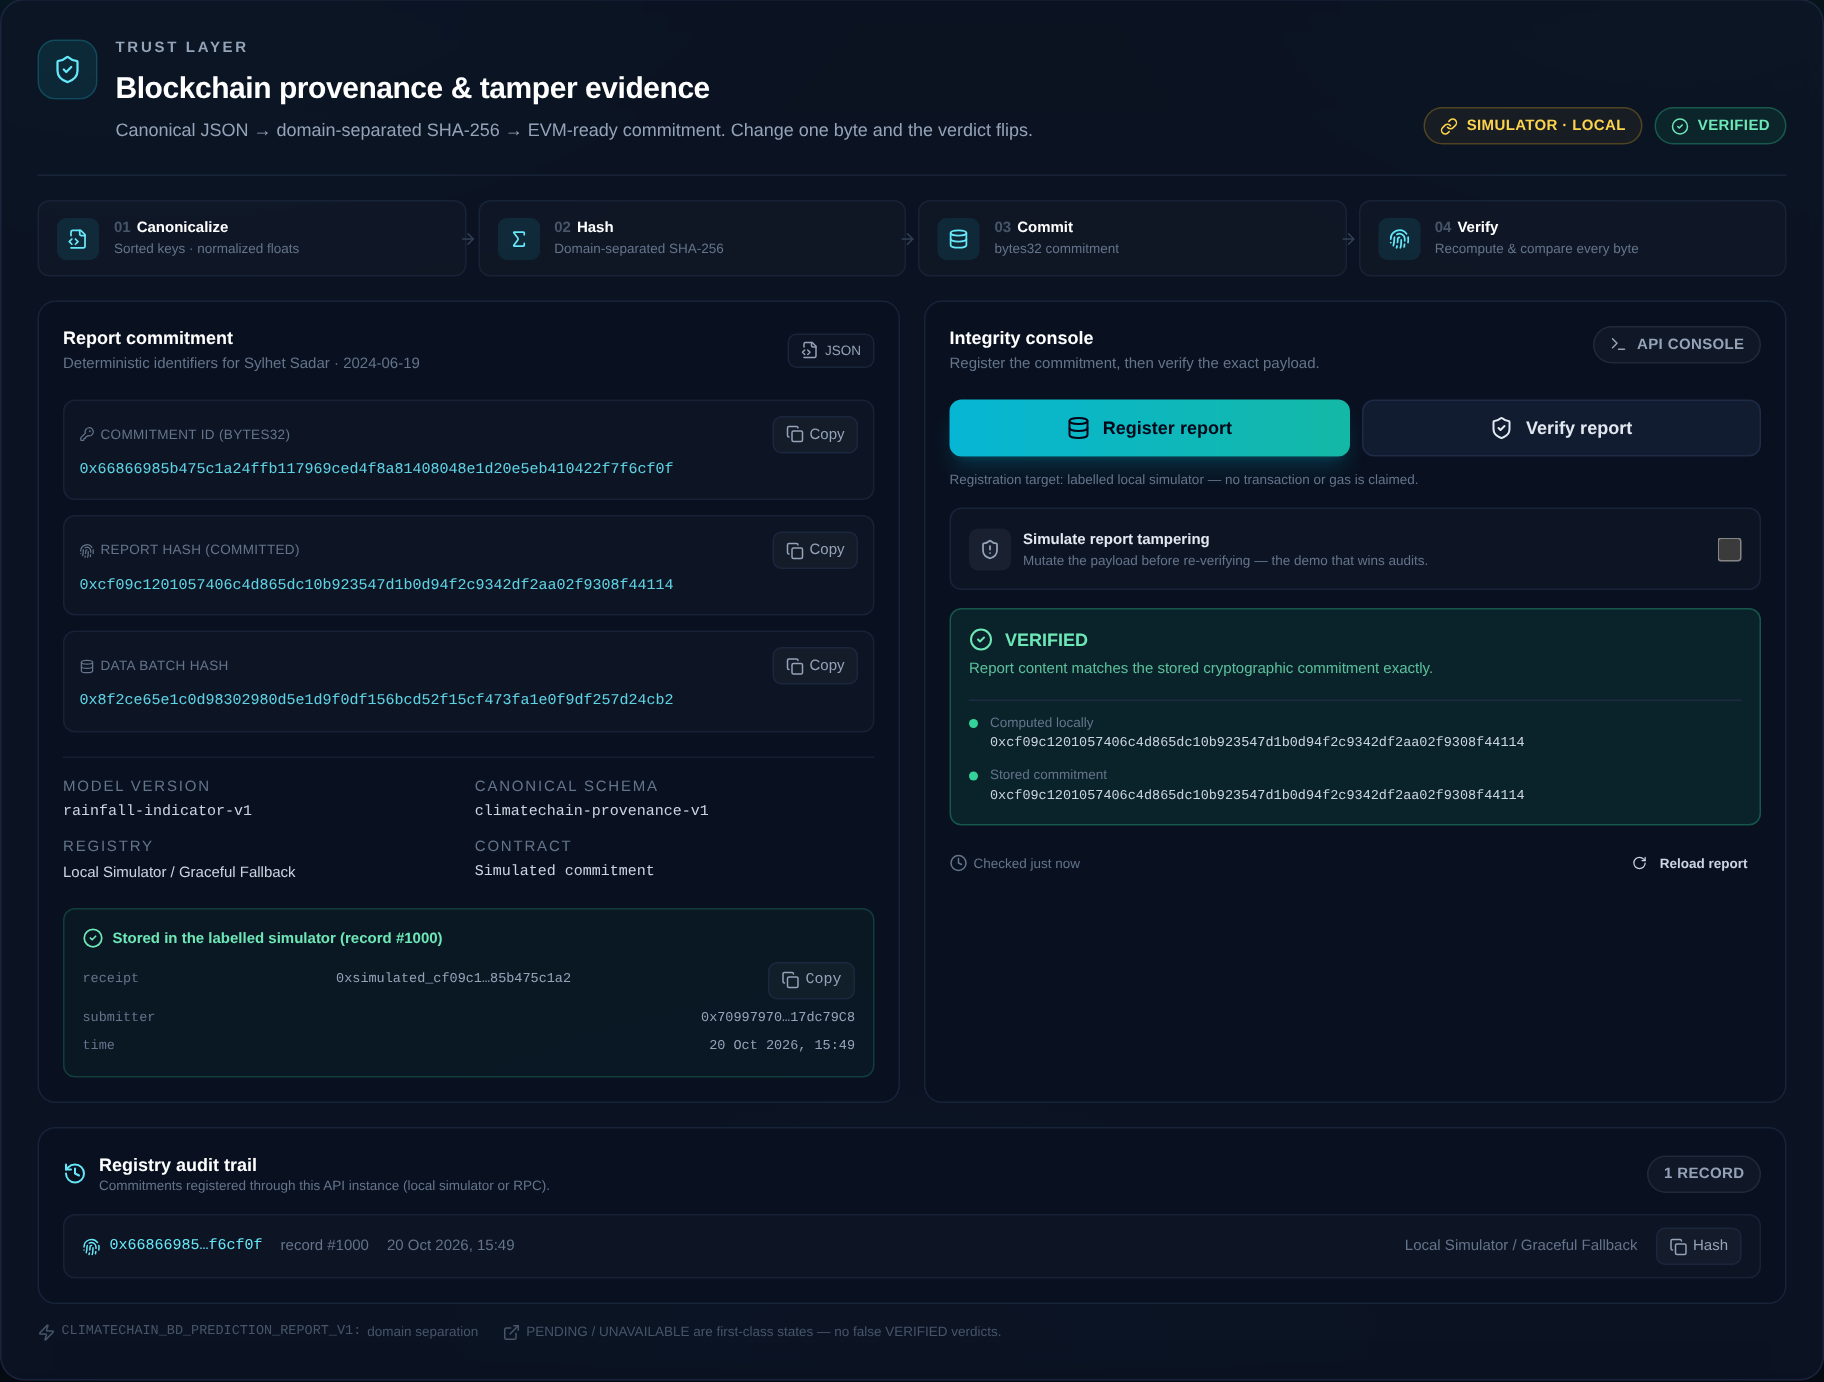
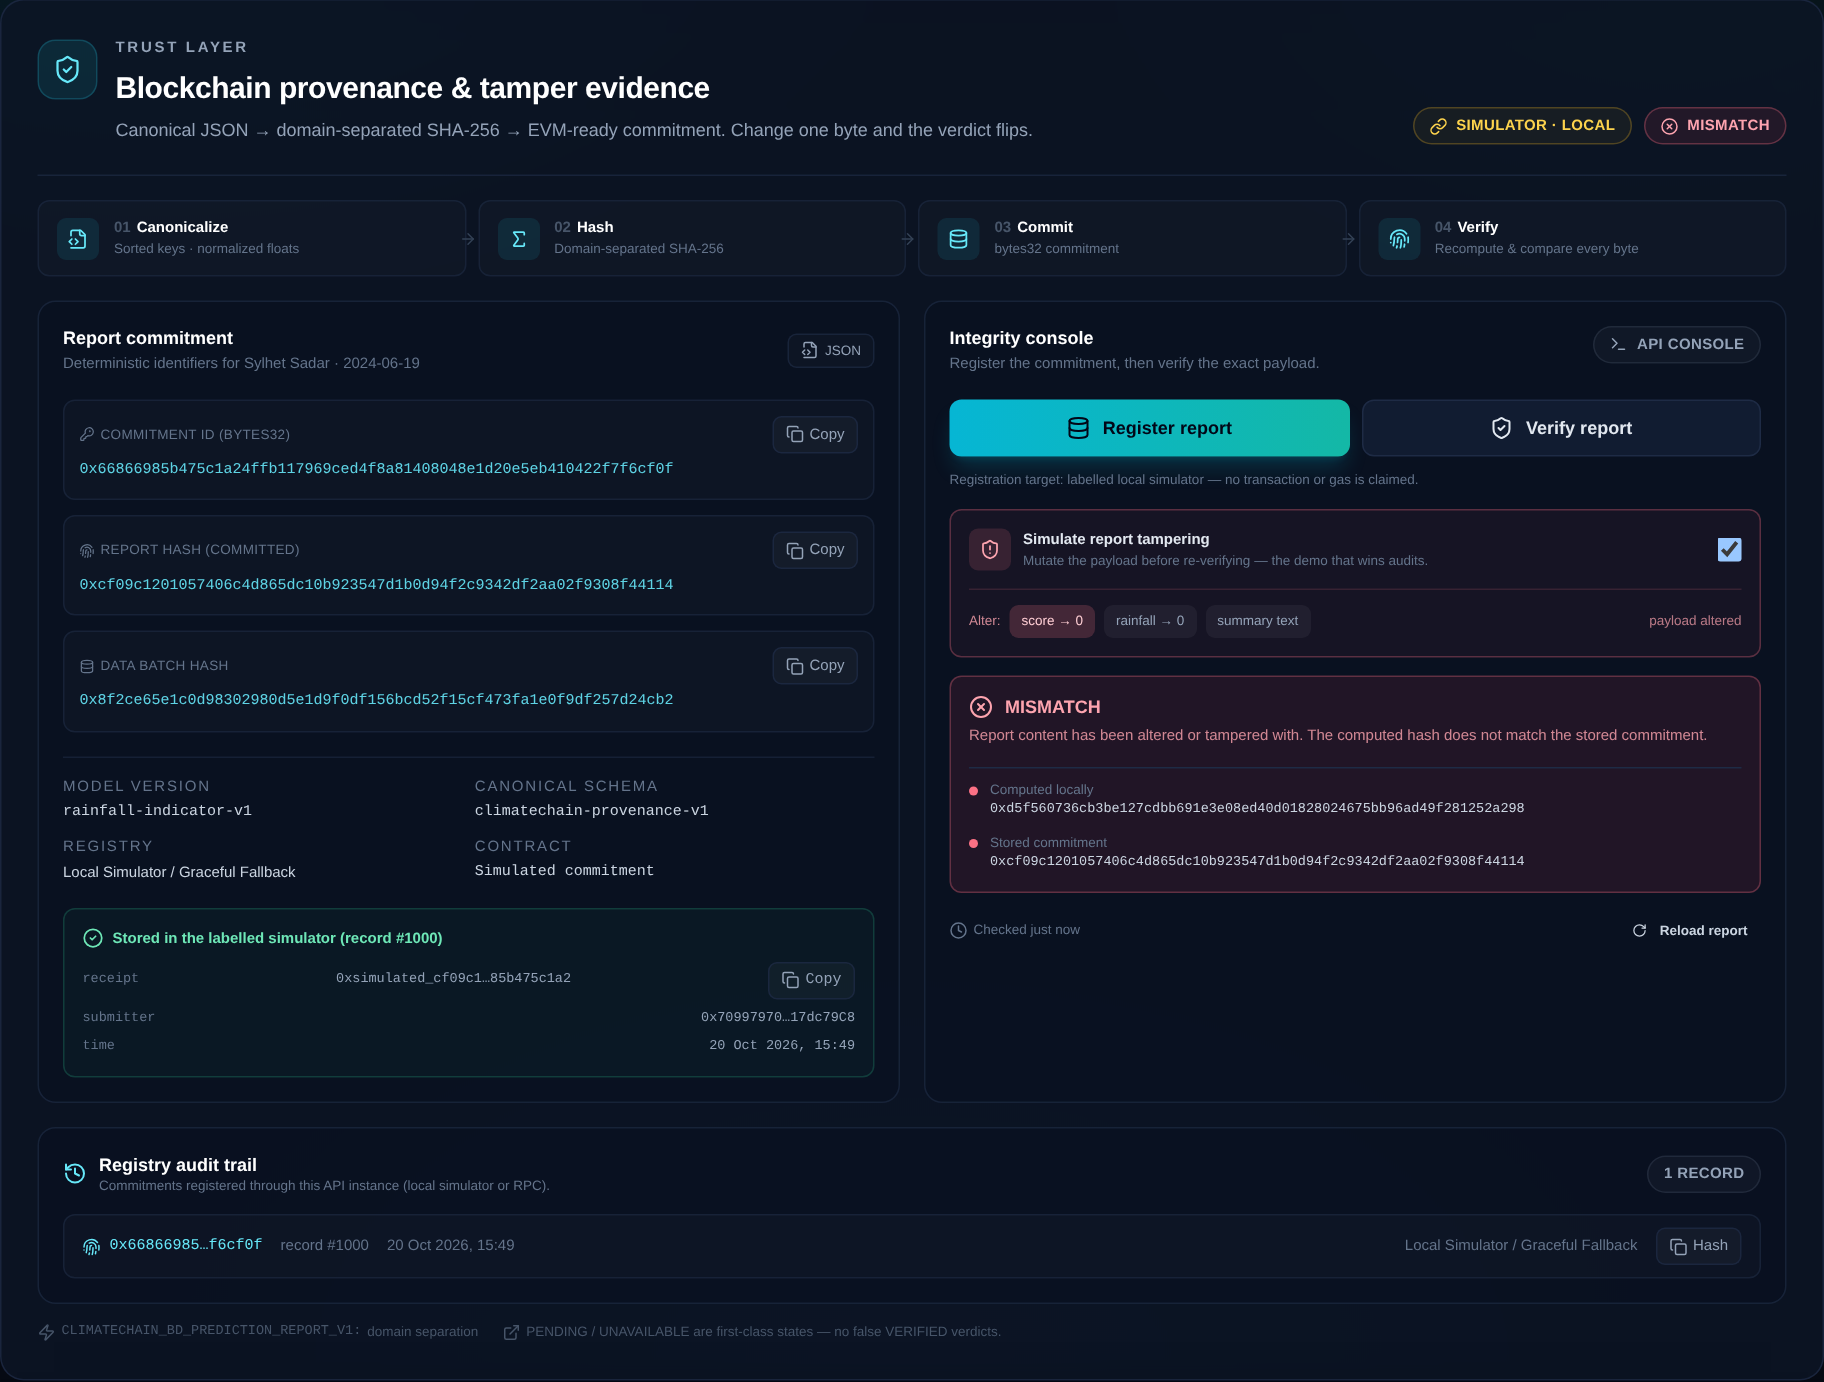
- Provenance console: canonical JSON, SHA-256 commitments, registry verification, audit trail, and a one-click tamper test.
The core is the Sylhet Rainfall Risk Index (SRRI):
$$ \mathrm{SRRI}=\min\left(100,\;0.50\,C_{1d}+0.30\,C_{3d}+0.20\,C_{7d}\right) $$
where
$$ C_{1d}=\min(100,R_{1d}),\quad C_{3d}=\min\left(100,\frac{100R_{3d}}{200}\right),\quad C_{7d}=\min\left(100,\frac{100R_{7d}}{350}\right). $$
$R_{1d}$ is 24-hour rainfall, $R_{3d}$ is the trailing 3-day sum, and $R_{7d}$ is the trailing 7-day sum. The weights reflect acute cloudburst potential, catchment saturation, and antecedent haor storage. The score is capped at 100 and mapped to LOW, MODERATE, HIGH, or SEVERE.
Replaying 19 June 2024 produces a basin SRRI of 84.4 / SEVERE, with Sylhet Sadar at 93.0 — a snapshot that can be inspected factor by factor rather than accepted as a black-box number.
How I built it
I built the project as four deliberately separated layers.
1. Open data ingestion
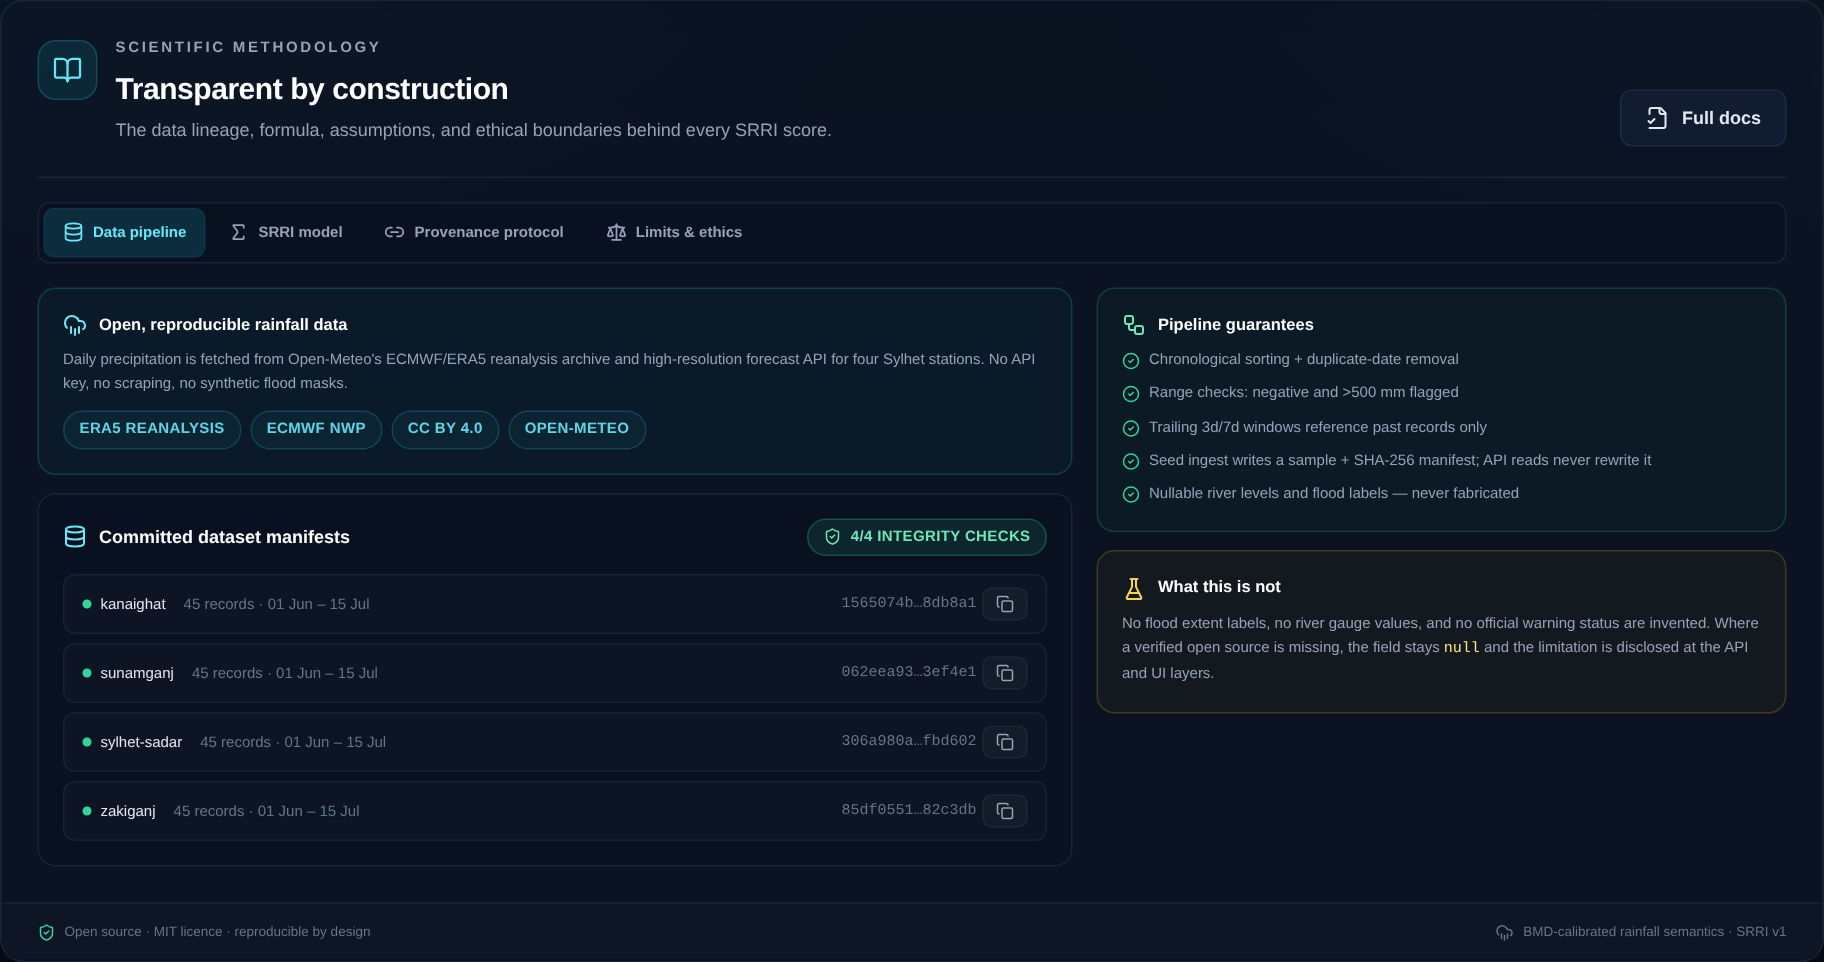
Daily precipitation comes from Open-Meteo's ECMWF/ERA5 archive and forecast APIs. The pipeline validates ranges, removes duplicate dates, sorts records, and computes strictly past-only rolling windows. A TTL cache and a retry path handle upstream rate limits. Committed sample snapshots and SHA-256 manifests make the historical replay reproducible even when the upstream API is unavailable.
Crucially, missing river levels and flood labels stay null. I did not fill them with synthetic values.
2. Explainable risk engine
The Python risk engine computes SRRI, factor contributions, plain-language summaries, basin aggregates, and a separately labelled forecast outlook. Every rolling window references past records only, so there is no future leakage into a historical assessment.
I deliberately chose a transparent rule-based index over a black-box classifier. Without verified machine-readable flood ground truth, a defensible rainfall indicator is more honest than a model trained on invented labels.
3. Product-grade dashboard
The frontend is Next.js 14, TypeScript, and Tailwind CSS. The map and charts are custom SVG components rather than generic embeds, which keeps the visual language consistent and the bundle small. The dashboard includes responsive layouts, skeleton states, keyboard-selectable station markers, reduced-motion support, and a clearly labelled offline fallback.
4. Verifiable provenance
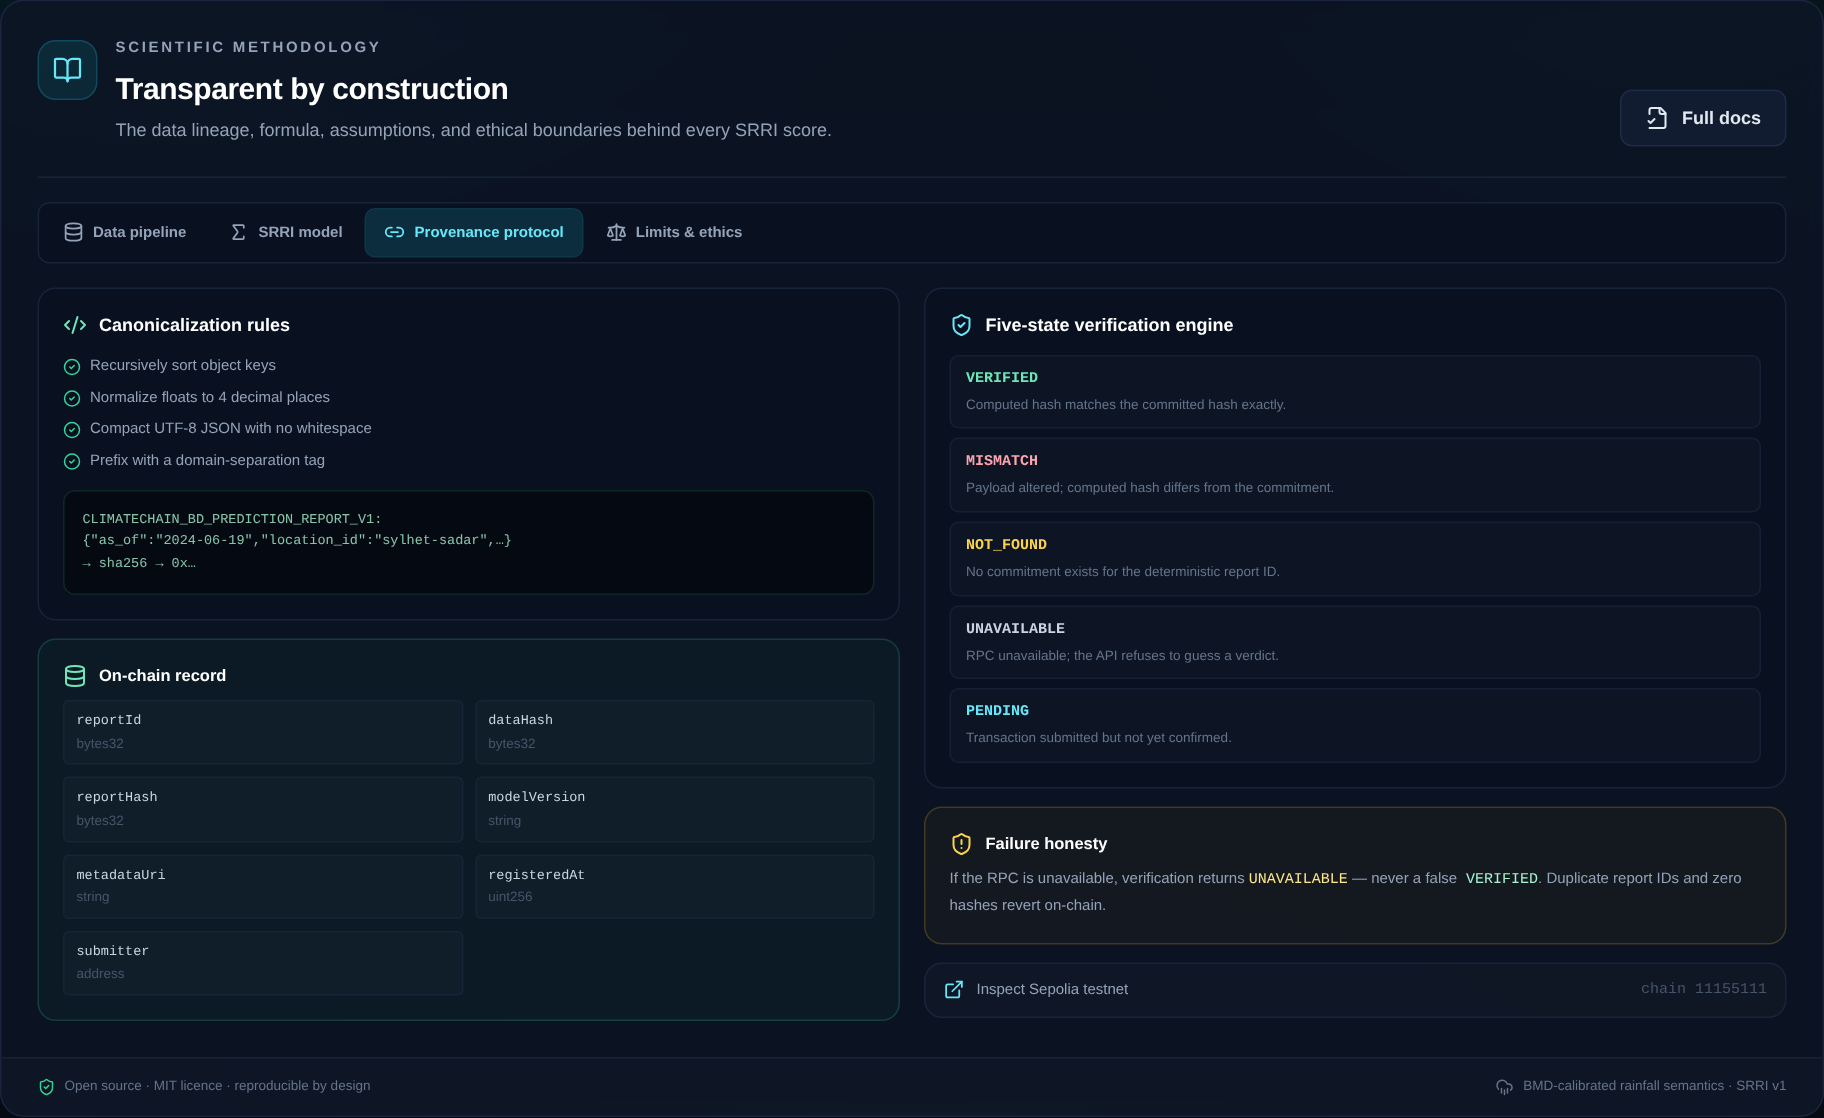
Reports are canonicalised with sorted keys and normalized floats, then hashed with domain-separated SHA-256. The Solidity registry stores report IDs, data hashes, report hashes, model version, metadata URI, timestamp, and submitter. Verification returns one of five explicit states: VERIFIED, MISMATCH, NOT_FOUND, UNAVAILABLE, or PENDING.
The same code can submit to Sepolia when an RPC, contract, and signer are configured. Without them, it uses a clearly labelled local simulator, so the workflow can be demonstrated without pretending a transaction happened.
The application is packaged with a multi-stage Dockerfile, a Render blueprint, Docker Compose, and automated tests: 22 Python tests, 10 Hardhat contract tests, and a dataset integrity check that reports 4/4 manifests intact.
The hard parts
No ground truth, so no fake labels
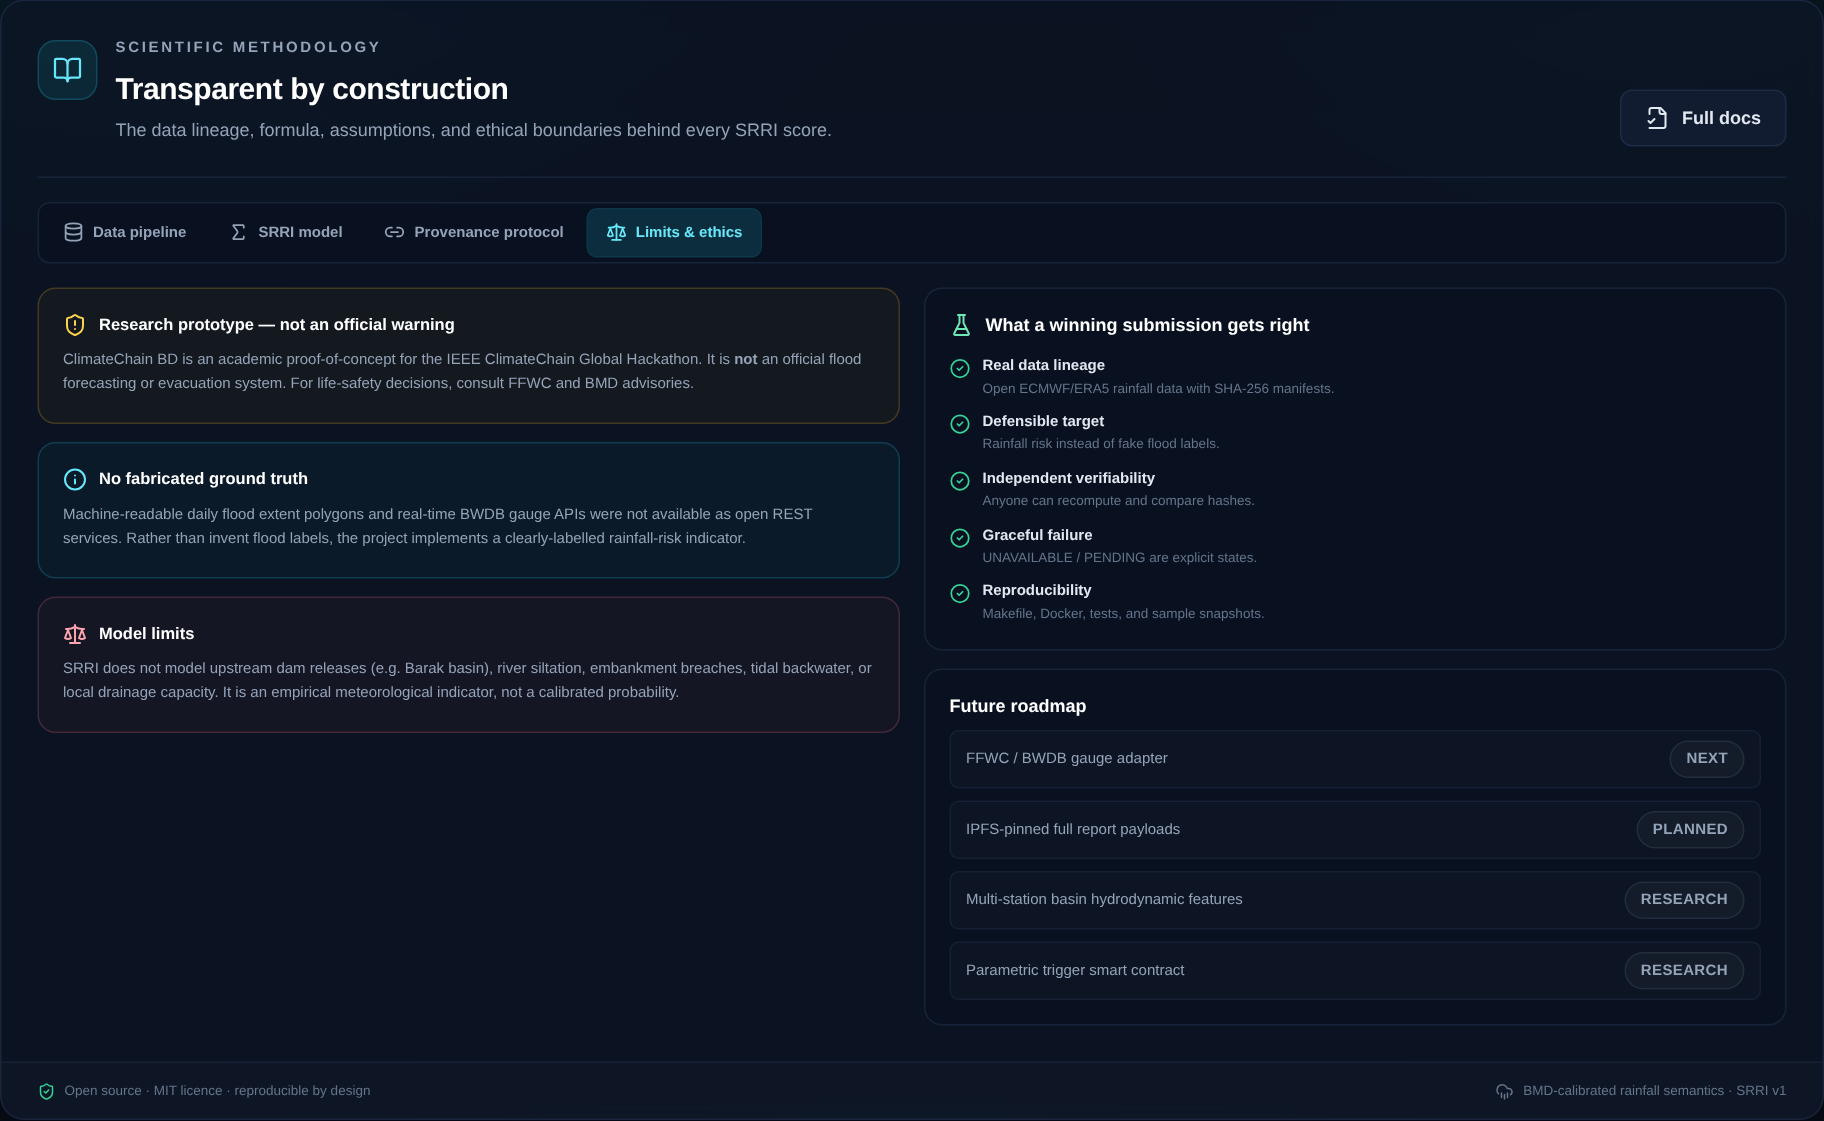
The biggest constraint was the absence of open, verifiable daily flood-extent labels and real-time BWDB gauge APIs. The tempting shortcut was to generate synthetic flood labels and train a classifier. I chose not to. The project is explicitly a rainfall-risk indicator, with its limitations visible in the UI, API, and documentation.
Making failure honest
A blockchain integration is only trustworthy if it refuses to guess. If the RPC is unreachable, verification returns UNAVAILABLE; if no commitment exists, it returns NOT_FOUND; if one byte changes, it returns MISMATCH. A failed request must never become a false VERIFIED.
Separating observations from forecasts
Forecasts are useful, but they are not historical evidence. The dashboard labels forecast values as model output and excludes them from provenance registration and historical replay. This keeps the evidence chain clean.
Data reliability and reproducibility
Open APIs rate-limit, time out, and occasionally return incomplete records. The ingestion layer handles these cases with retries, caching, quality flags, and a committed offline snapshot that is clearly marked as cached rather than live.
What I learned
The hardest part was not the hash function or the chart. It was deciding what not to claim.
I learned that transparency has to be an engineering requirement, not a paragraph in a README. It appears in the data-quality labels, the five verification states, the nullable fields, the forecast separation, and the simulator disclosure. I also learned that data engineering matters as much as the model: a defensible result depends on clean lineage, past-only windows, and reproducible inputs.
Most of all, I learned that a failure state can be a feature when it prevents a false claim.
Scientific honesty
SRRI is an empirical meteorological rainfall-risk indicator. It is not a calibrated flood probability, an official warning, or a replacement for FFWC/BMD guidance. Where verified open river-gauge or flood-extent data was unavailable, the fields remain null. Forecast values are labelled as model output and excluded from provenance. When no signer is configured, the registry runs in a clearly labelled simulator mode; no on-chain transaction is claimed.
For life-safety decisions, consult the Flood Forecasting and Warning Centre (FFWC) and the Bangladesh Meteorological Department (BMD).
What's next
- Integrate a verified FFWC/BWDB gauge adapter.
- Pin full report payloads to IPFS.
- Add multi-station basin and upstream-flow features.
- Prototype a parametric trigger contract with audited payout conditions.
- Validate the index with local hydrologists and disaster-response practitioners.
The goal is not to replace official warnings. It is to make climate-risk evidence independently checkable.
Try it
The repository includes the full API, dashboard, smart contract, committed data samples, Docker setup, test suites, model card, architecture notes, threat model, and demo script.
- Code: github.com/ragibcs/climatechain-bd
- Documentation: docs/


Log in or sign up for Devpost to join the conversation.