-
-
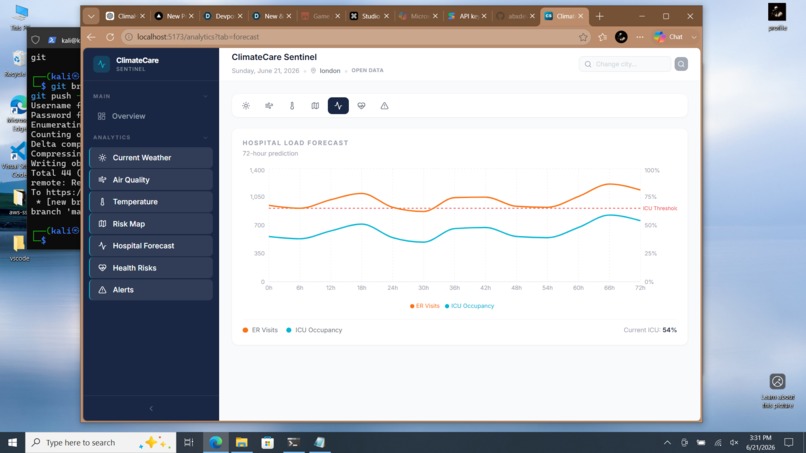
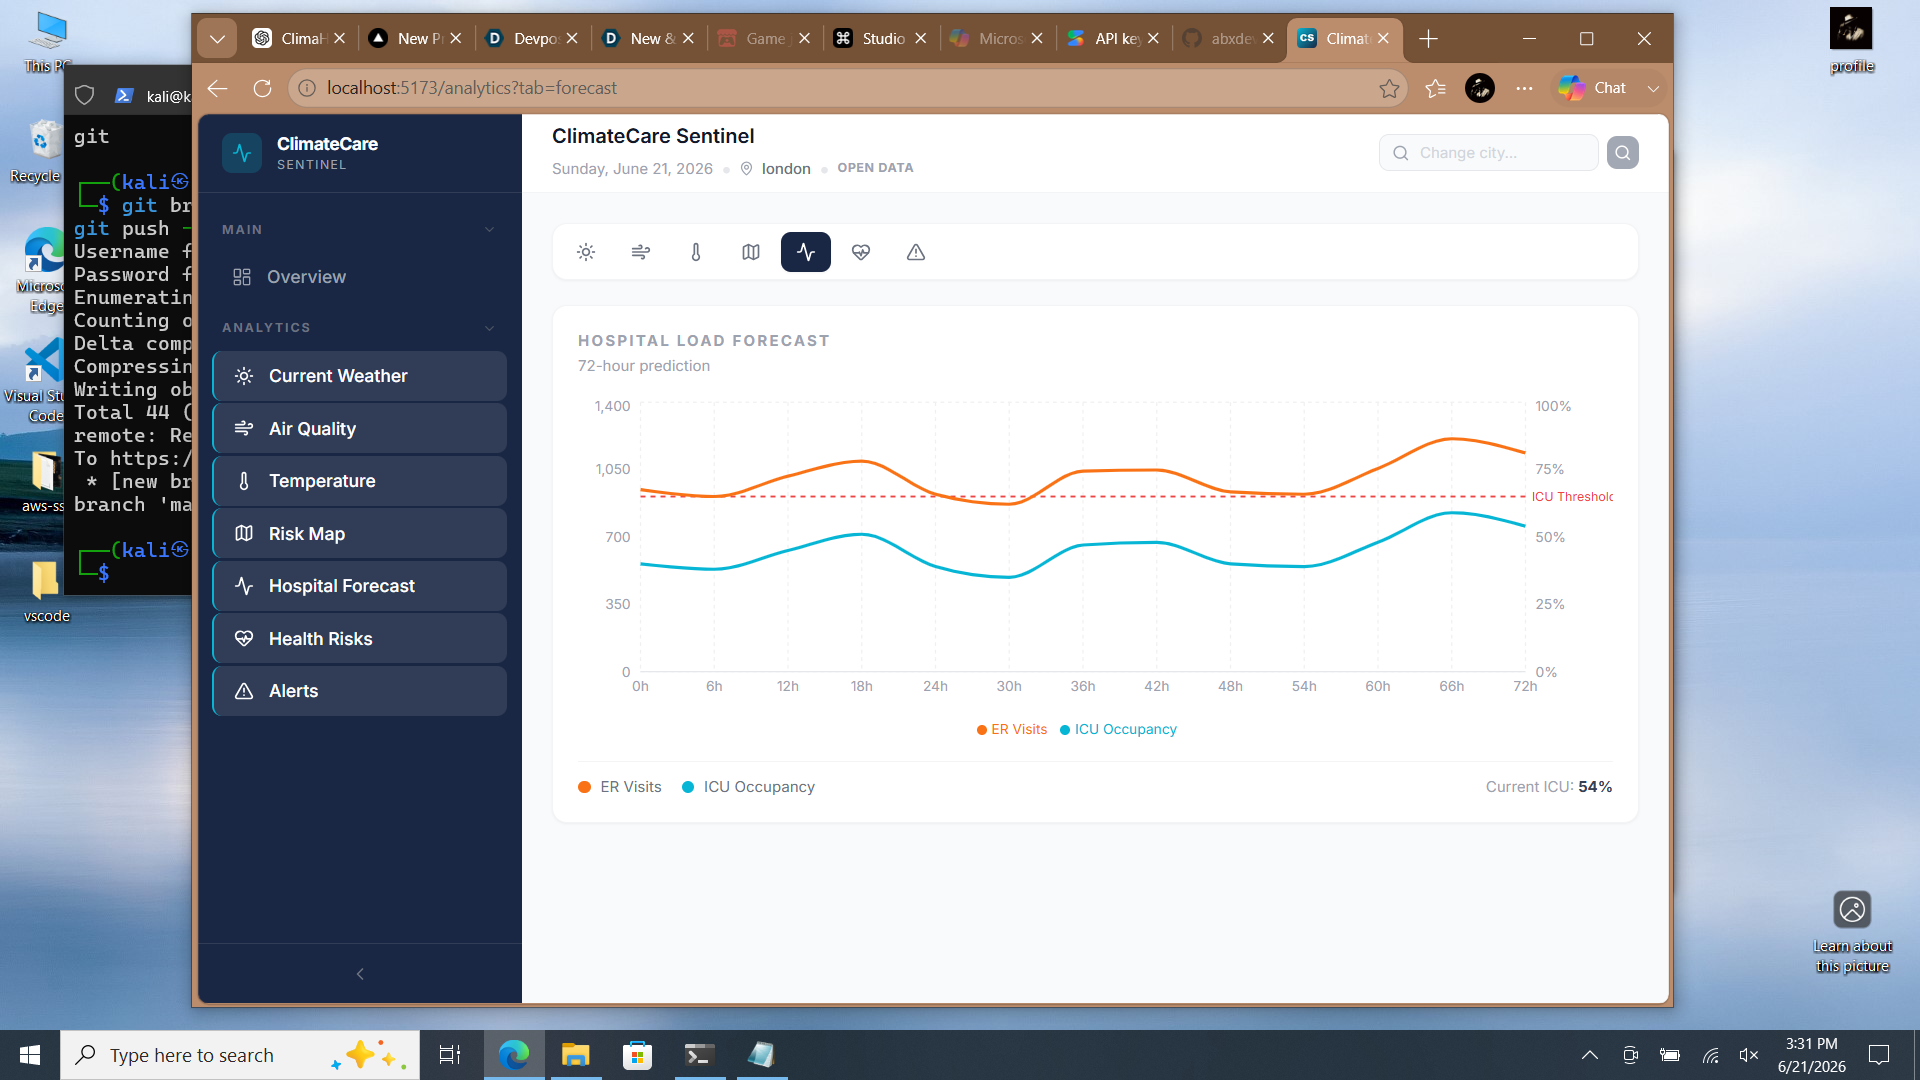
Hospital Forecast Analyzing
-
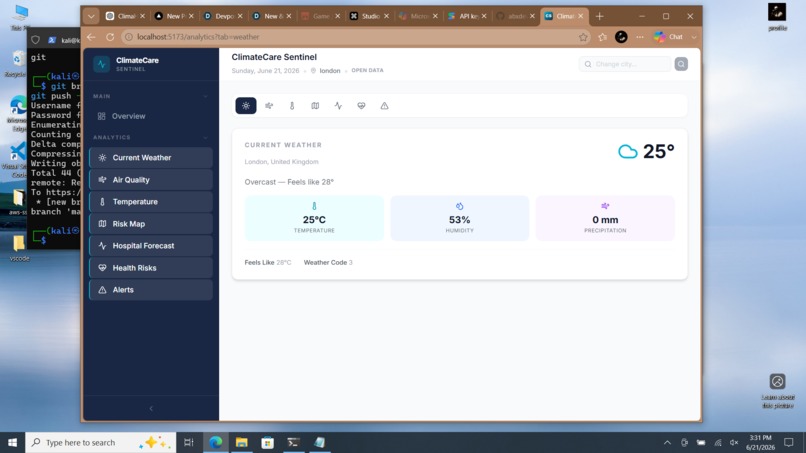
Current Weather Analytics
-

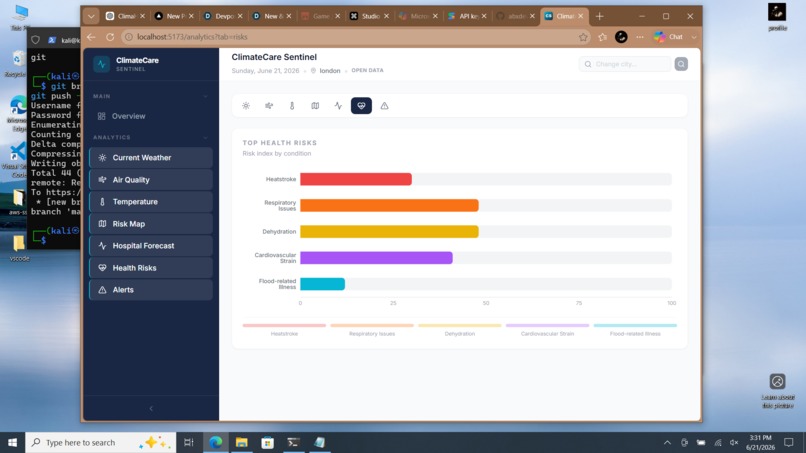
Health Risk Analytics
-

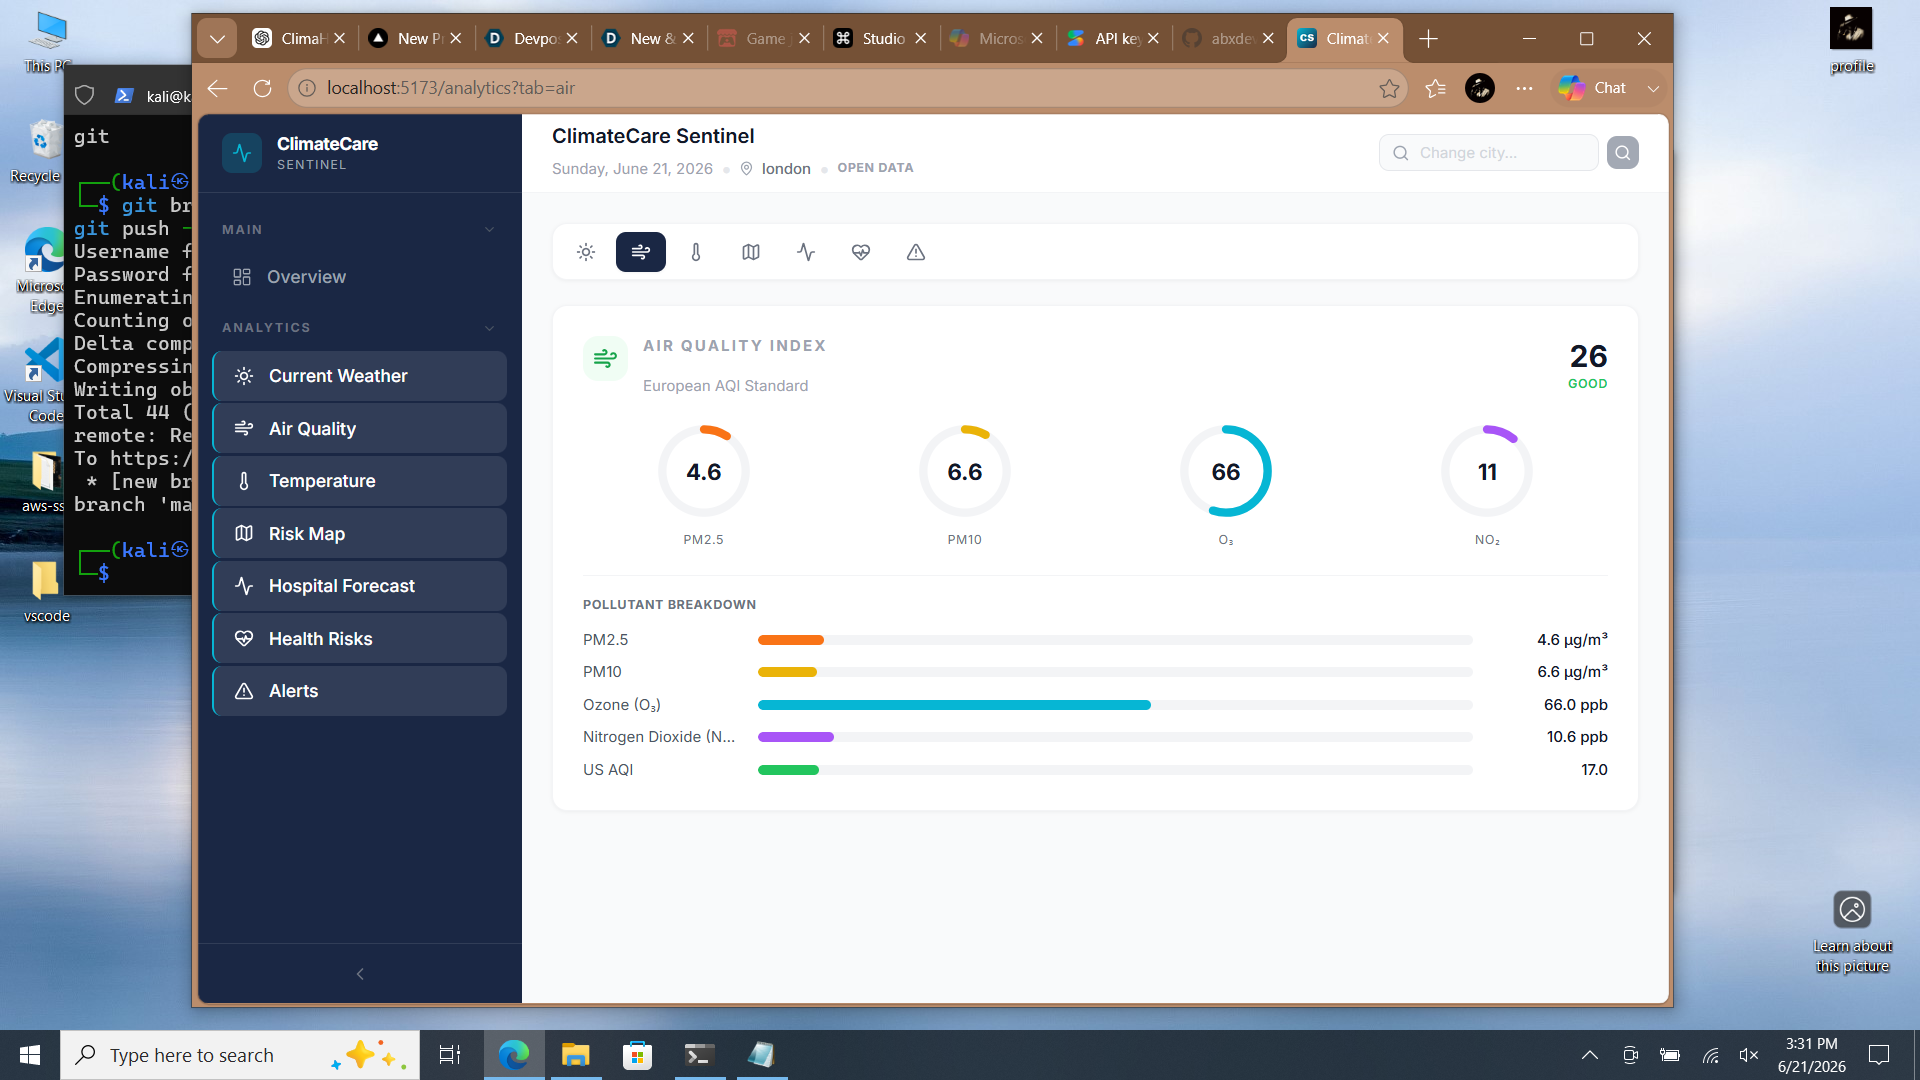
Air Quality Analytics
-
-
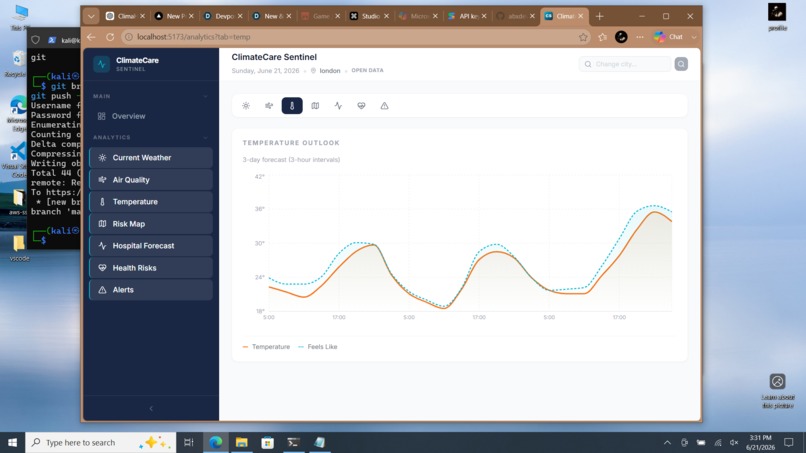
Temperature Analytics
-
Changing Location Features
-
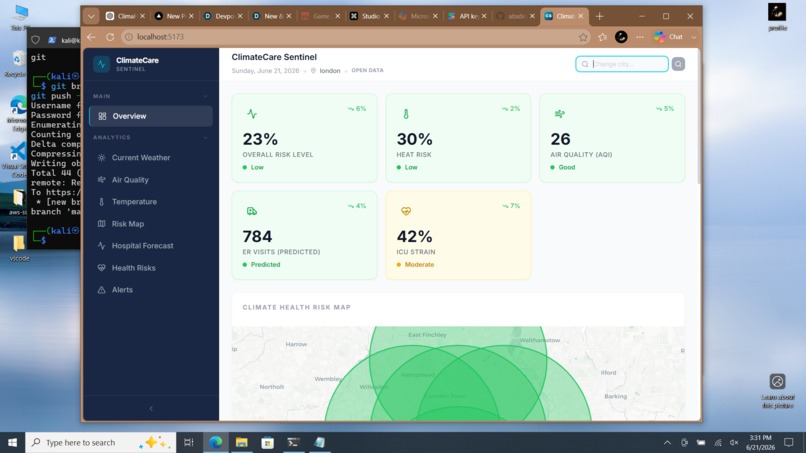
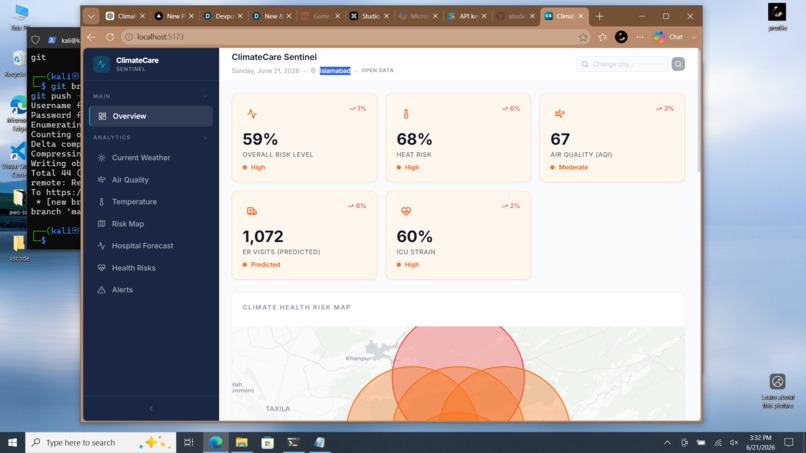
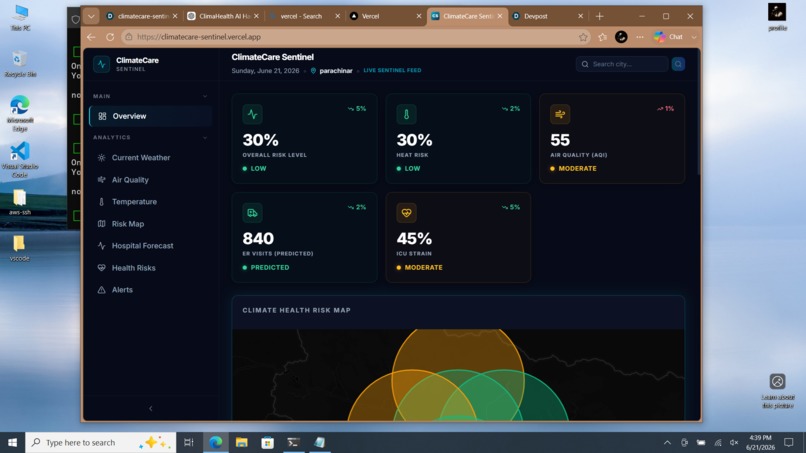
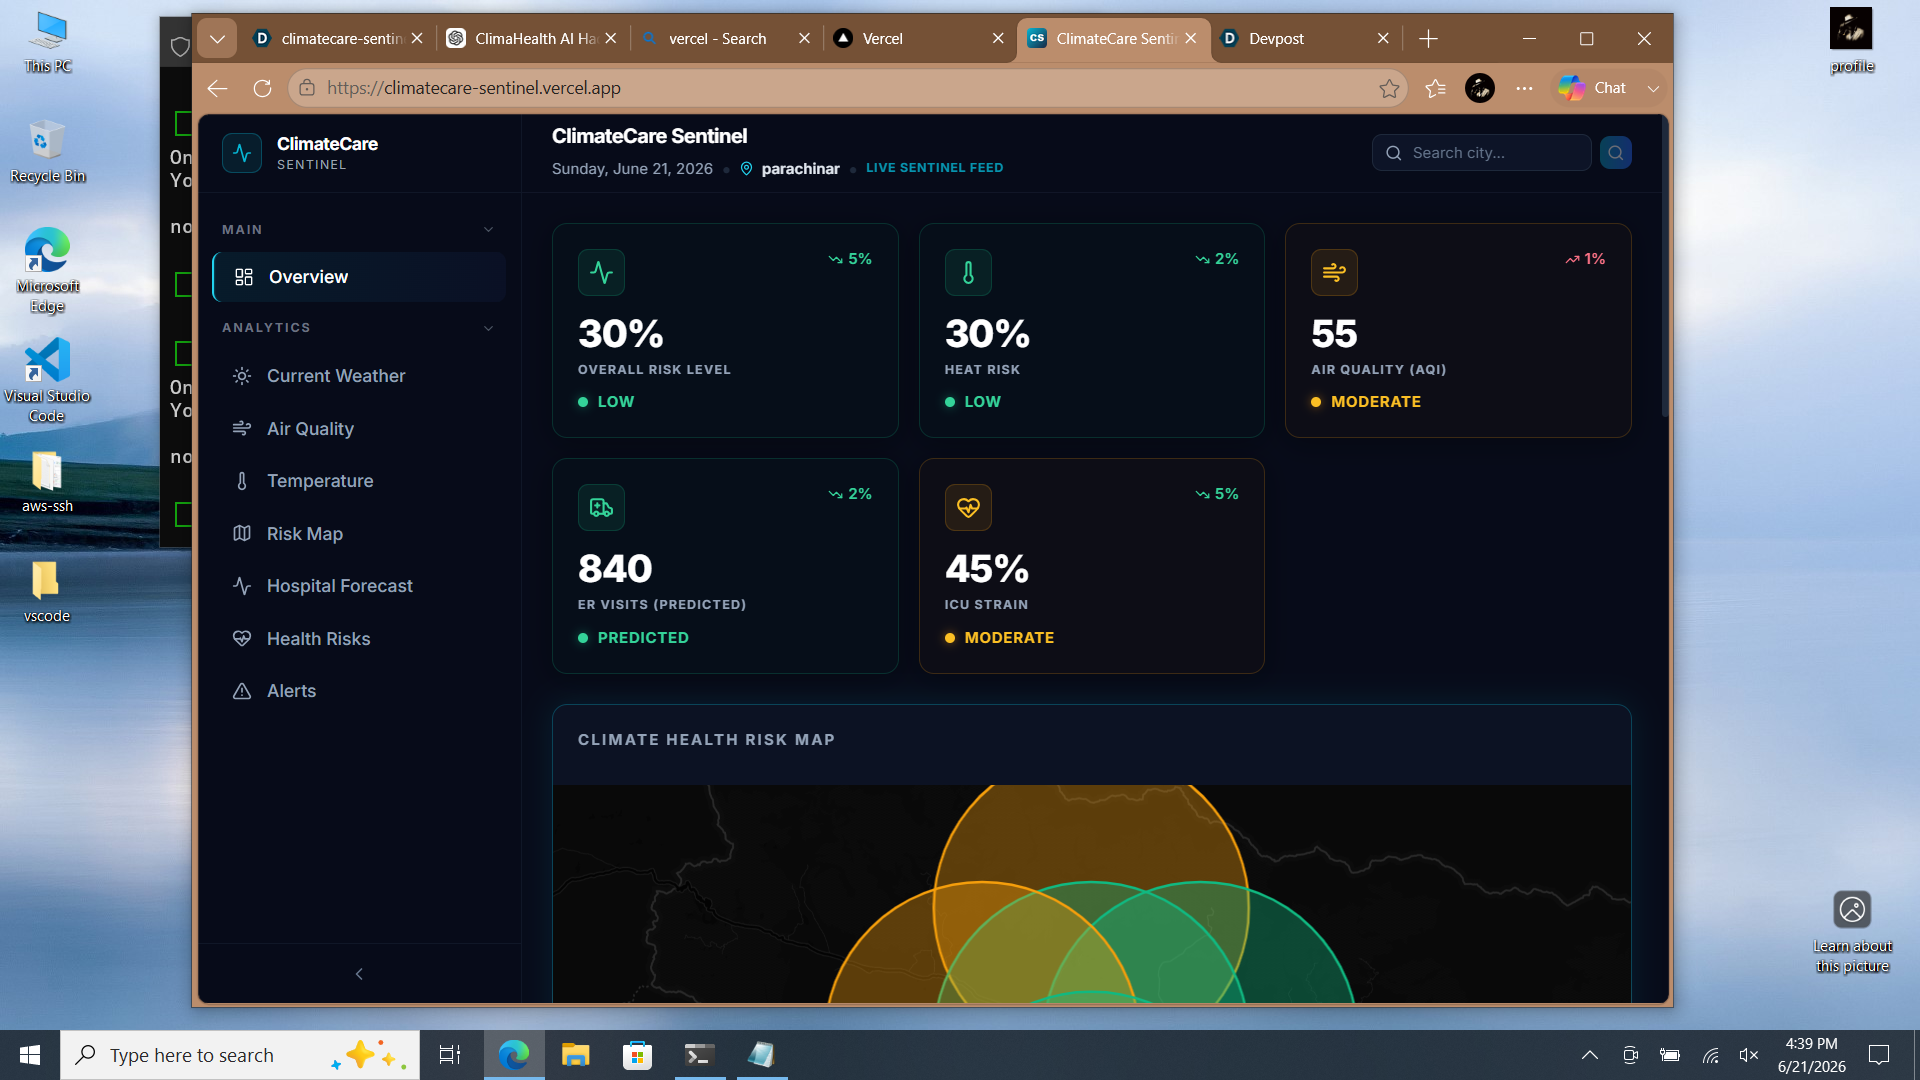
Overview Page
-

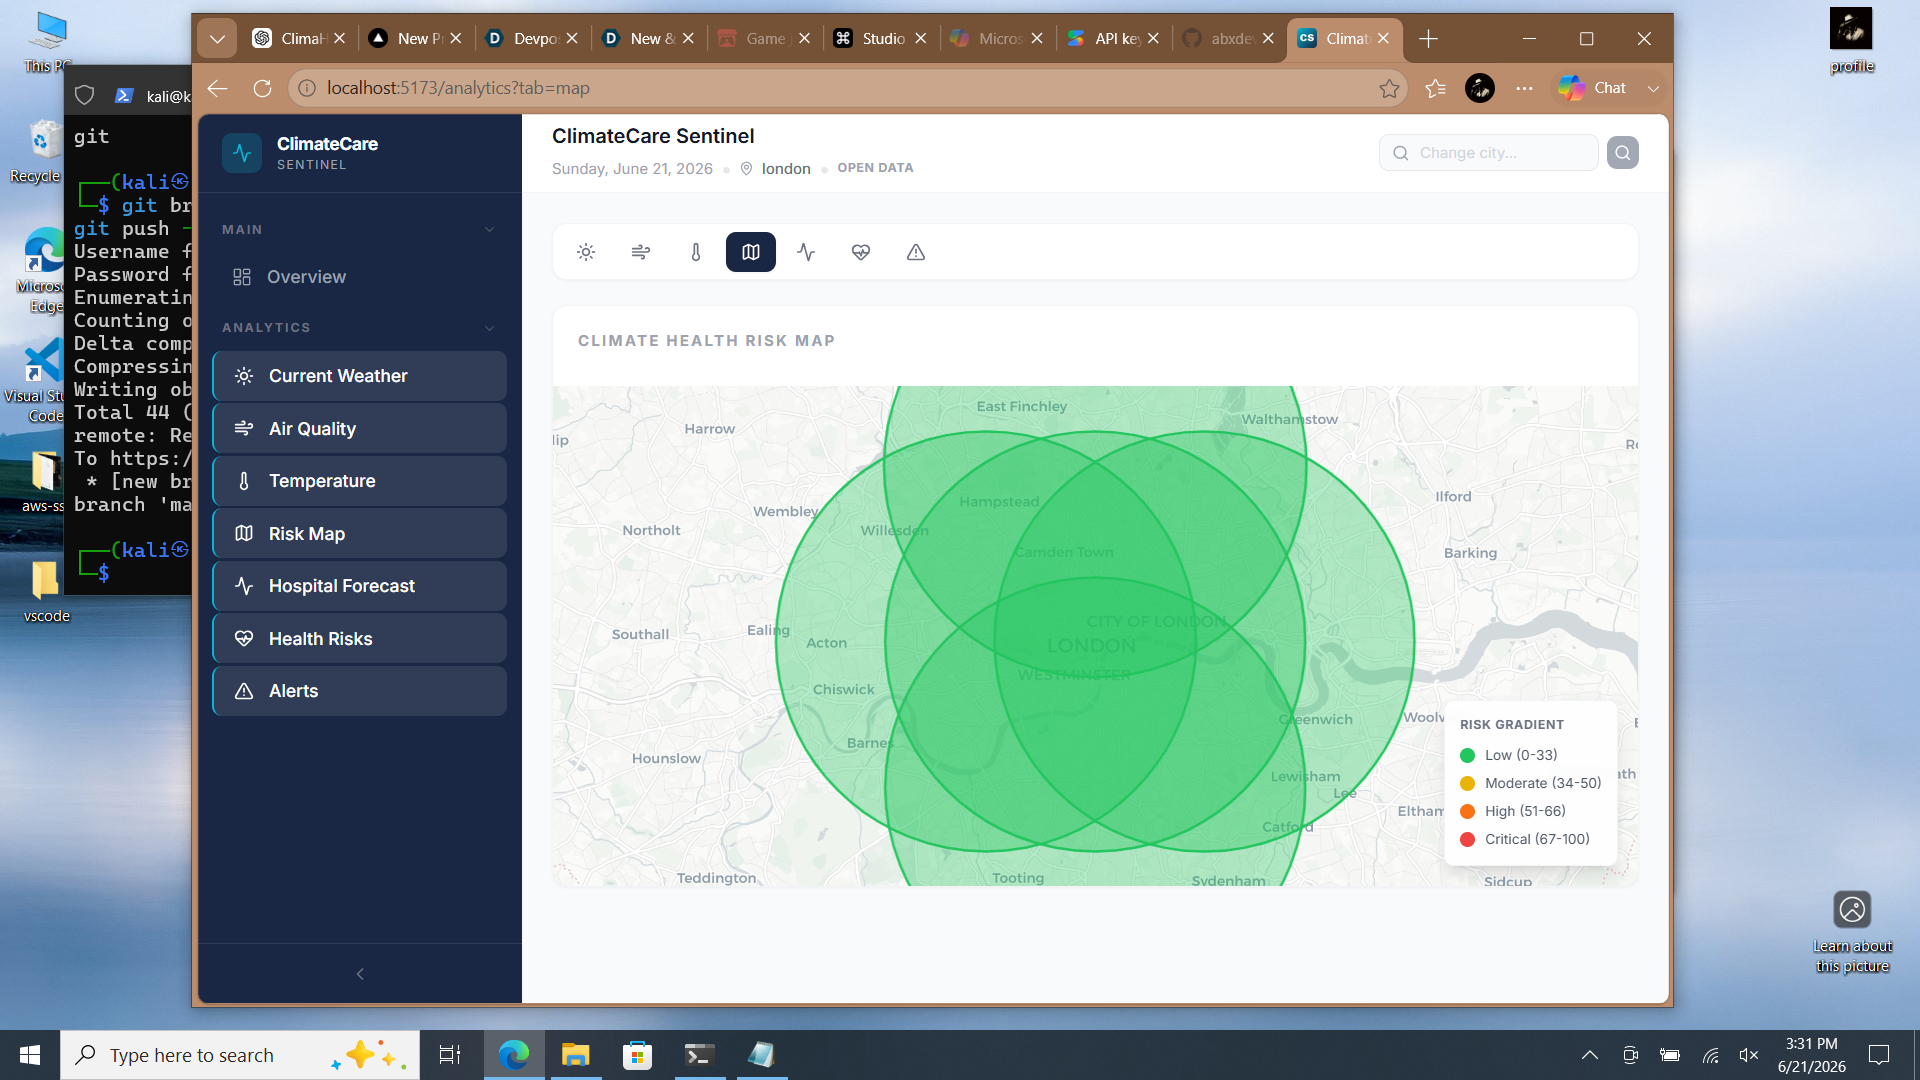
Risk Map Showing
-
Modern Style UI Updated......

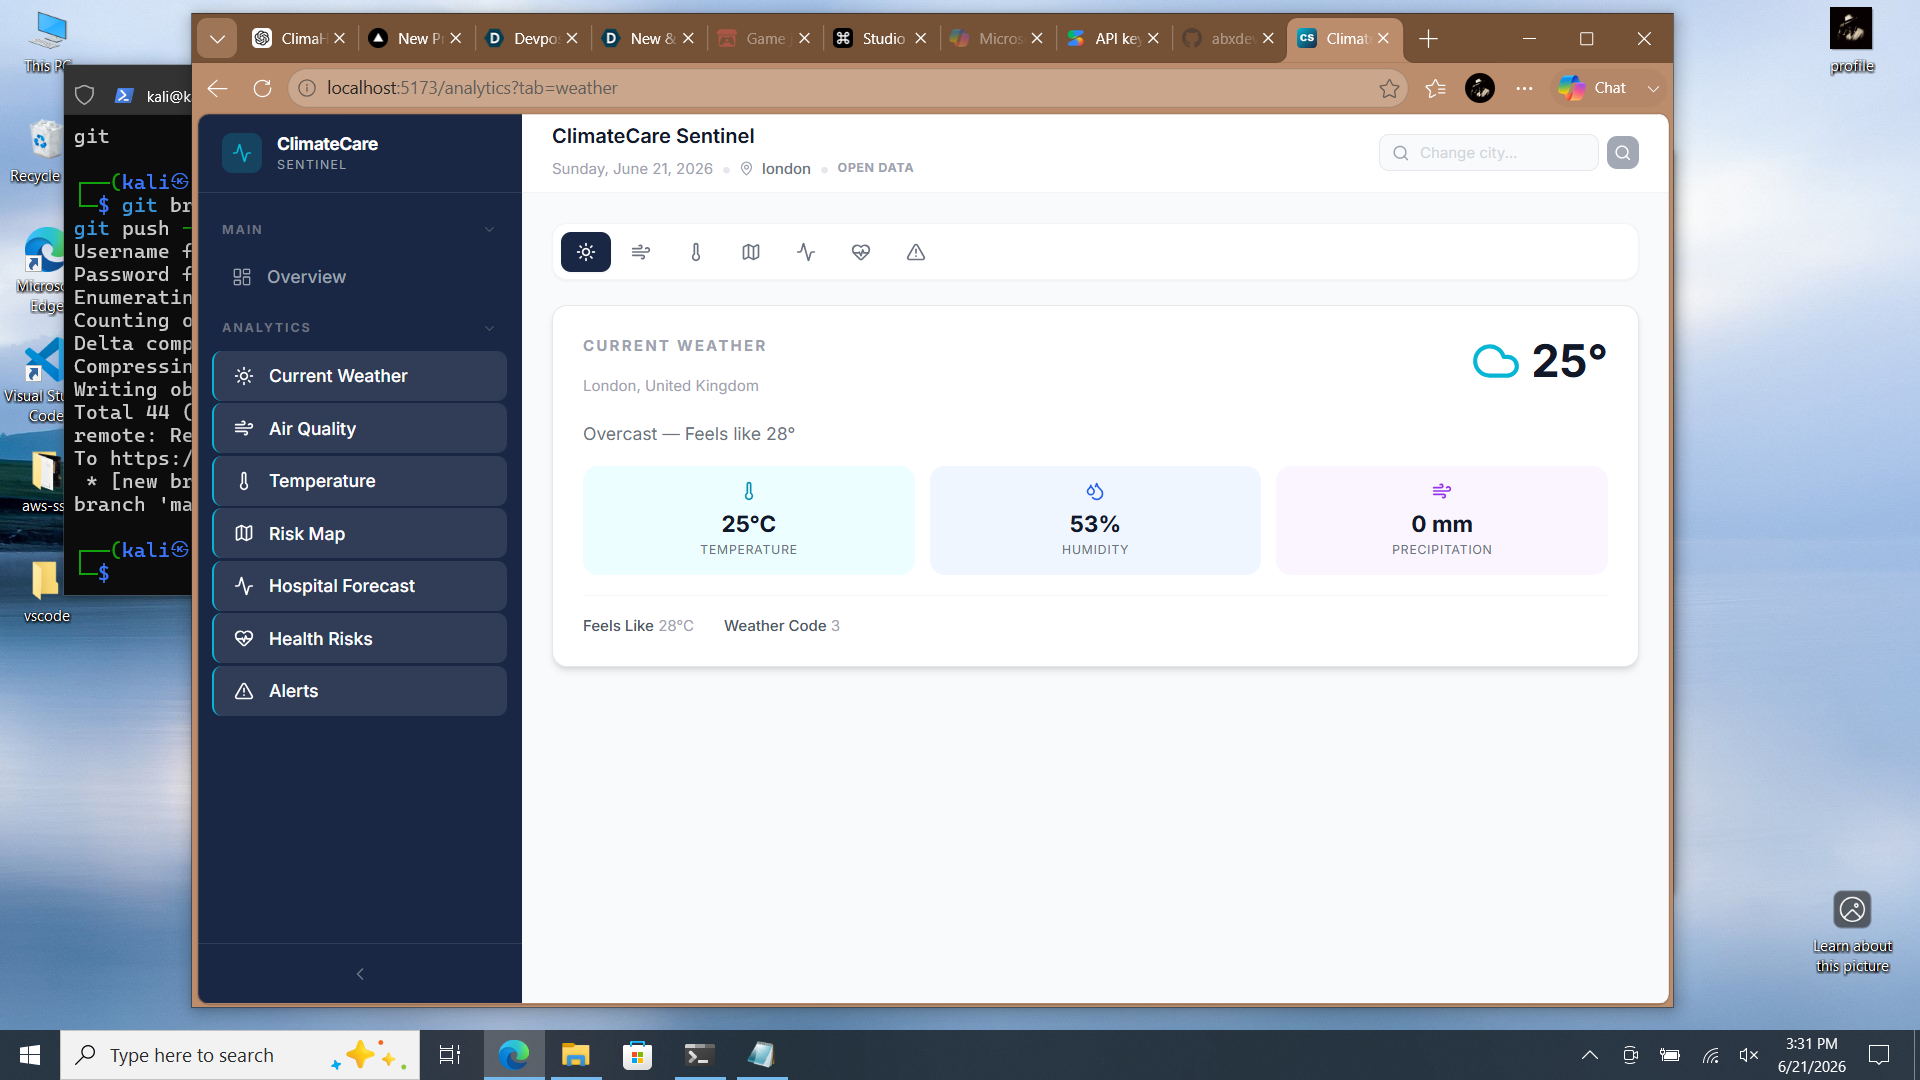


ClimateCare Sentinel
Inspiration
Climate change is increasingly affecting public health across the world. Extreme heat, poor air quality, floods, and environmental stressors can lead to rising hospital admissions, respiratory illnesses, heat-related conditions, and increased strain on healthcare systems.
We wanted to create a solution that helps communities, healthcare providers, and decision-makers understand these risks before they become emergencies. ClimateCare Sentinel was developed to transform complex climate and environmental data into actionable health intelligence.
What it does
ClimateCare Sentinel is a climate-health analytics platform that monitors environmental conditions and identifies potential health risks in real time.
The platform provides:
- Climate Health Risk Monitoring
- Air Quality Analysis
- Heat Risk Assessment
- Hospital Load Forecasting
- Interactive Risk Mapping
- Health Risk Trend Analysis
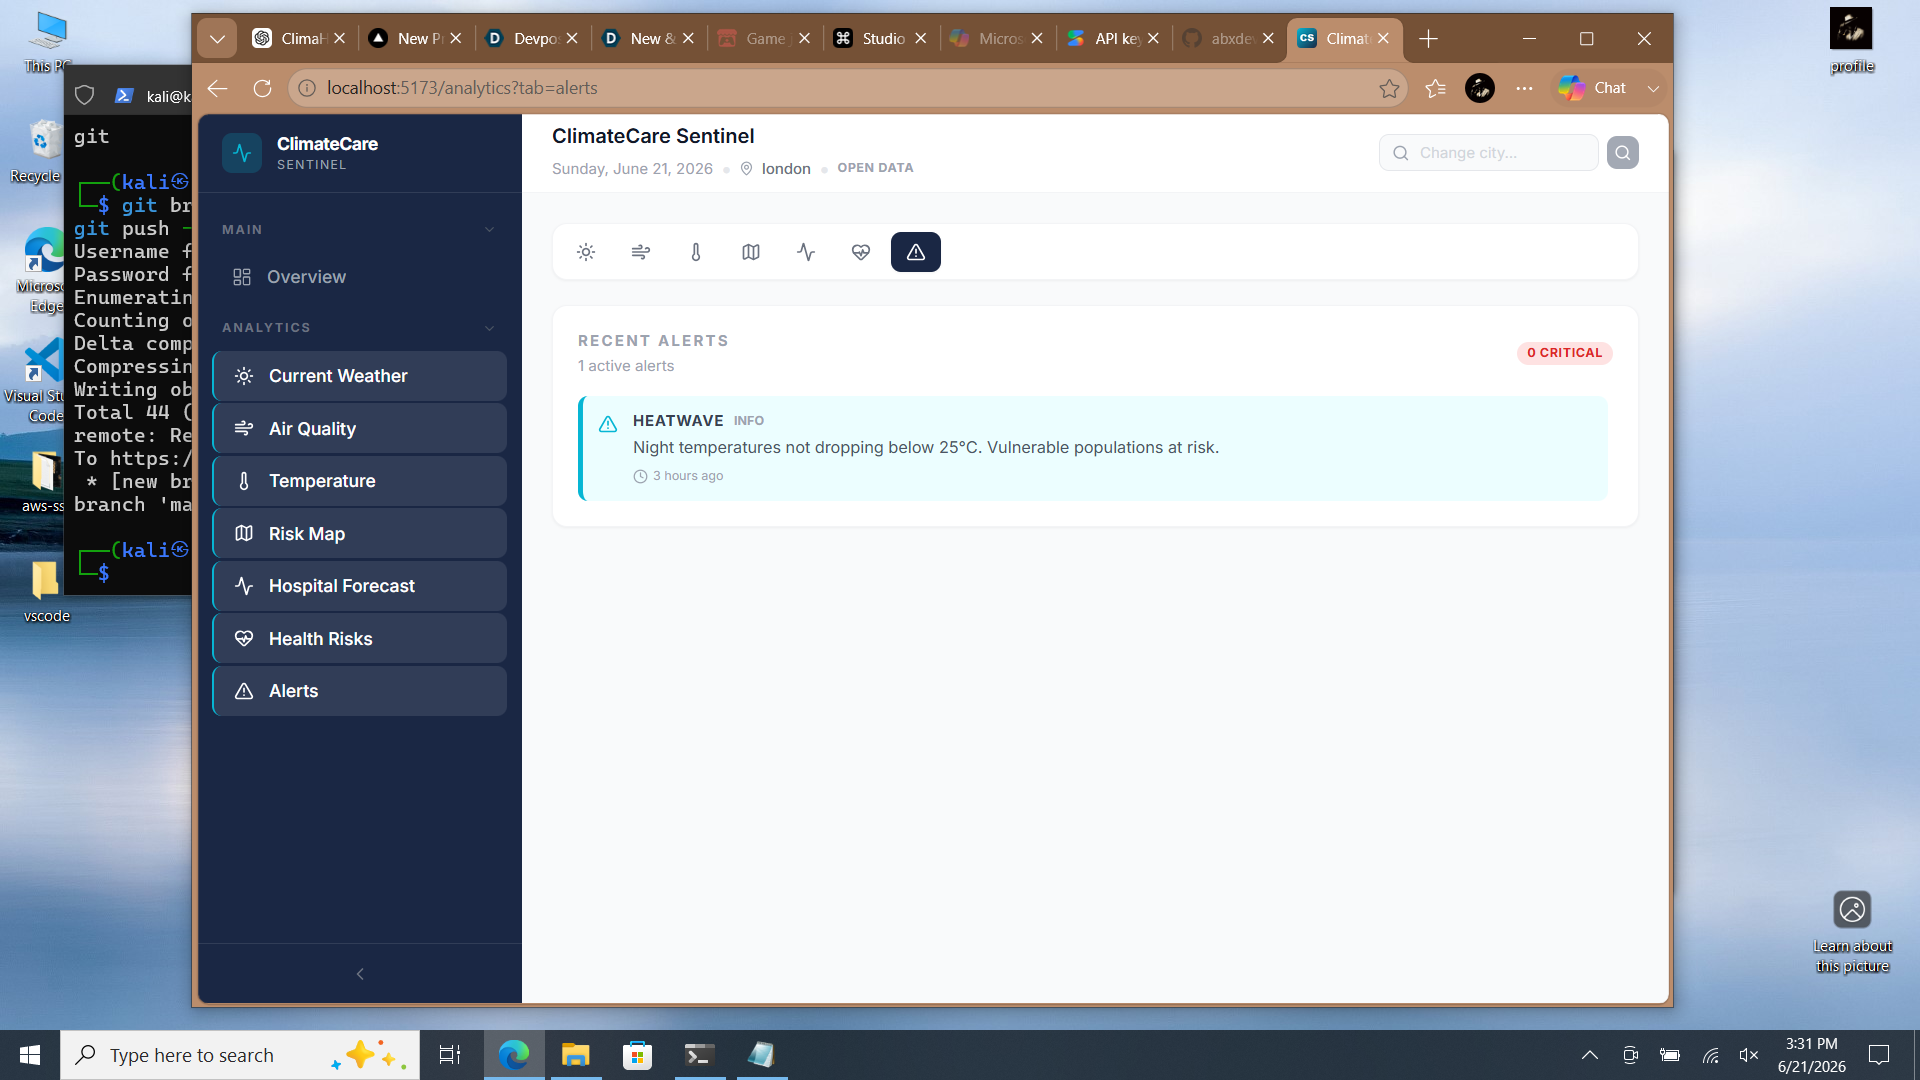
- Emergency Alert Visualization
- Impact Assessment Dashboard
By combining multiple data sources into a single dashboard, users can better understand how climate conditions may affect public health and healthcare capacity.
How we built it
We built ClimateCare Sentinel as a modern web application focused on usability, performance, and data visualization.
Frontend
- React.js
- Tailwind CSS
- Framer Motion
- Recharts
- Leaflet.js
Architecture
- Component-based design
- Responsive dashboard layout
- Real-time data processing
- Interactive visualizations
Data Sources
- Open weather datasets
- Air quality datasets
- Public environmental datasets
- Climate risk indicators
The platform converts raw environmental information into meaningful insights through custom risk analysis and forecasting models.
Challenges we ran into
One of the biggest challenges was translating large amounts of environmental data into information that is useful and understandable for users.
Another challenge was designing a dashboard that could present maps, forecasts, alerts, and analytics without overwhelming the user.
Balancing performance, visualization quality, and responsiveness required careful optimization throughout development.
Accomplishments that we're proud of
- Developed a complete climate-health intelligence dashboard.
- Created an interactive risk mapping system.
- Implemented hospital load forecasting visualizations.
- Built comprehensive health risk monitoring tools.
- Designed a scalable and modern user experience.
What we learned
This project highlighted the strong relationship between climate conditions and public health outcomes. We learned how data visualization, predictive analytics, and environmental intelligence can help organizations make more informed decisions.
We also gained valuable experience in designing systems that communicate complex information in a clear and actionable way.
What's next for ClimateCare Sentinel
Future improvements include:
- Expanded forecasting models
- Additional climate indicators
- Regional disease risk monitoring
- Mobile notifications and alerts
- Advanced healthcare resource planning
- Support for multiple cities and regions
Our long-term goal is to help communities become more resilient to climate-related health challenges through accessible and data-driven decision support tools.
Built With
- air
- analytics
- climate
- css
- css3
- dashboard
- data
- framer
- html5
- javascript
- leaflet.js
- motion
- open
- quality
- react.js
- recharts
- tailwind
- vercel
- visualization


Log in or sign up for Devpost to join the conversation.