What I Learned
Through this project, I gained a deeper understanding of climate science and the importance of data visualization. I also enhanced my skills in Next.js for server-side rendering, as well as using APIs to fetch real-time data. Additionally, I learned to create engaging user interfaces with Tailwind CSS and DaisyUI.
How I Built the Project
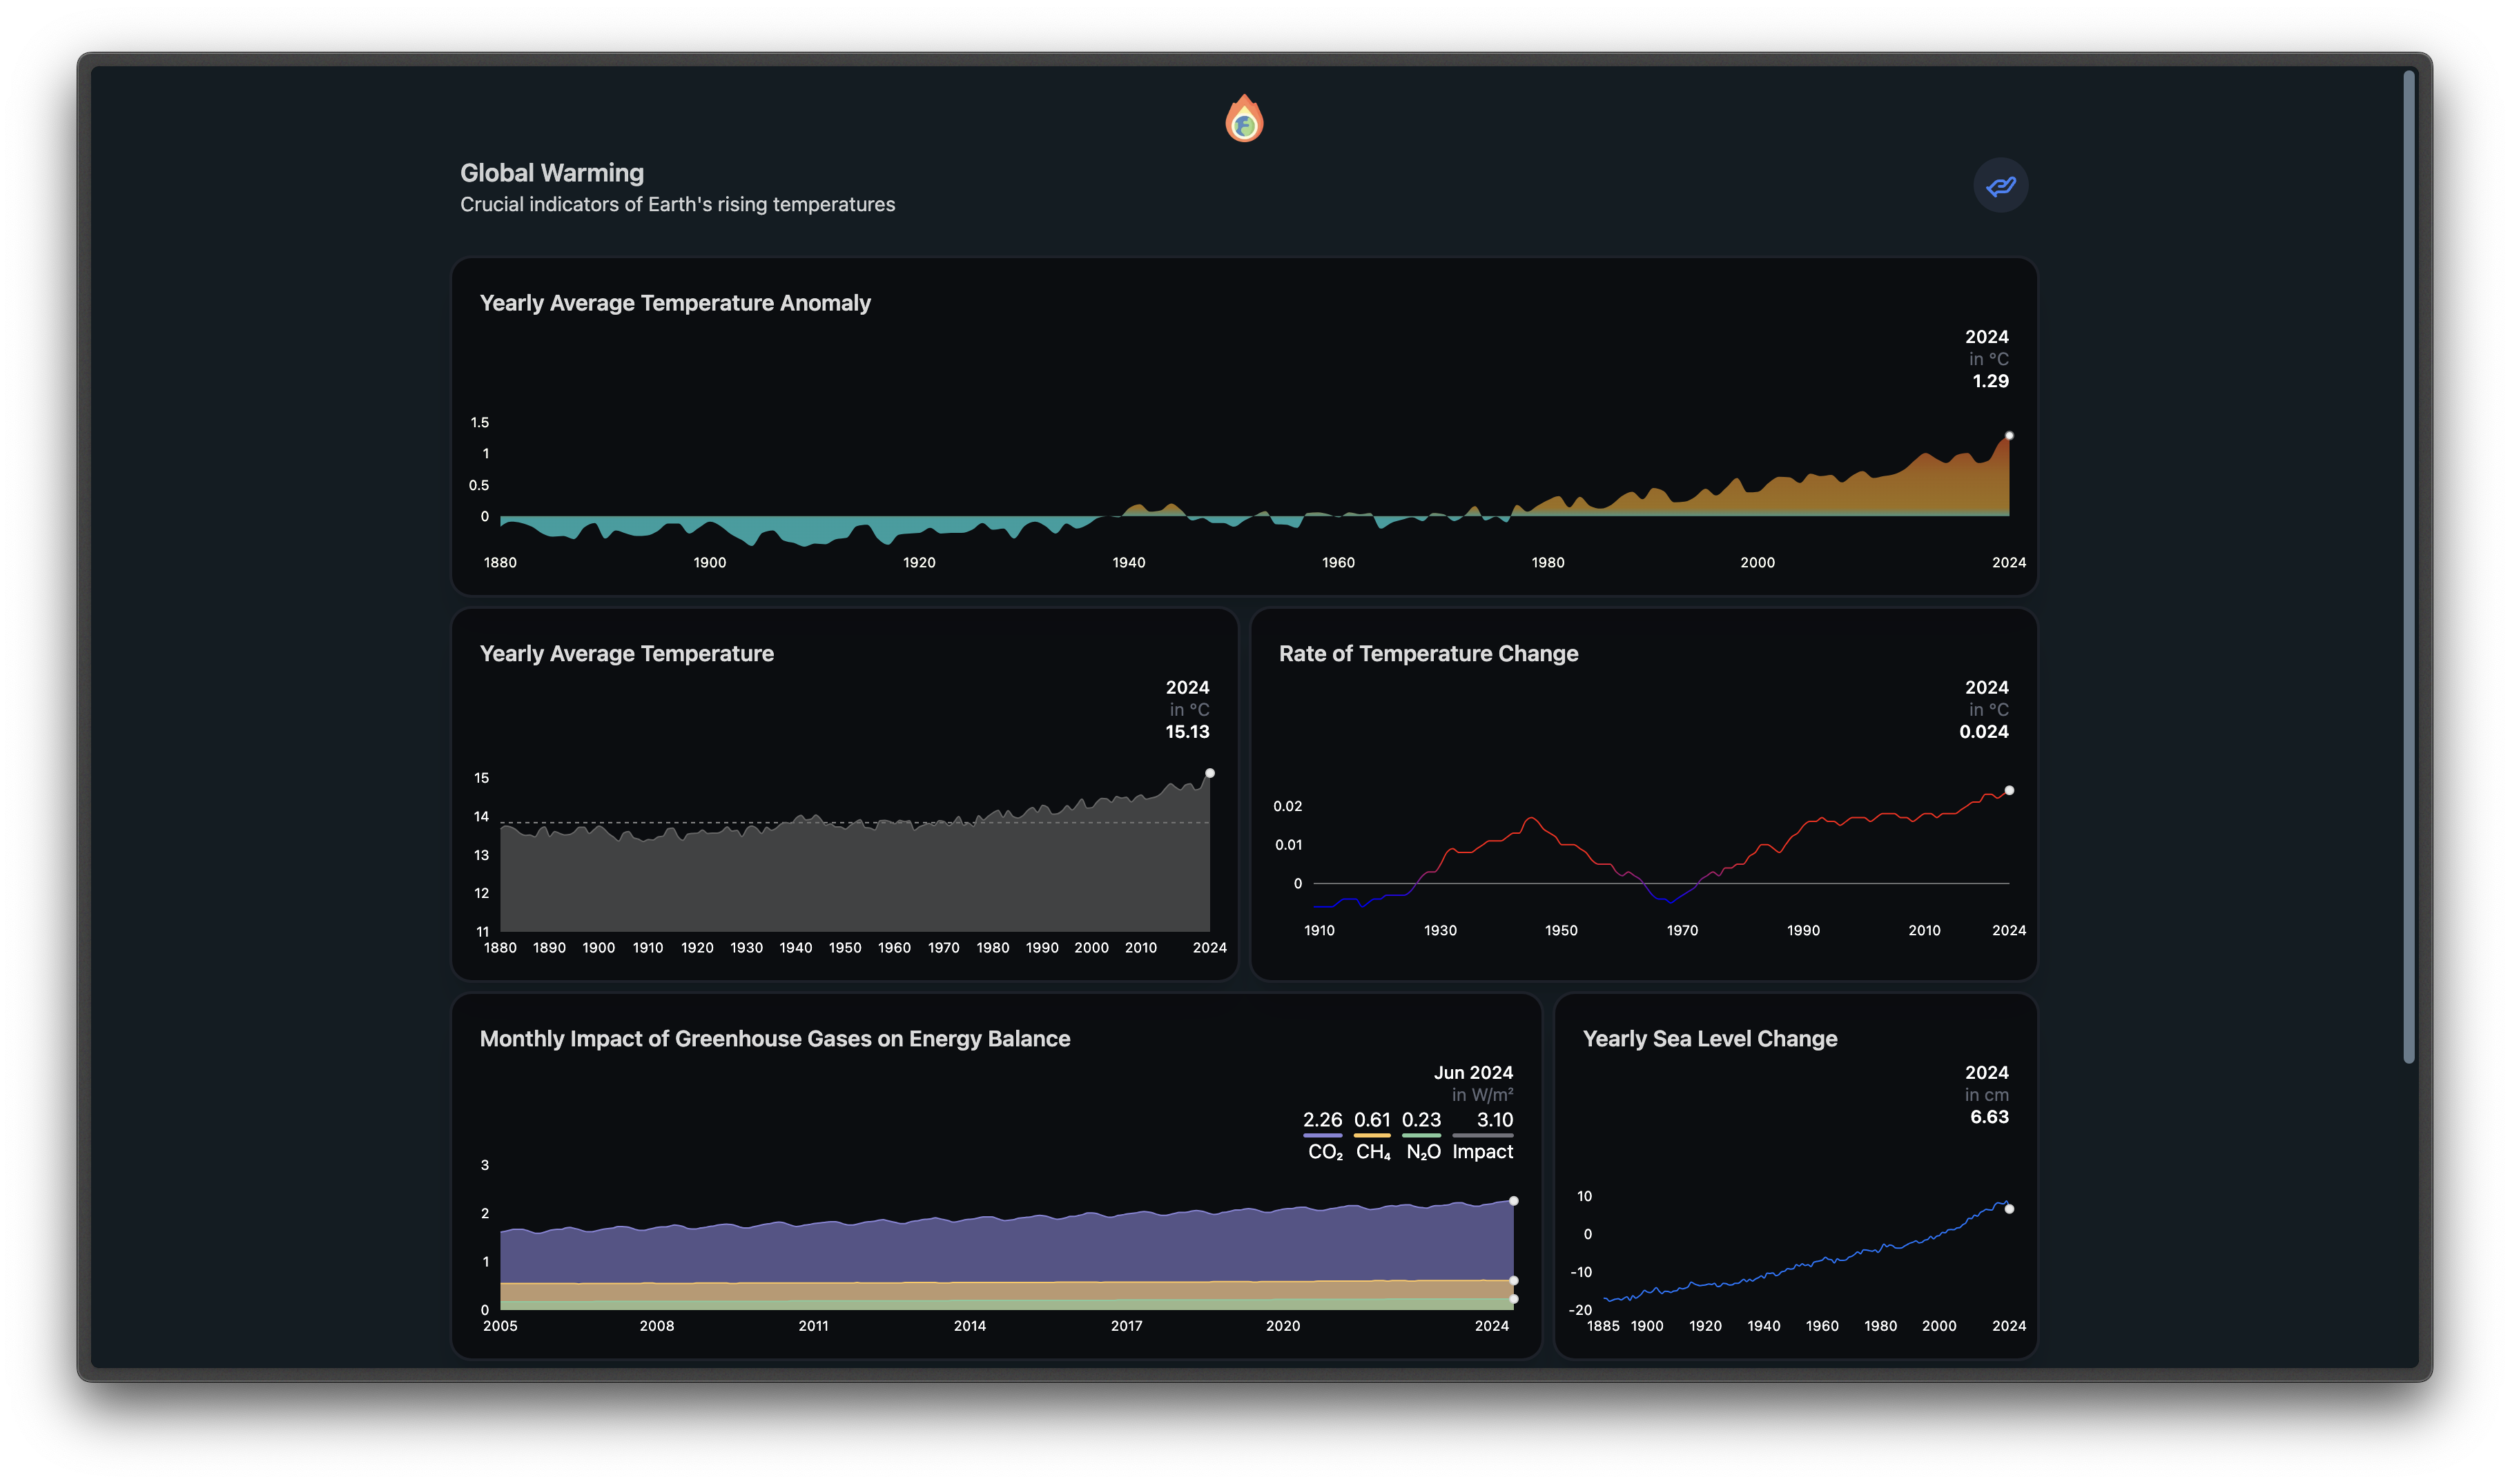
I built the Global Warming Data Tracker using Next.js to take advantage of its server-side rendering capabilities and API routes for fetching data. The user interface was crafted with Tailwind CSS for a responsive design, and I used Recharts for effective data visualization. The project pulls data from reputable sources like NASA and NOAA, ensuring that users receive accurate and up-to-date information.
Challenges Faced
One of the main challenges was handling the data fetching and parsing from different sources, ensuring the data was formatted correctly for visualization. I also faced hurdles in making the user interface intuitive while incorporating complex data visualizations. However, these challenges provided valuable learning experiences and helped me improve my problem-solving skills.
Built With
- javascript
- nextjs
- vercel
Log in or sign up for Devpost to join the conversation.