-
-
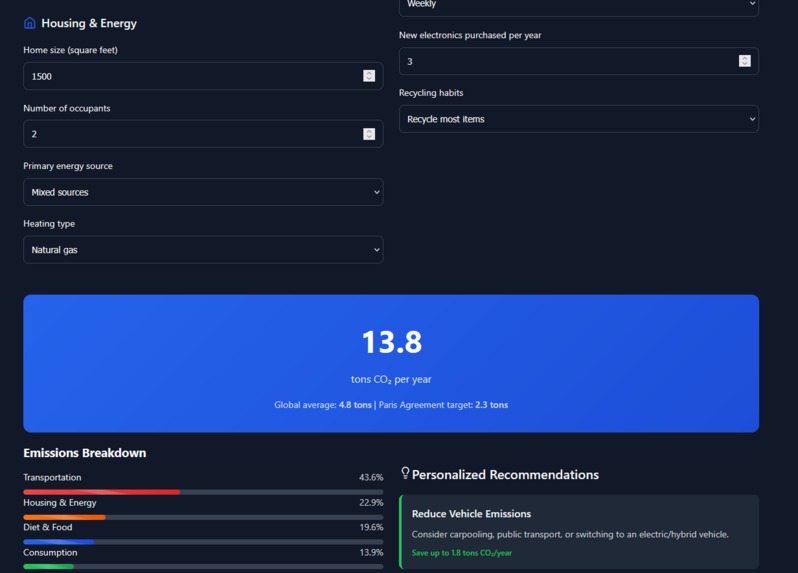
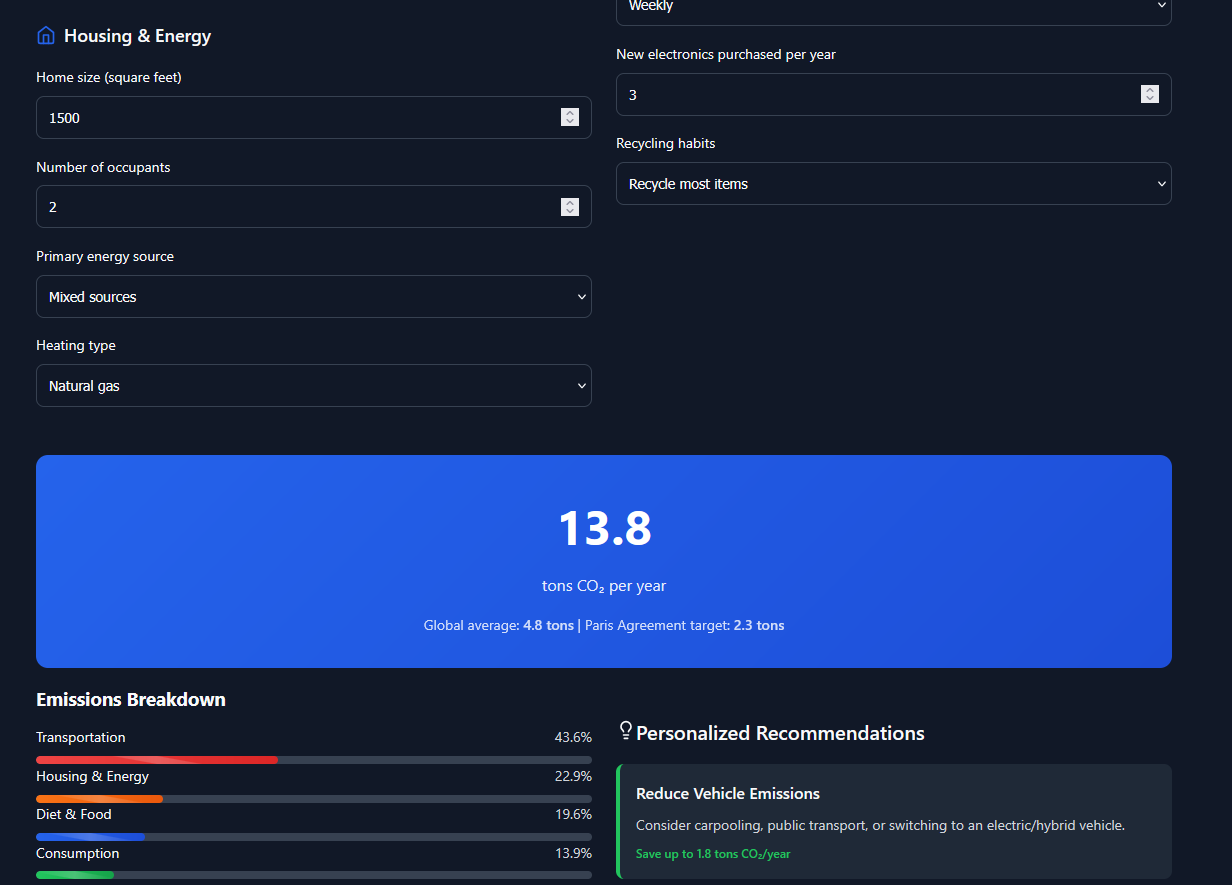
Calculate your carbon footprint and get actionable insight.
-

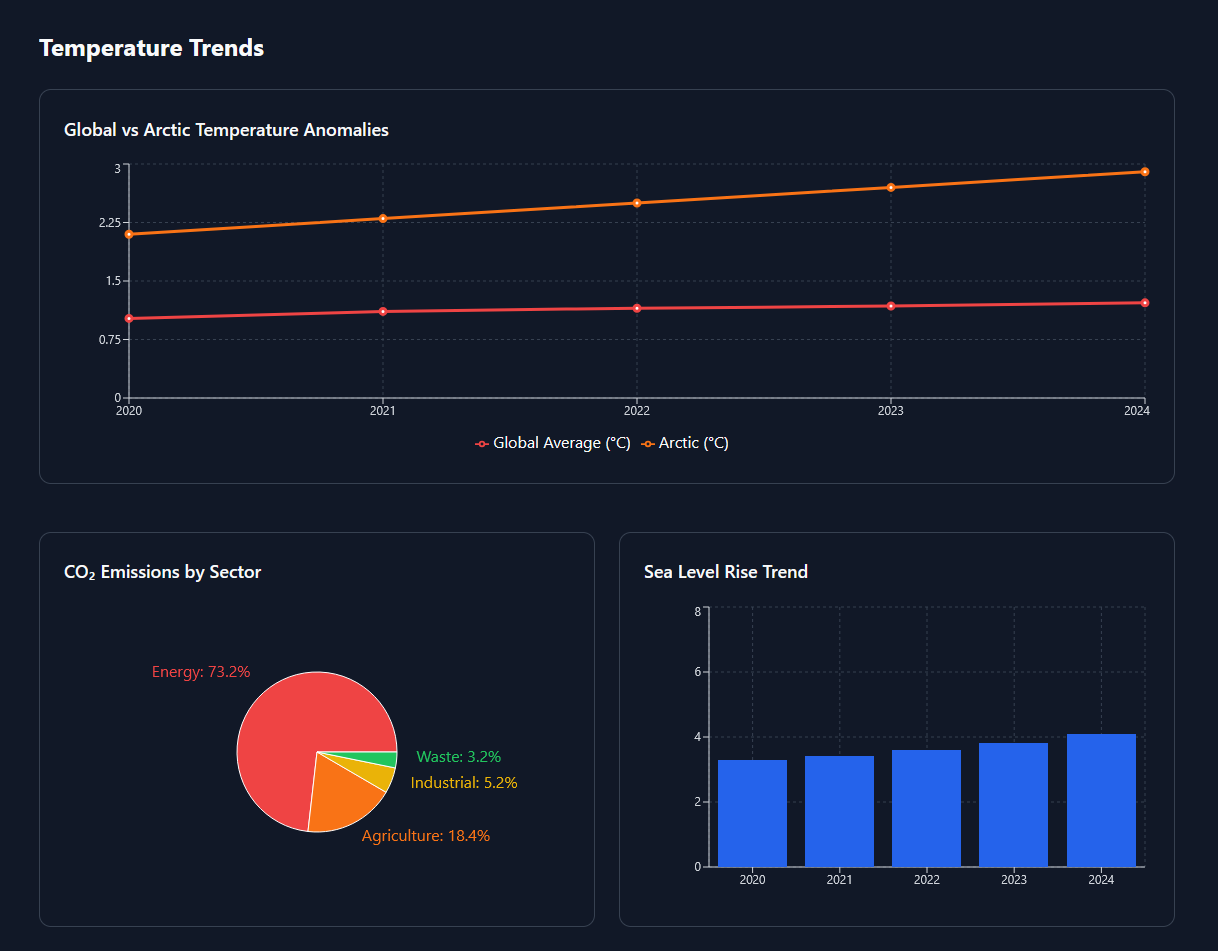
Dashboard overview
-
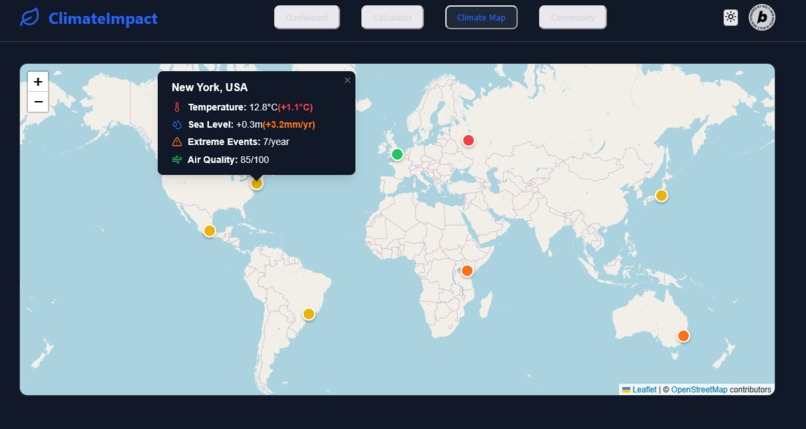
Map

Inspiration
Wanted to push the limits of a 1 prompt creation and make something useful that doesn't exist
What it does
We have hardcoded #'s used for past data at this time for an overview, there is a calculator to calculate your tons CO₂ per year and provides actionable insight on your usage.
How we built it
1 complex prompt in bolt.
Challenges we ran into
getting that 1 prompt correct
Accomplishments that we're proud of
a useful application in 1 prompt that we actually will continue to develop
What we learned
how to craft a prompt to get the most out of your initial build.
What's next for Climate Impact
Well because we wrote this with one prompt we also made sure it planned for the future, so I can show you exactly what is next
Q2 2025 - Community Action Hub
- Local Sustainability Groups: Find and join environmental initiatives in your area
- Policy Advocacy: Participate in climate policy campaigns and petitions
- Carbon Offset Marketplace: Purchase verified carbon offsets with impact tracking
- Community Challenges: Gamified sustainability competitions with leaderboards
- Event Calendar: Discover local climate action events and workshops
- Social Impact Sharing: Share achievements and inspire others
Q3 2025 - AI-Powered What-If Simulator
- Personal Behavior Modeling: See the impact of lifestyle changes at scale
- Policy Scenario Analysis: Visualize outcomes of proposed climate policies
- Technology Adoption Curves: Model the impact of green technology adoption
- Global Impact Visualization: Interactive models showing worldwide effects
- Comparative Analysis: Side-by-side scenario comparisons
- Real-time Data Integration: Live updates from climate monitoring networks
Q4 2025 - Personalized Climate Education
- Adaptive Learning: Content that adjusts to your knowledge level and interests
- Interactive Science Modules: Hands-on climate science education
- Local Impact Stories: Region-specific climate change narratives
- Expert Content: Interviews, webinars, and insights from climate scientists
- Progress Tracking: Learning achievements and certification system
- Multi-language Support: Accessible education for global audiences
Q1 2026 - Data Visualization & Smart Integration
- Custom Infographics: Generate shareable climate data visualizations
- Smart Home Integration: Connect with IoT devices for real-time energy monitoring
- Automated Reporting: Regular sustainability reports with actionable insights
- Social Sharing Tools: Easy sharing of progress and achievements
- Friend Comparisons: Opt-in comparison with friends and family
- API Integrations: Connect with popular smart home platforms (Nest, Ecobee, etc.)
Data Sources (Planned Integrations)
- NASA Climate Data: Real-time temperature and atmospheric data
- NOAA Weather Service: Extreme weather event tracking
- World Bank Climate APIs: Global emissions and policy data
- OpenWeatherMap: Local weather and air quality data
- Carbon Interface API: Emissions calculation factors
Built With
- leaflet.js
- react
- recharts
- scss
- vite

Log in or sign up for Devpost to join the conversation.