🌍 Inspiration
Climate data is scattered, inconsistent, and often locked behind APIs or dashboards that don’t talk to each other. As global weather patterns grow more volatile, researchers and developers need a unified, grid‑based way to visualize and compare environmental changes.
Climate Grid Watch was born from the idea of turning raw climate metrics into actionable insights — a system where every square on the map tells a story about temperature, rainfall, and wind patterns in real time. The project draws inspiration from open‑data movements, satellite mapping, and AI‑driven sustainability tools.
⚙️ What it does
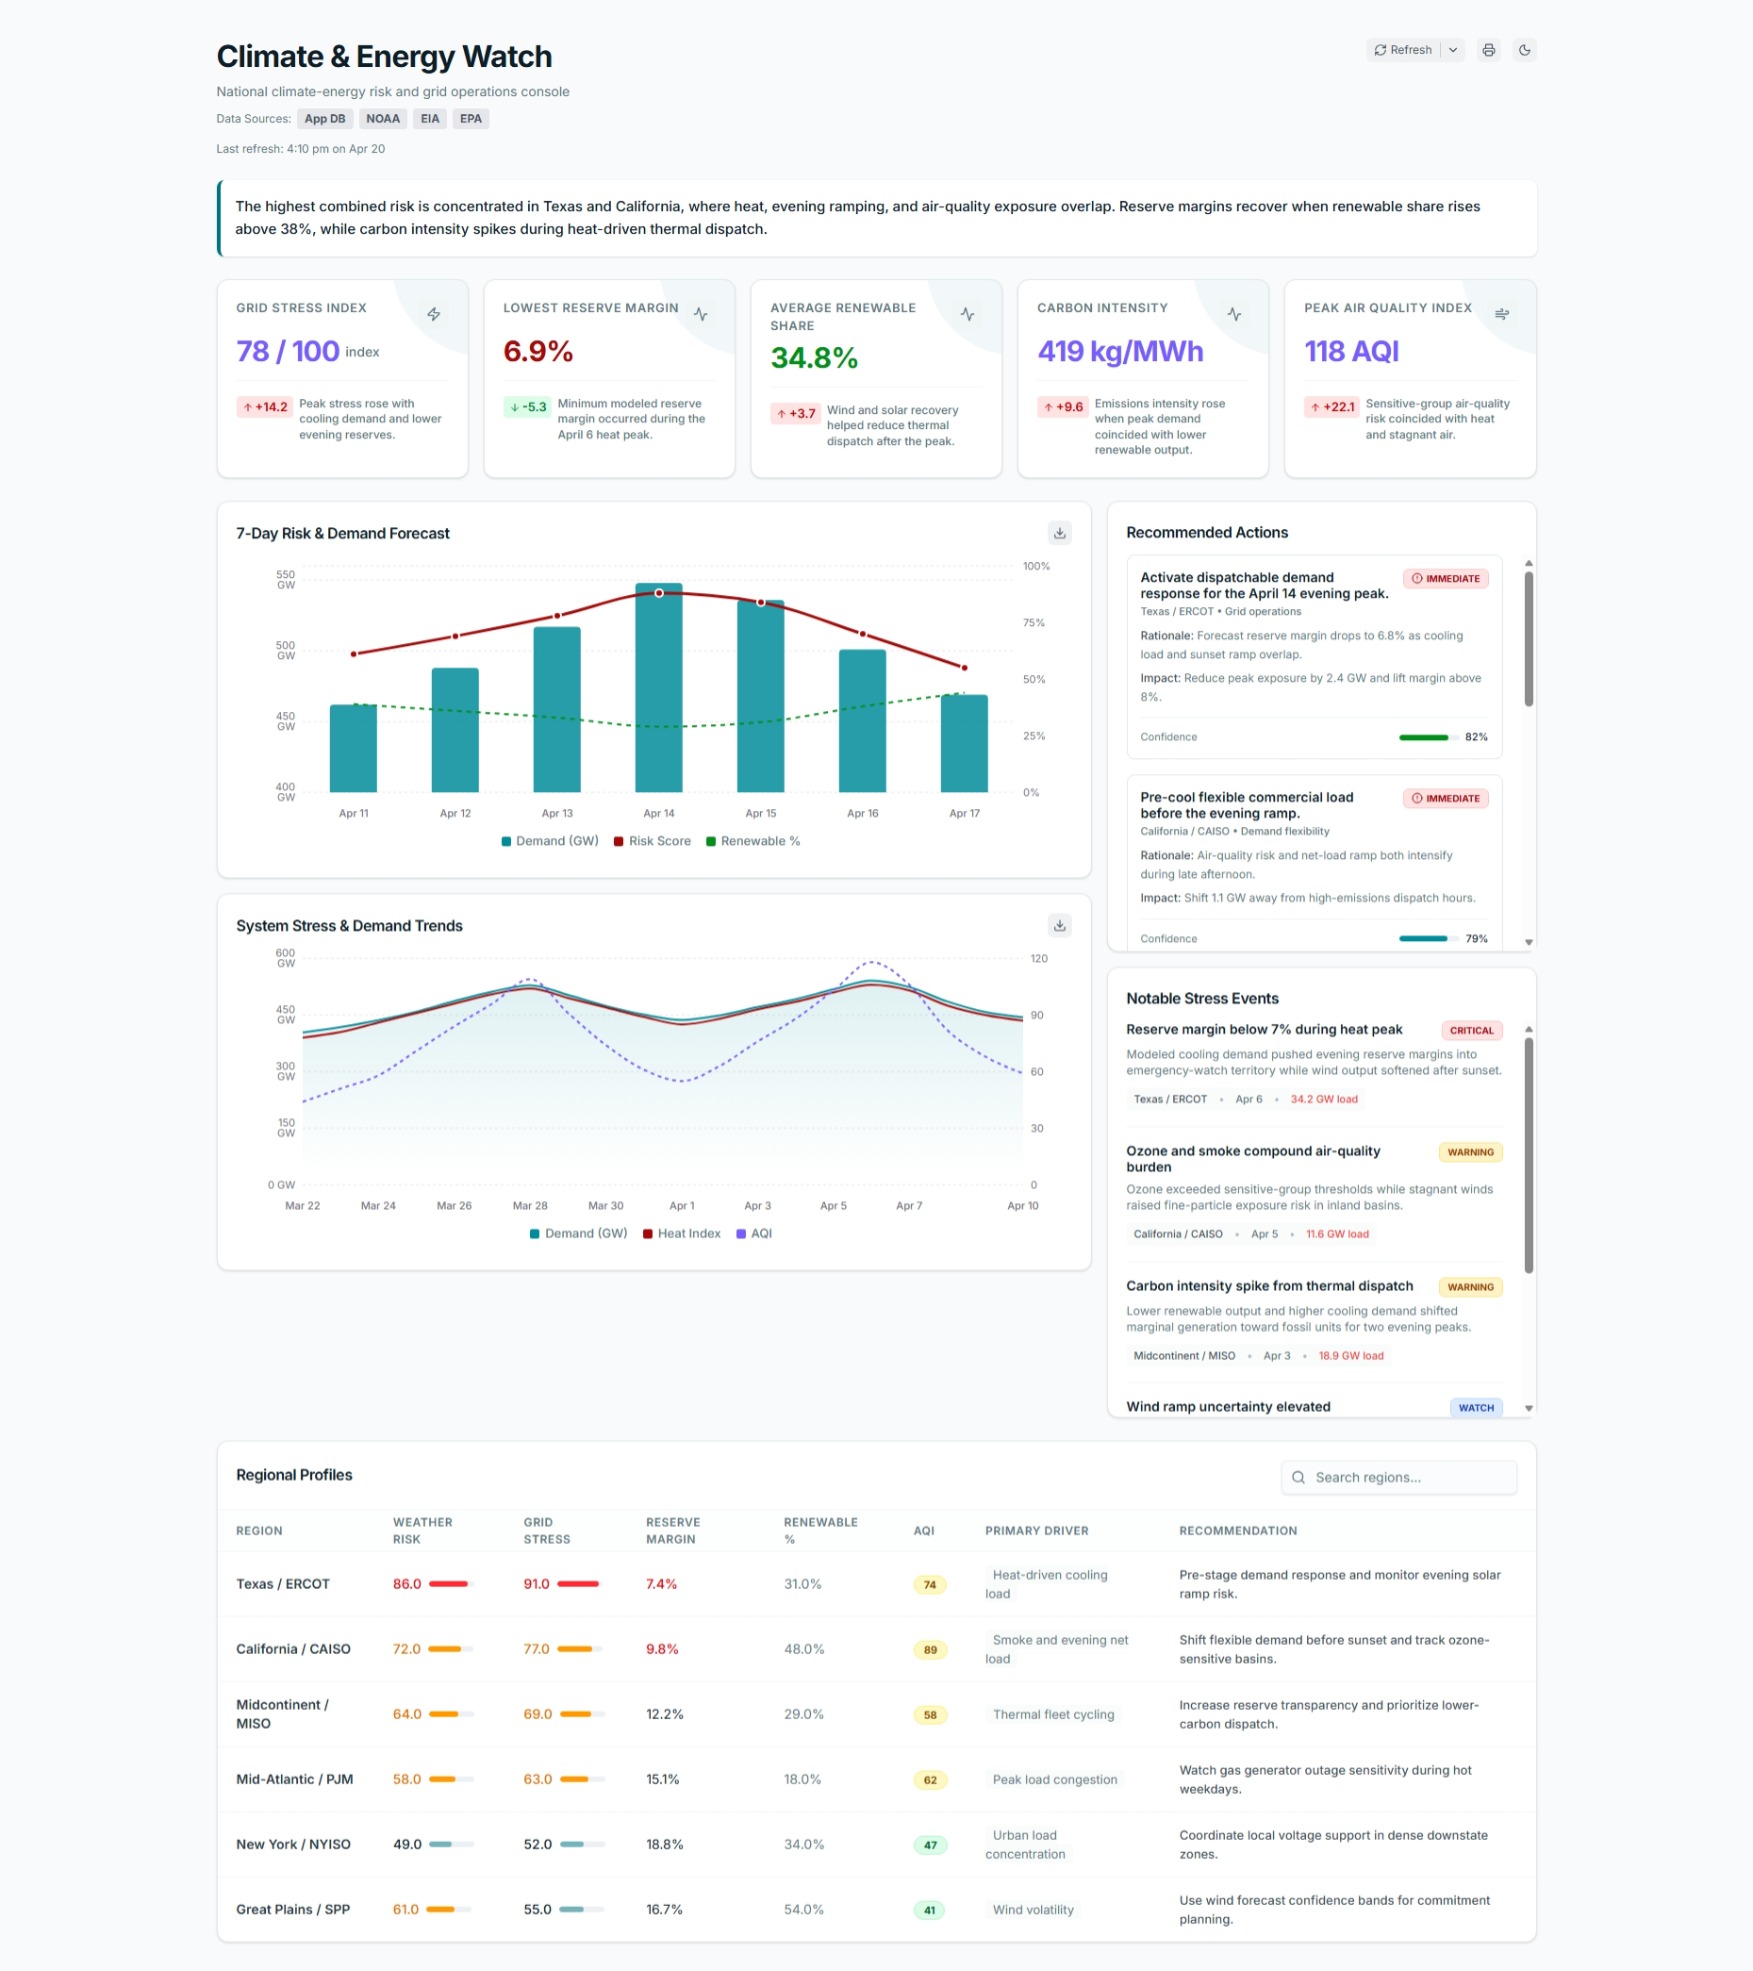
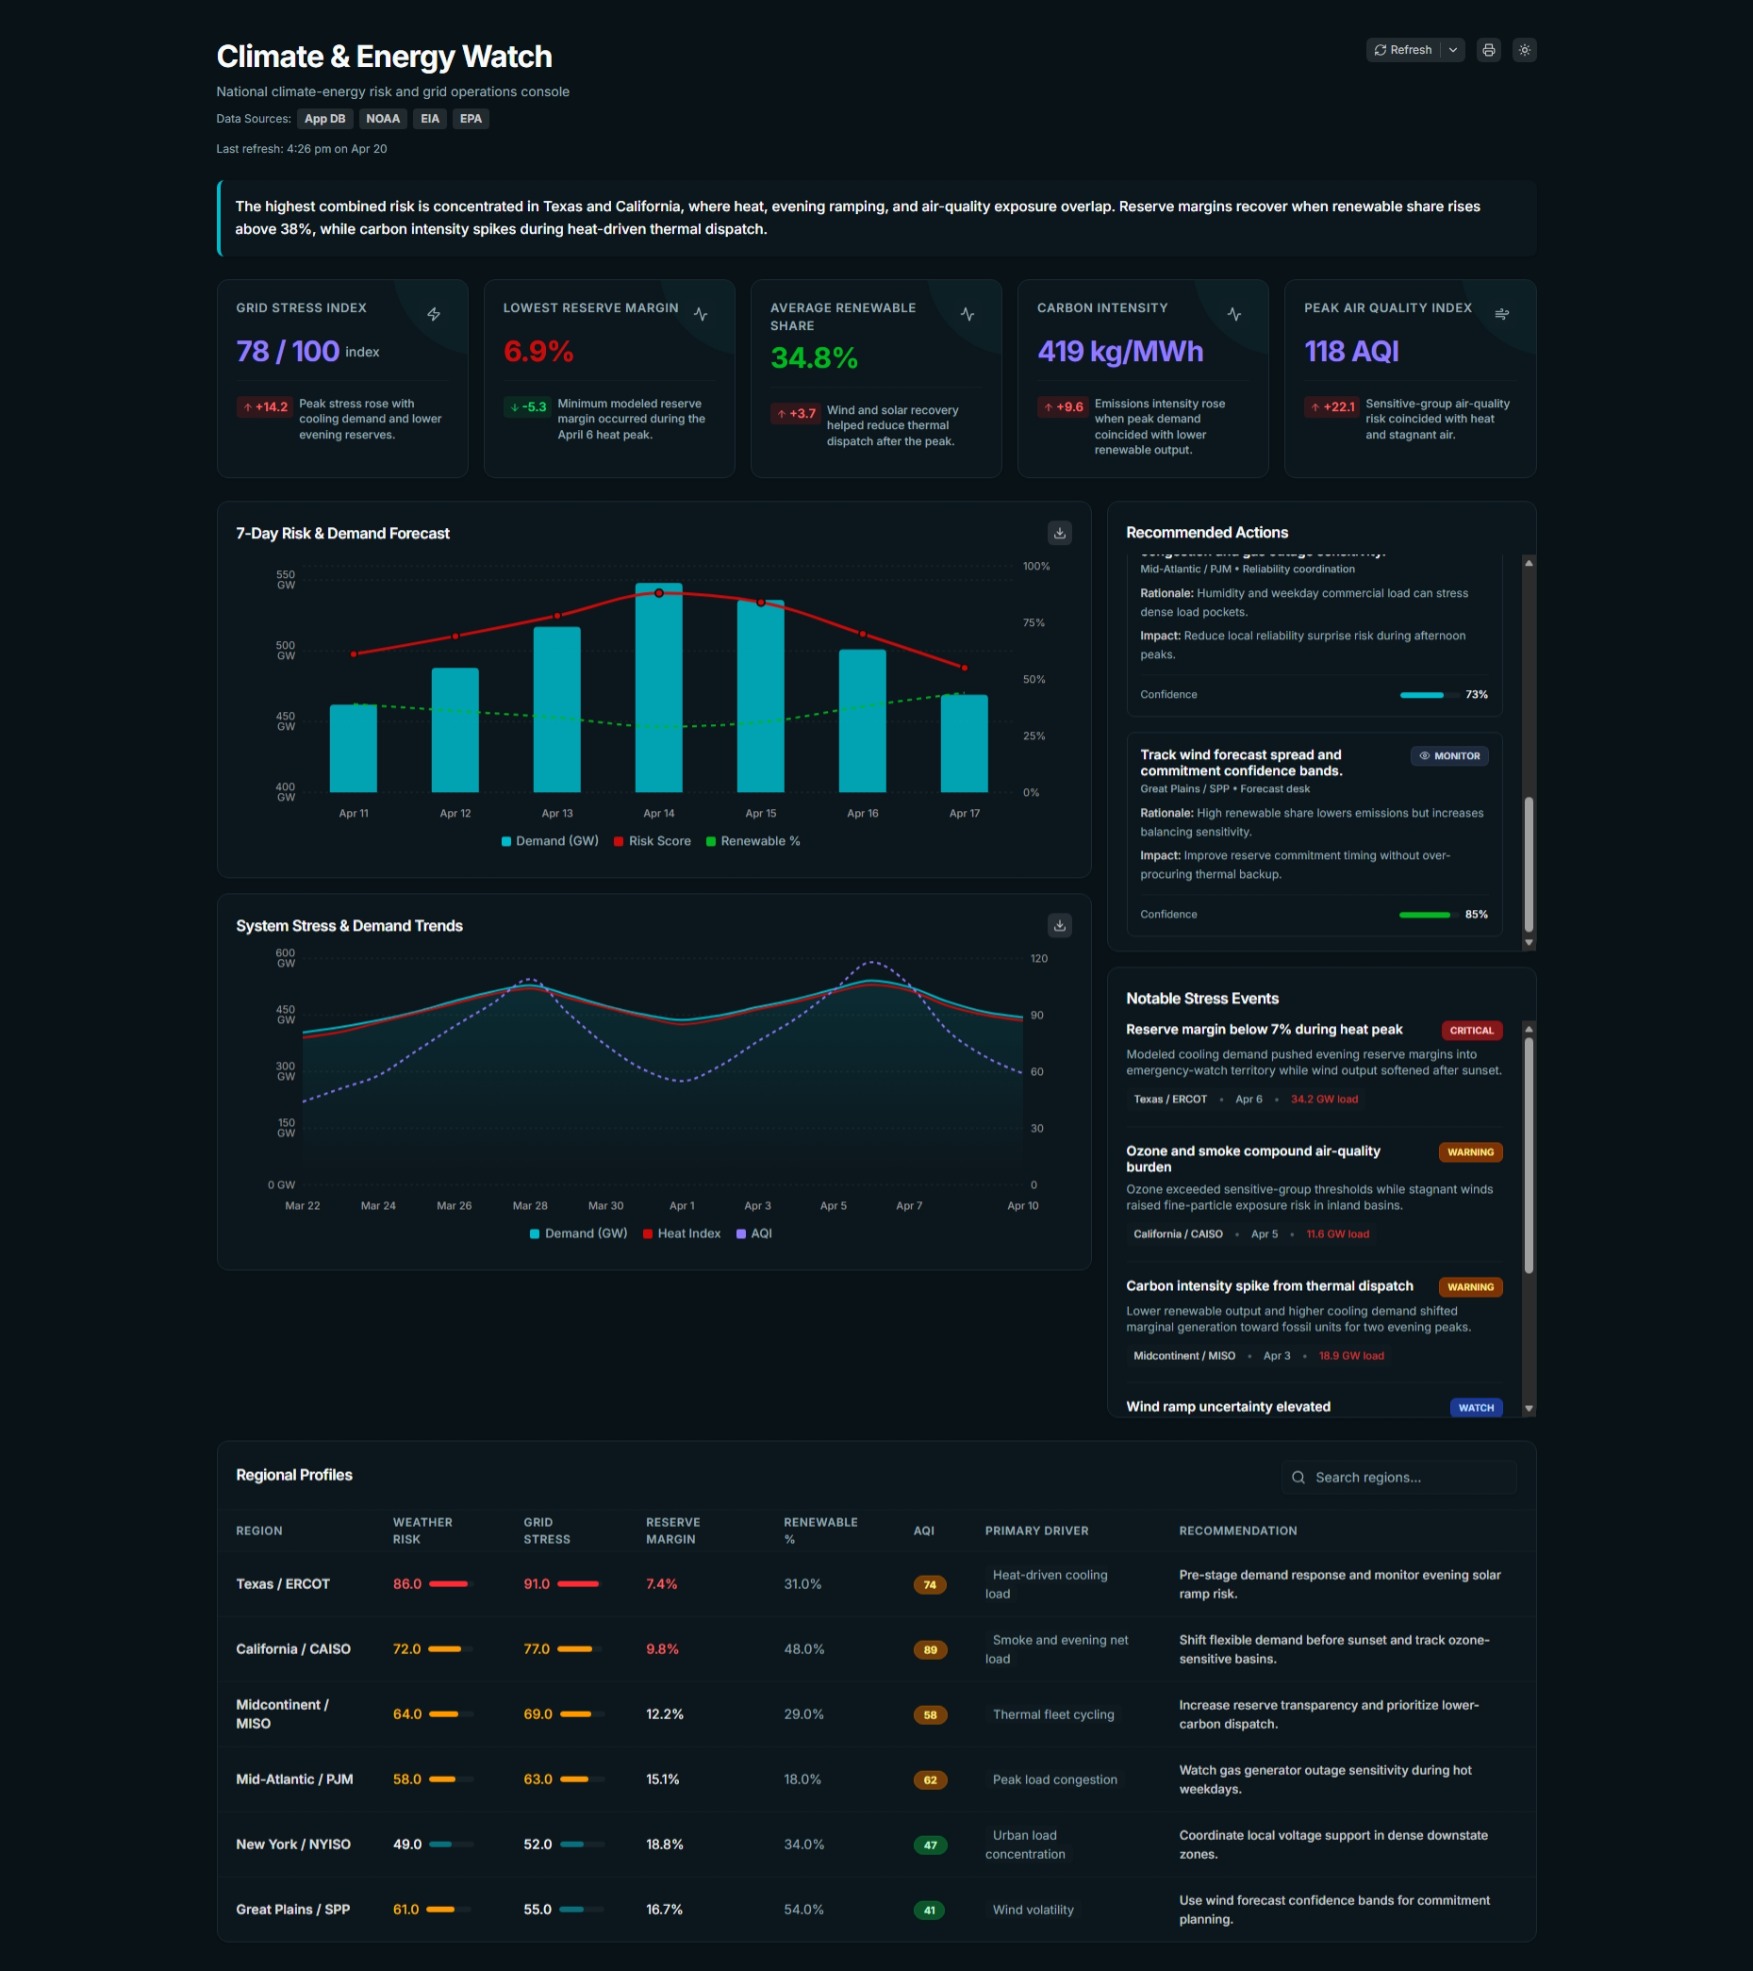
Climate Grid Watch collects, normalizes, and visualizes climate data across geographic grids.
It:
- Pulls data from multiple APIs (temperature, rainfall, wind, humidity).
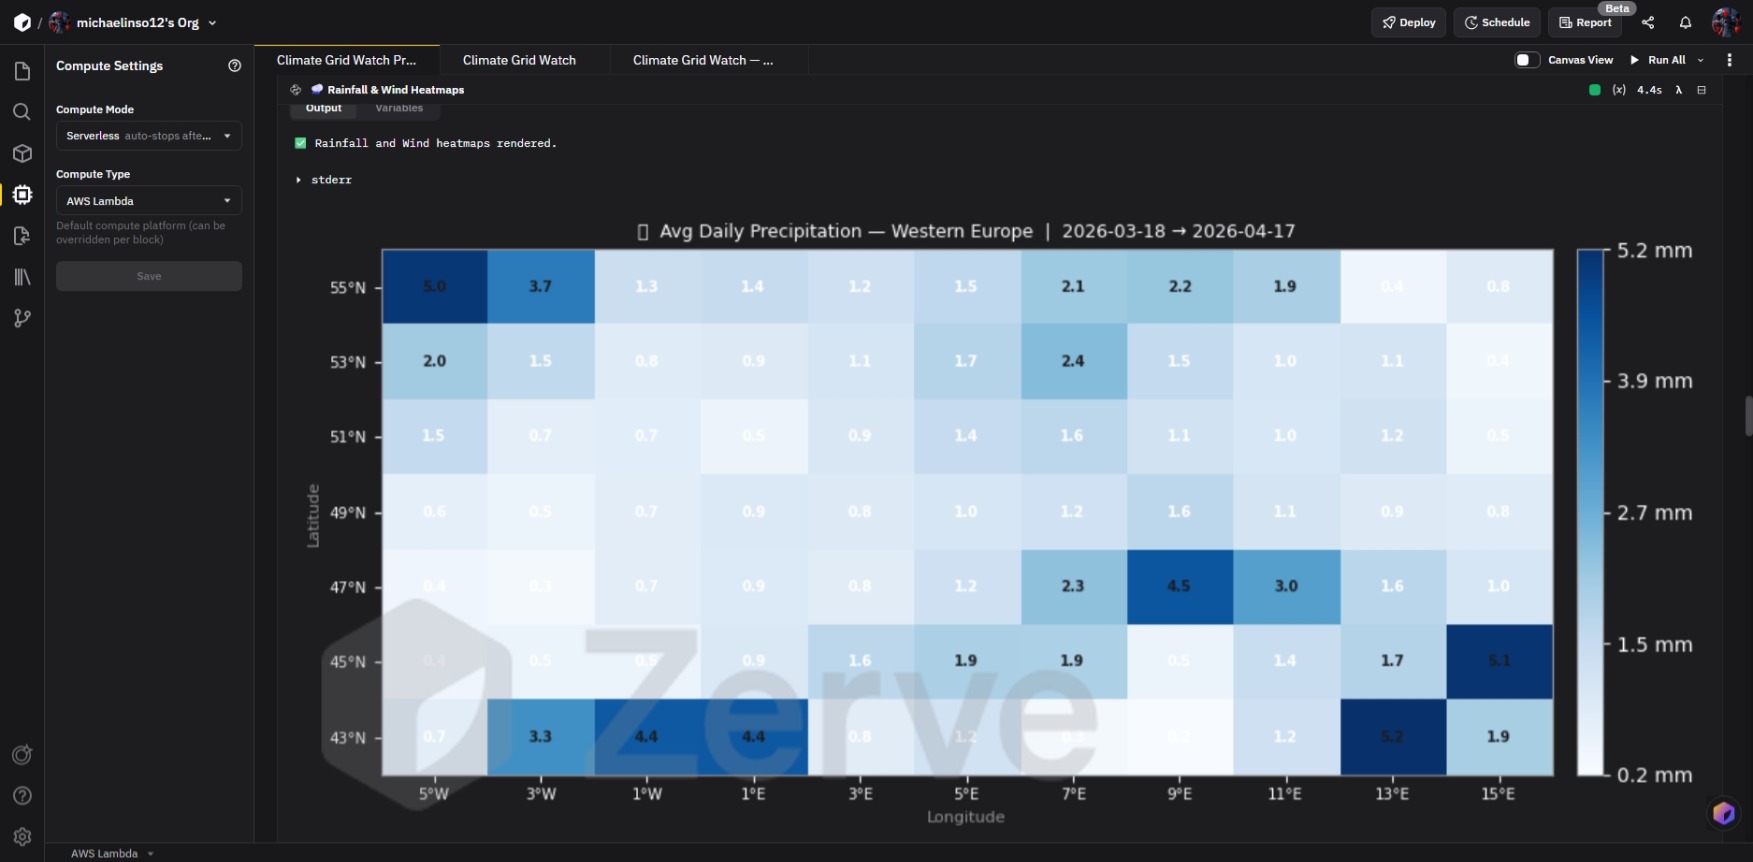
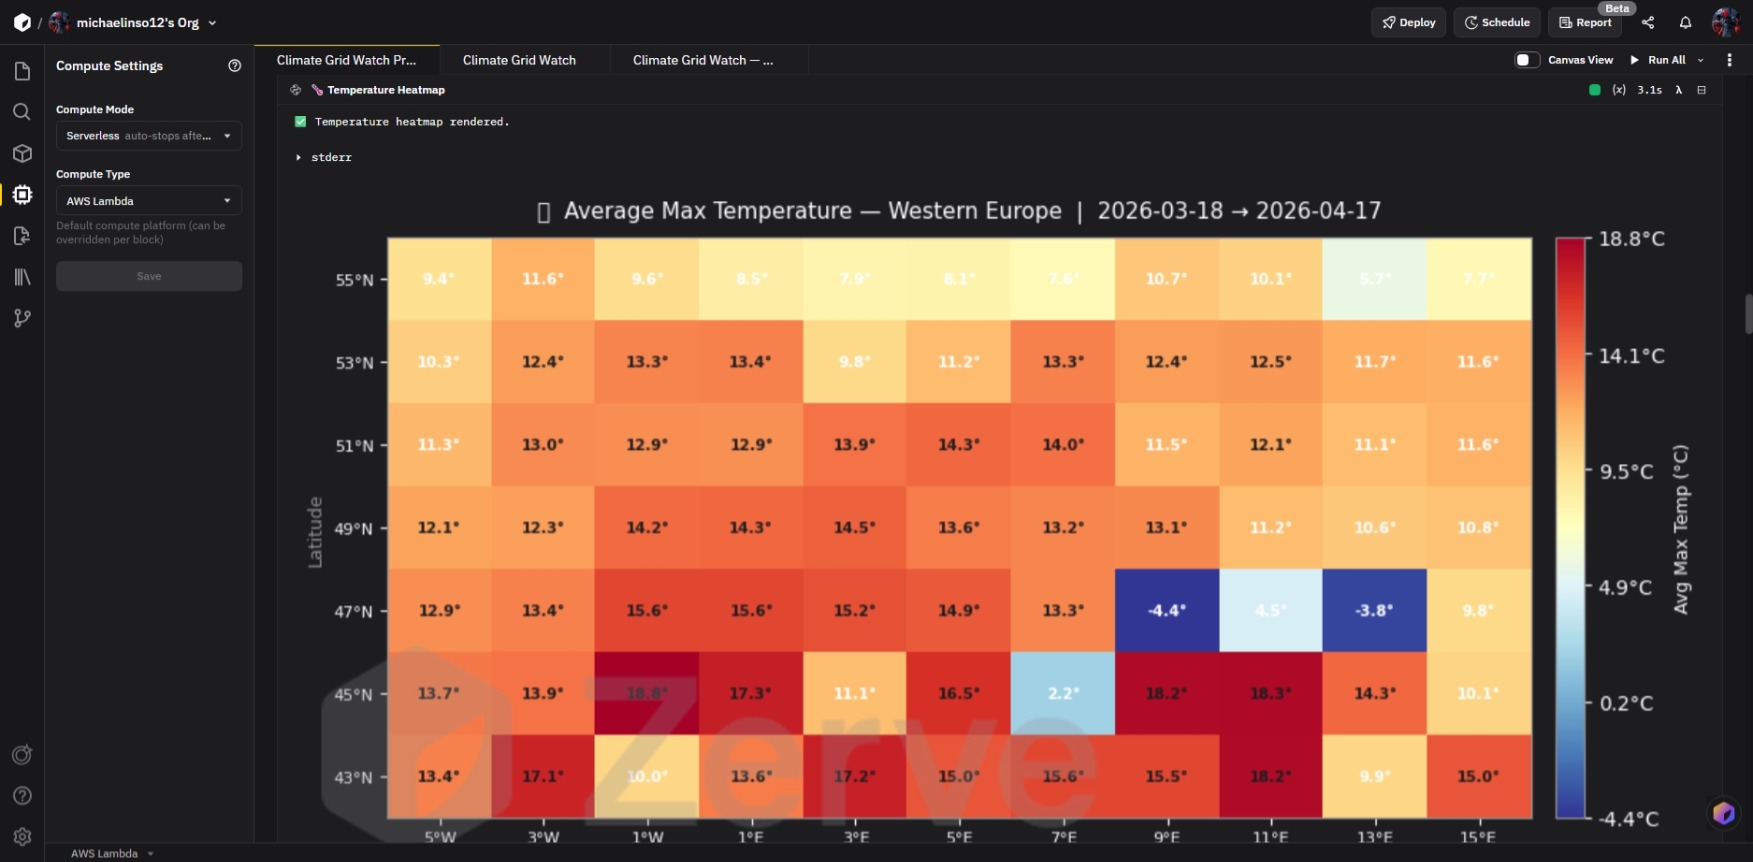
- Converts raw metrics into grid‑based visualizations for easy comparison.
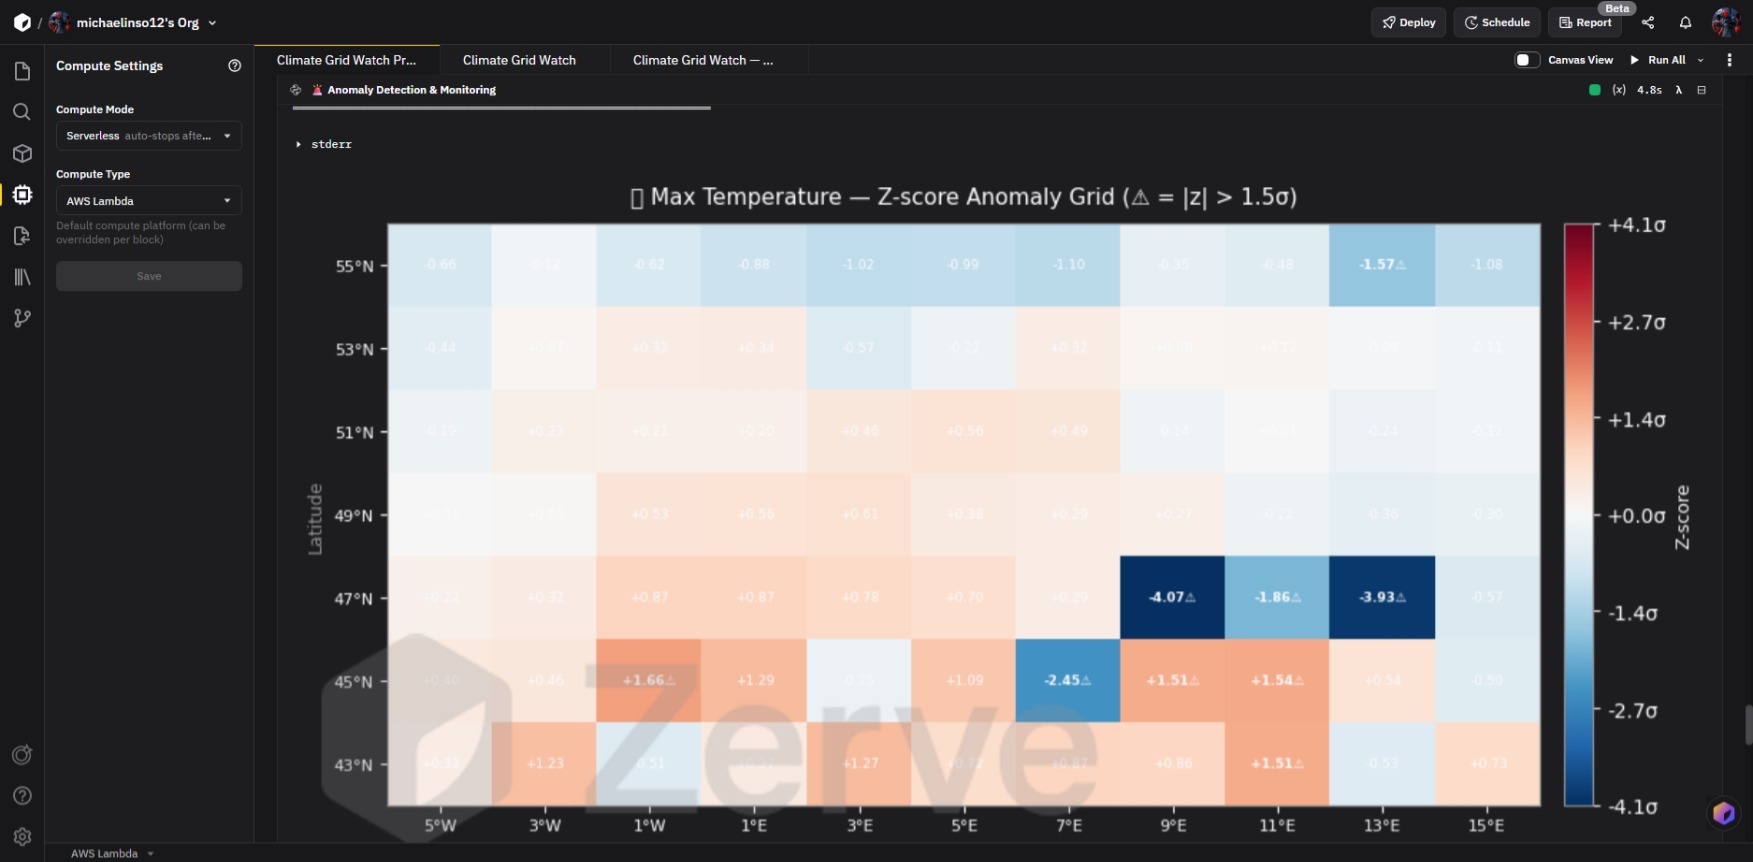
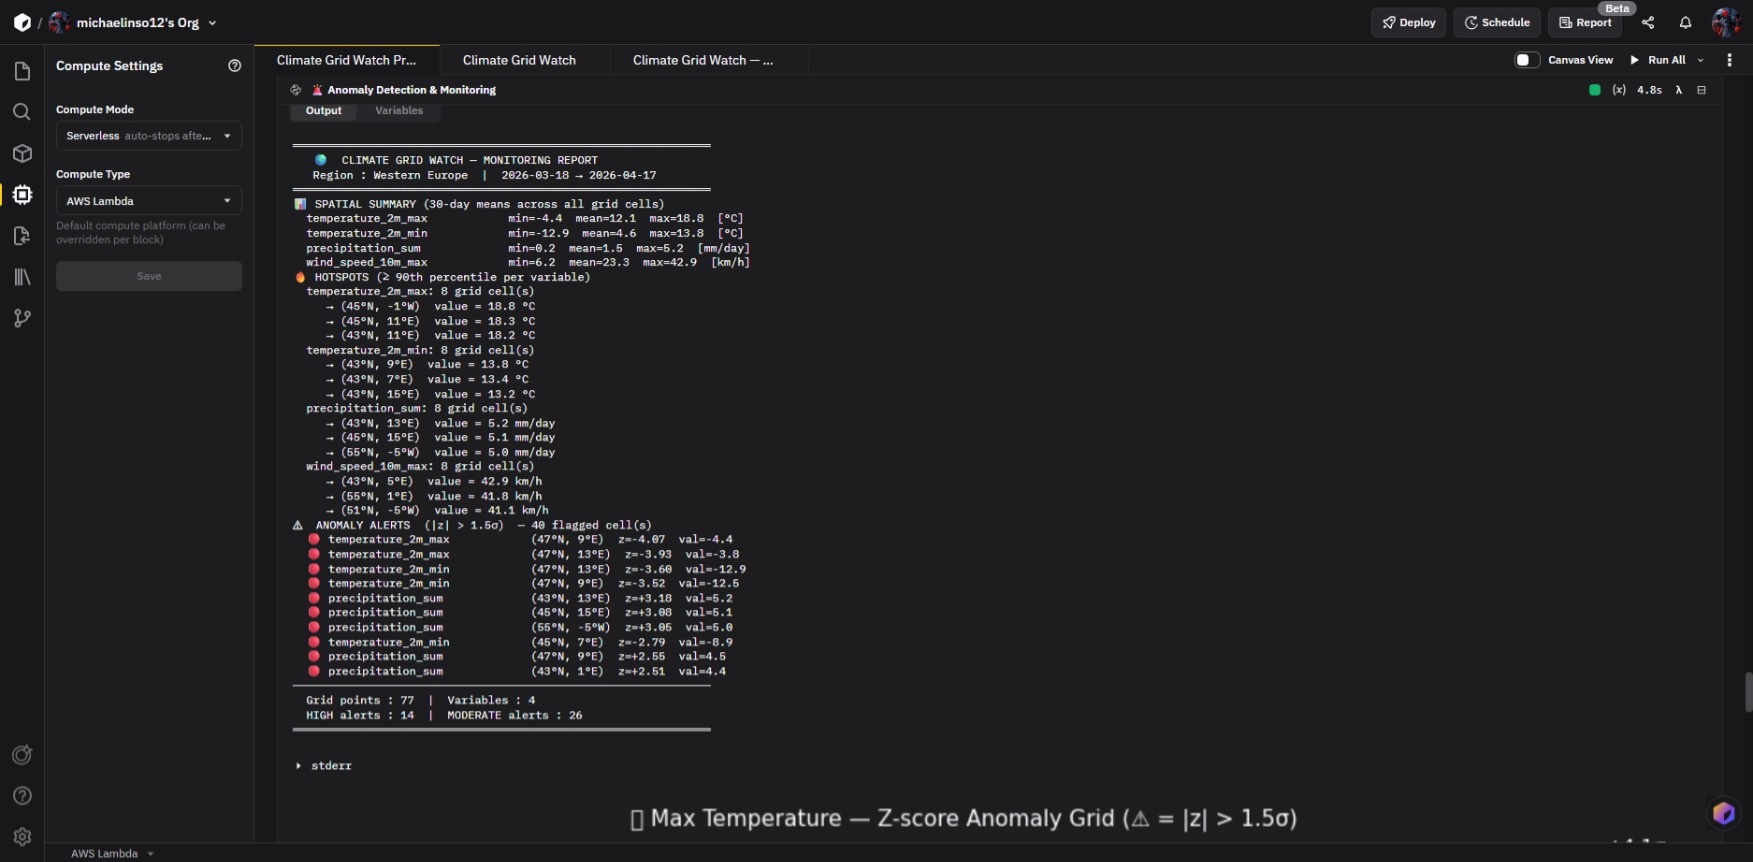
- Generates dynamic charts and heatmaps for anomaly detection.
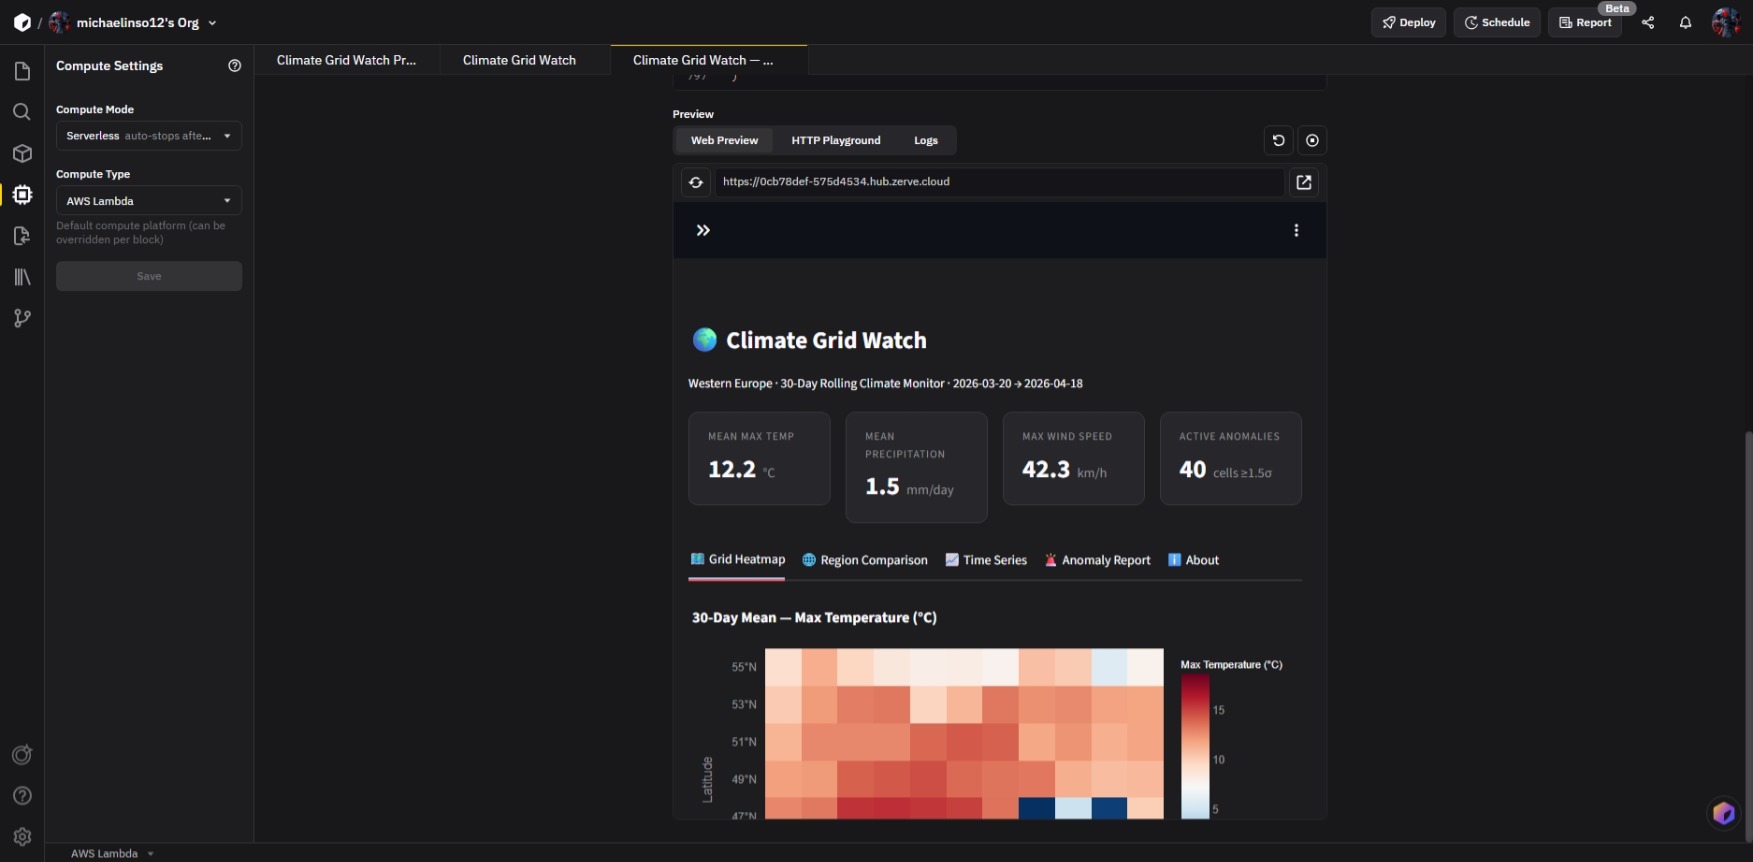
- Provides modular dashboards for researchers, analysts, and educators.
- Supports AI‑ready data exports for predictive modeling and environmental forecasting.
🧠 How we built it
The system was built using:
- Python for data ingestion and processing.
- Pandas and NumPy for grid normalization and statistical analysis.
- Matplotlib and Plotly for visualization.
- Flask for lightweight API endpoints.
- Replit for cloud execution and collaborative development.
- Zerve Cloud for scalable compute notebooks and AI‑driven workflow orchestration.
- GitHub Actions for automated deployment and version control.
Each module is designed to be plug‑and‑play — new data sources can be added without breaking existing workflows.
🚧 Challenges we ran into
- Data inconsistency: Different APIs use varying units and formats, requiring complex normalization.
- Performance bottlenecks: Large datasets slowed down visualization rendering, solved through caching and async calls.
- Scalability: Designing a grid system that works globally without losing resolution.
- API limits: Managing rate limits and authentication securely without static tokens (inspired by the Token Vault concept).
- Visualization clarity: Balancing aesthetics with scientific accuracy in heatmaps and dashboards.
🏆 Accomplishments that we're proud of
- Built a fully modular climate visualization engine that runs seamlessly on Replit and Zerve Cloud.
- Achieved real‑time data updates with minimal latency.
- Designed a grid‑based mapping system that can scale from local to global datasets.
- Integrated AI‑ready data exports for future predictive models.
- Created a clean, educational interface that makes complex data accessible to non‑experts.
📚 What we learned
- The importance of data normalization when combining multiple climate sources.
- How ephemeral tokens and scoped access dramatically improve API security.
- That visualization isn’t just about aesthetics — it’s about storytelling through data.
- Collaboration tools like Replit, Zerve Cloud, and GitHub can accelerate development even for complex analytical projects.
- Climate data can be democratized through open, modular frameworks.
🔮 What's next for Climate Grid Watch
- Integrate AI forecasting models for temperature and rainfall prediction.
- Add interactive dashboards with user‑defined grid overlays.
- Expand to include satellite imagery and oceanic data.
- Deploy a public API for developers to plug in their own datasets.
- Partner with educational and sustainability organizations to make climate insights accessible worldwide.


Log in or sign up for Devpost to join the conversation.