Inspiration
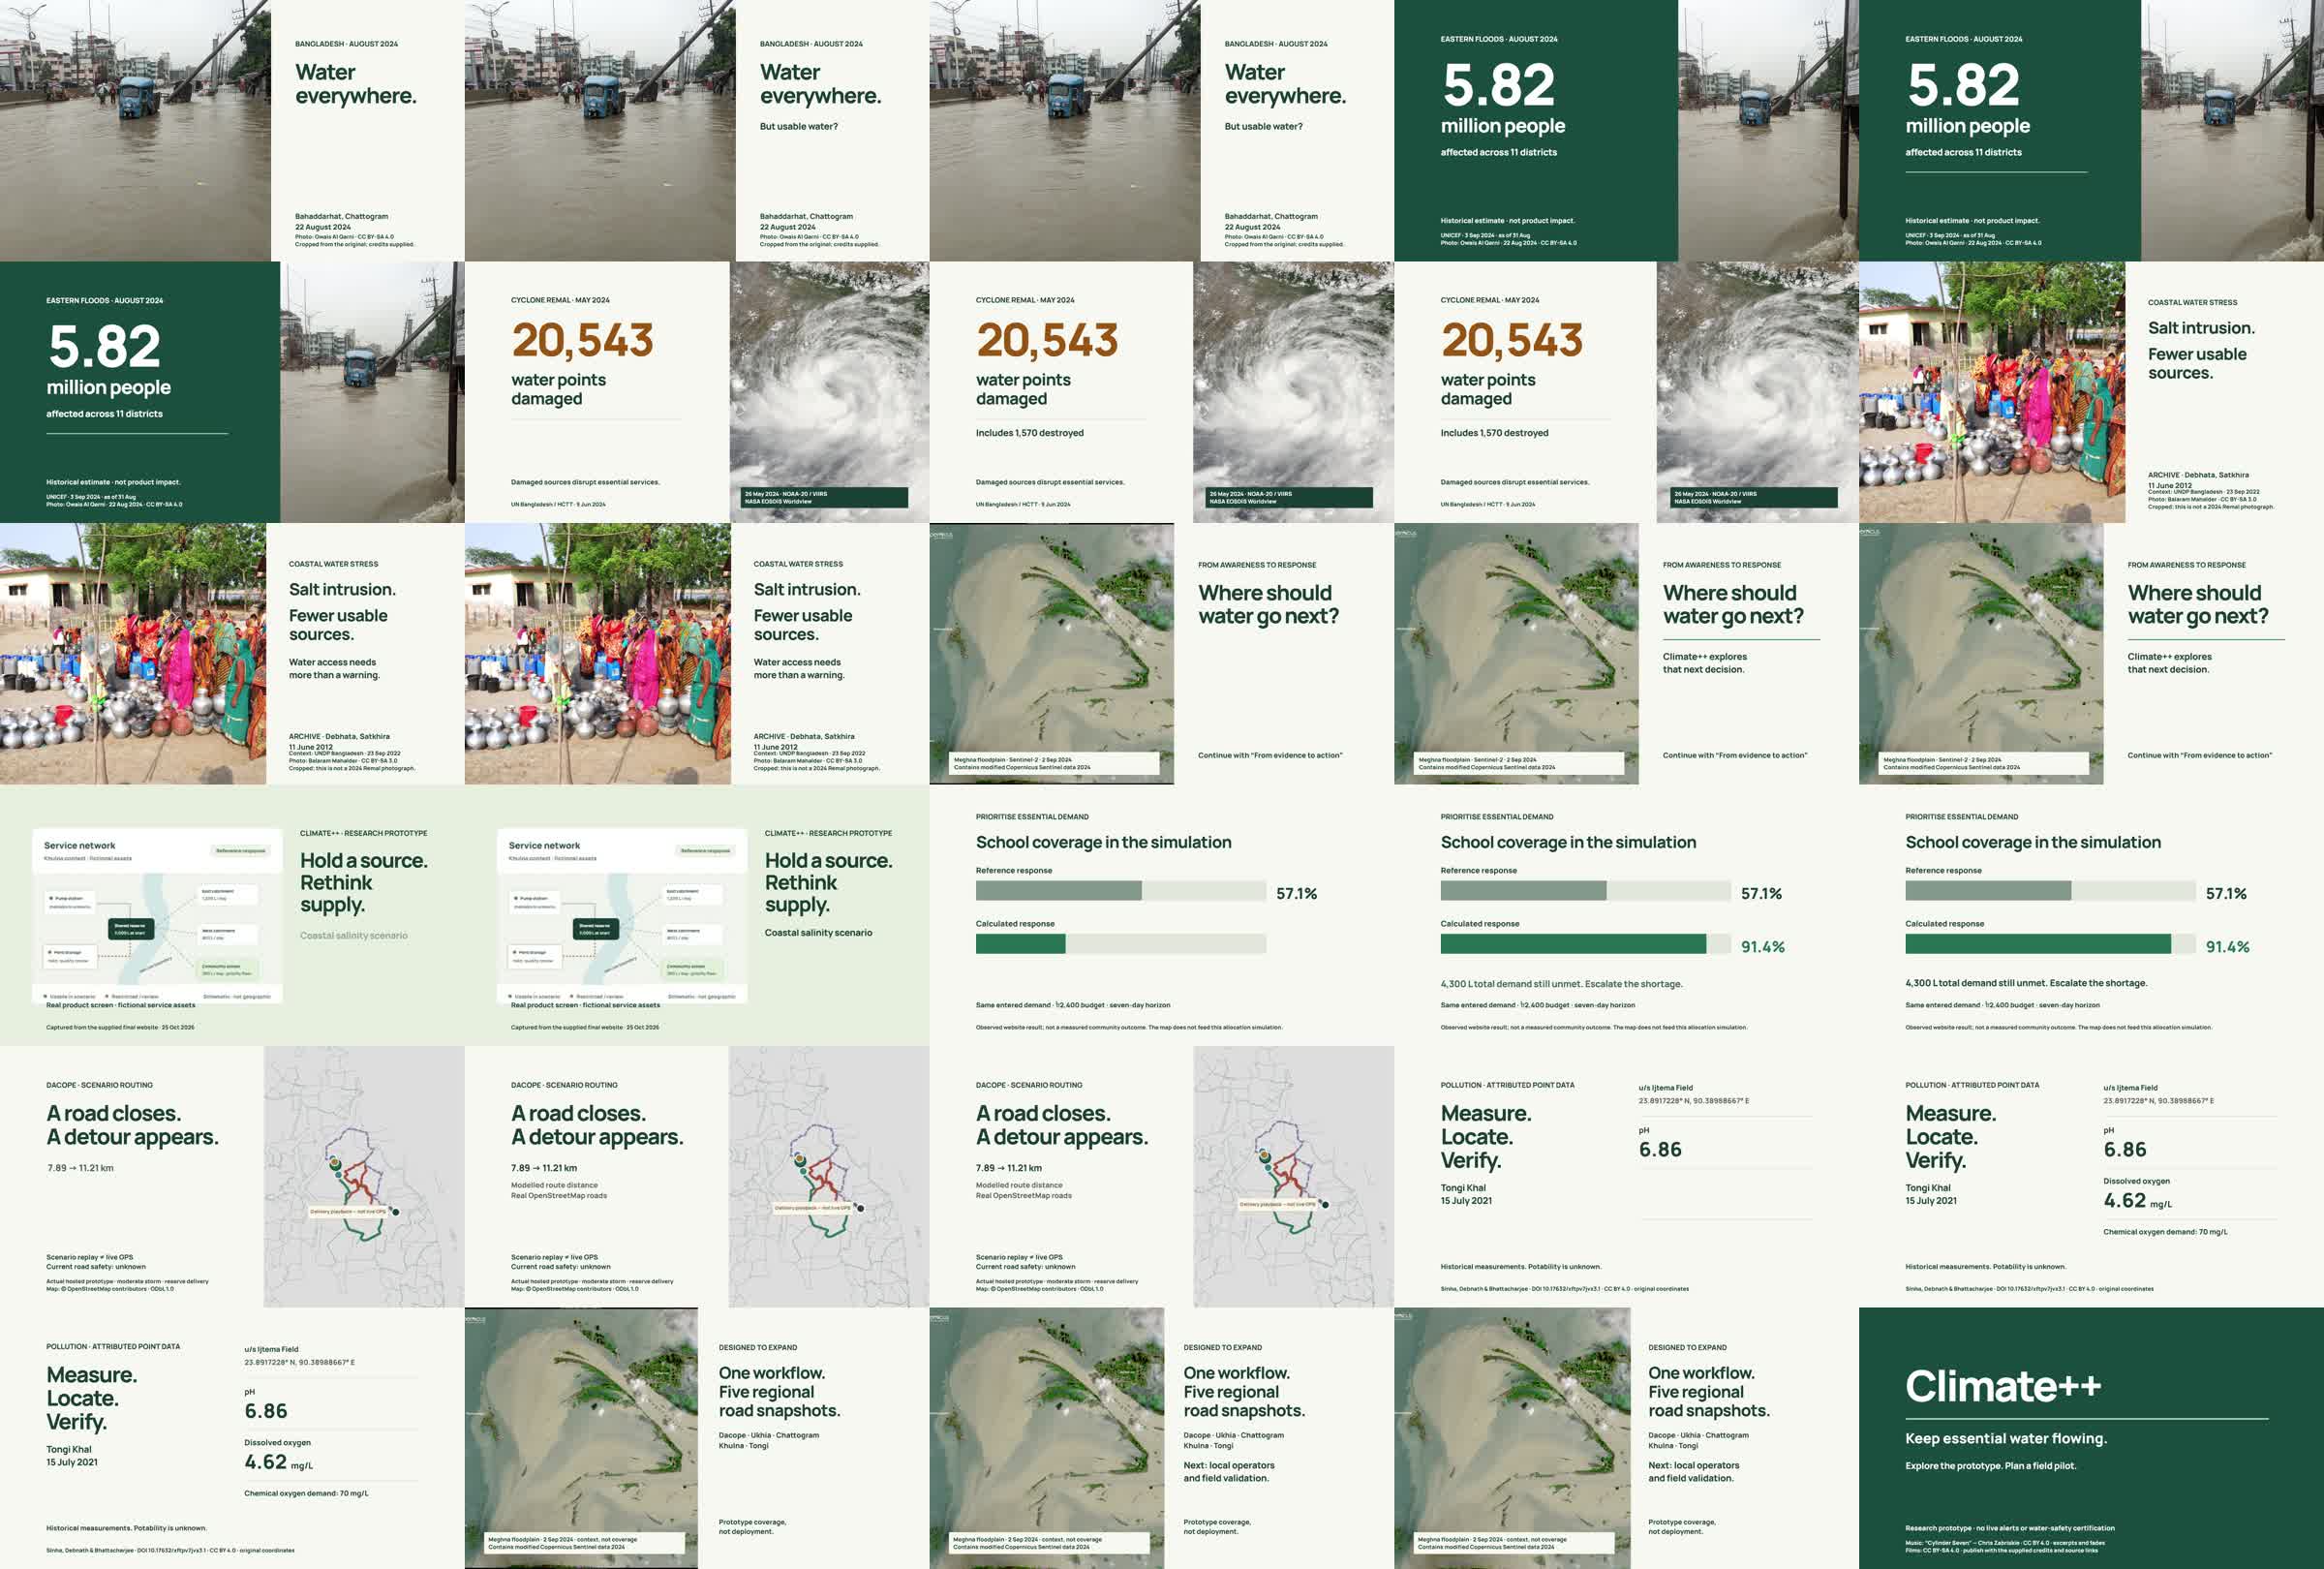
When a storm hits coastal Bangladesh, two problems arrive together: roads close, so fresh-water deliveries slow down, and river pollution decides which water is safe to supply. Planners usually see these separately, if at all. Moreover, every year a lot of people especially in the underdeveloped regions of Bangladesh falls under the fresh water crisis. Salinity, river erosions, coastal erosions are some disasters that happen almost every year and according to the climate news, the situation is expected to keep getting worse. If a system/framework is not attempted to provide fresh water and somehow help the common people with the fresh-water distribution, the miseries will keep on continuing. So we wanted one map that shows both, built for the days when water matters most.
What it does
Climate++ is a water response map for calamity days.
- Storm response map: pick a storm (Moderate or Severe) in one of five regions. The map shows which delivery trips turn "open", "delayed" or "extreme delay", and how routes detour.
- Customer pollution check: click a place or add customers, and see the river pollution intensity near each one (nearest point, worst class within 1, 2 and 5 km).
The delay status comes from a simple ratio:
$$ f = \frac{t_\text{scenario}}{t_\text{clear}}, \qquad \text{open: } f<1.2,\quad \text{delayed: } f\ge1.2,\quad \text{extreme delay: } f\ge1.75 $$
In Dacope, a 7.89 km trip takes 1.42× longer in a moderate storm and about 2.0× longer in a severe one.
How we built it
- Plain React 19 + Vite + Leaflet, deployed as a static site.
- Road networks come from OpenStreetMap. Routing runs in the browser on a graph built per region in QGIS
- In Dacope, storm polygons close the roads they touch. In the other four regions, synthetic slow zones cut travel speed (to 0.5× for moderate, 0.2× for severe).
- Pollution uses a published Kaggle pollution-intensity grid (9,958 points, MIT licence).
- A deterministic build script regenerates the storm data, and a data manifest lists every dataset with its checksum and licence. 65 automated tests pass.
Challenges
- Honesty about data: Storm areas are labelled scenarios, not live alerts. The pollution grid has no dates, units or lab validation, so we call it an intensity score. Places beyond 1.5 km from the grid are shown as "outside grid", never "clean".
- Making delay meaningful: A road that is "closed" is a claim we can't verify, so we measure delay as a ratio and use the term "extreme delay".
- Licenses: Mixing OSM (ODbL), Kaggle (MIT) and open boundary data meant tracking provenance for every file.
- Deployment.: The data must load from the site root, so the build can't sit in a sub-path.
What we learned
- A clear provenance label builds more trust than a confident-looking number.
- A small, testable model beats a big opaque one in a short hackathon.
- Scenario tools are most useful when they say plainly what they are not.
What's next
Pilots with real water suppliers, validating the pollution scores against field readings, and replacing scenario storms with live alerts and adding more covariates such as flood or aridity to see the effects of different climate conditions and come up with a versatile fresh water distribution solution.

Log in or sign up for Devpost to join the conversation.