-
-
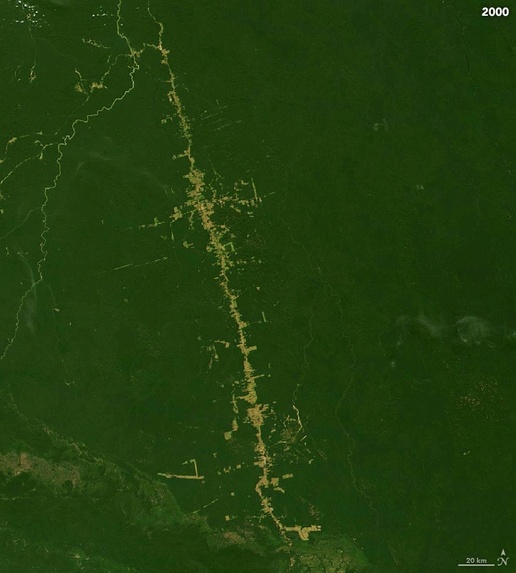
AmazonRainforest2000
-
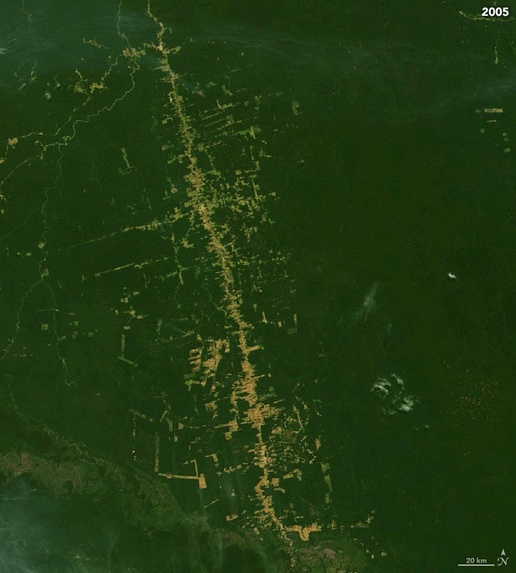
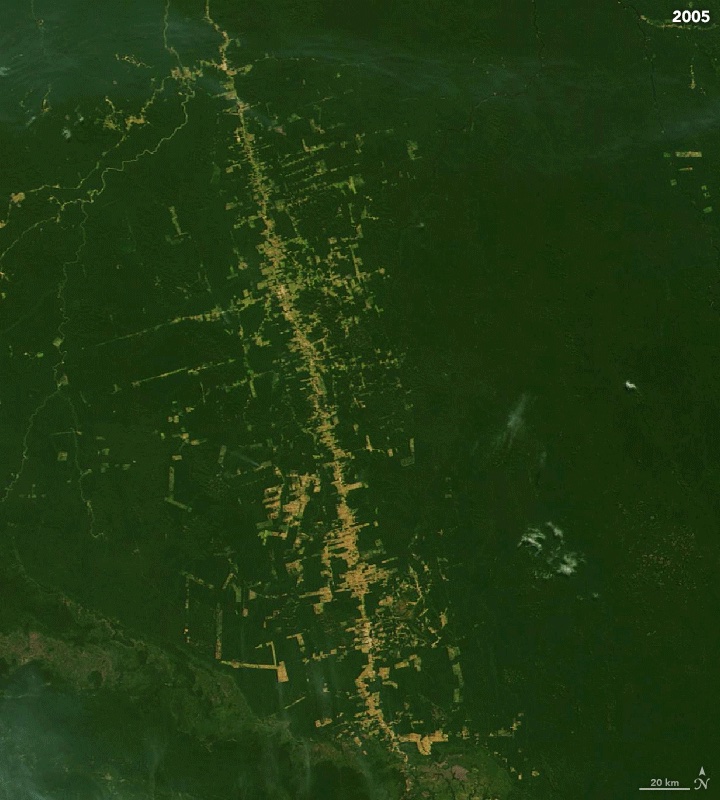
AmazonRainforest2005
-
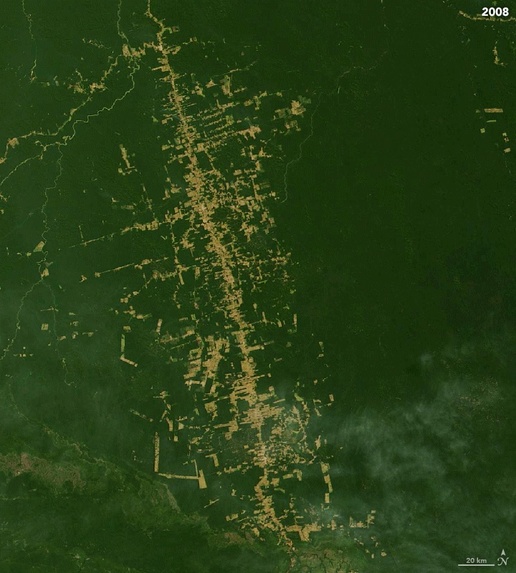
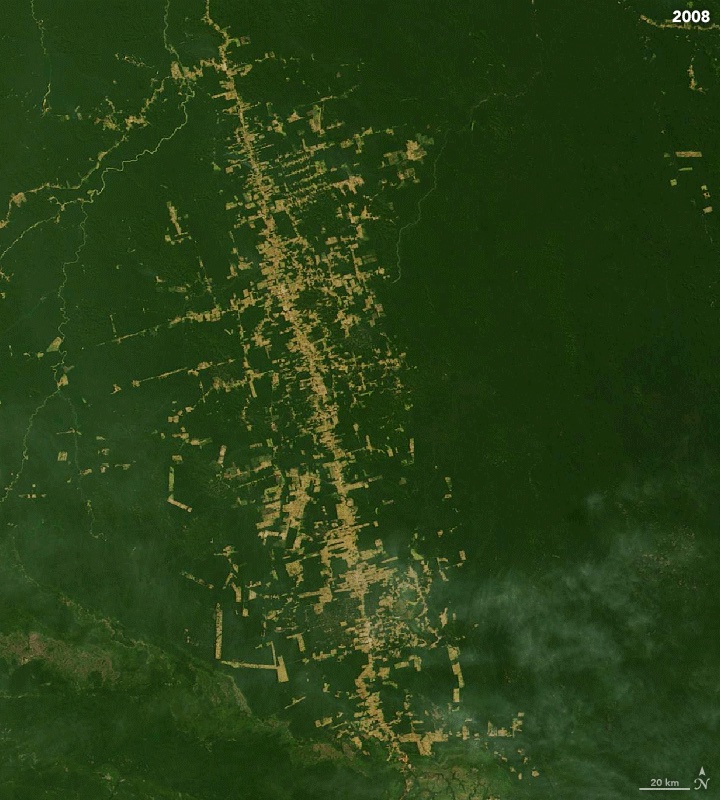
AmazonRainforest2008
-
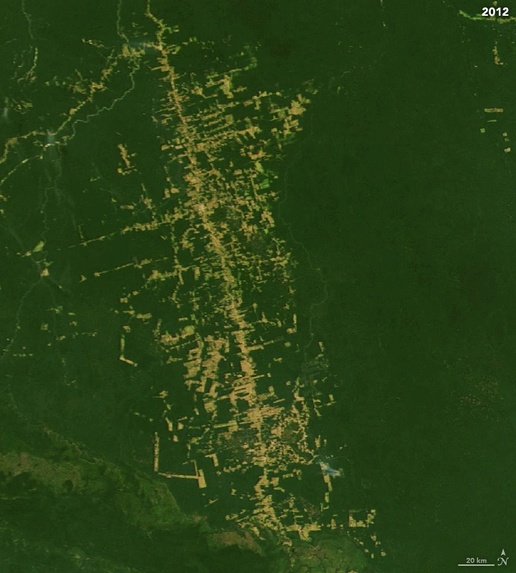
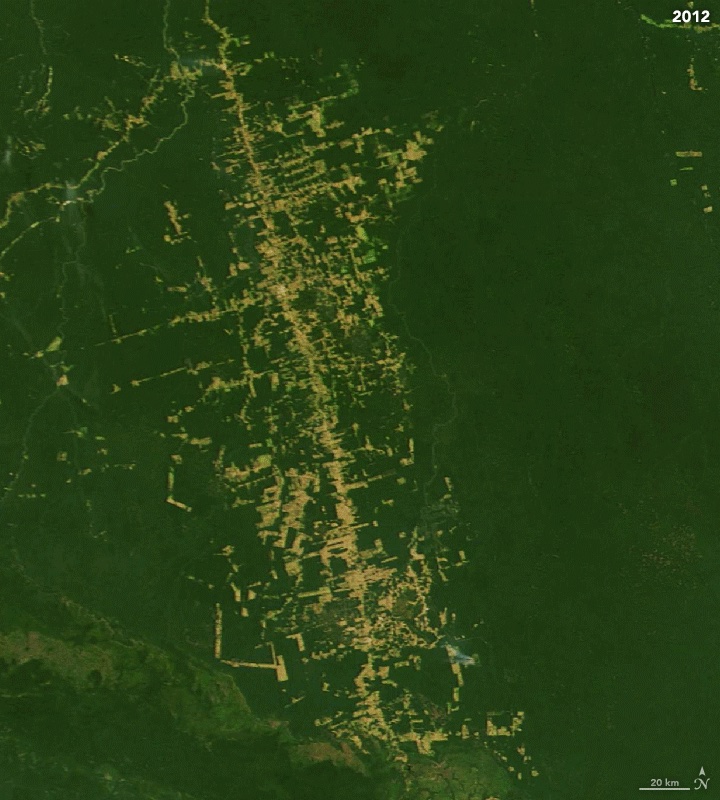
AmazonRainforest2012
-

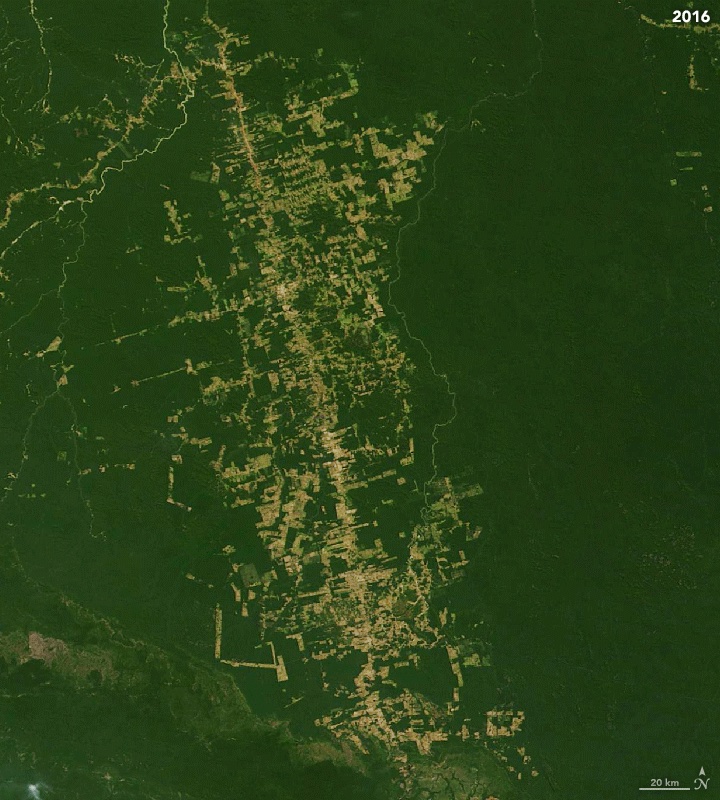
AmazonRainforest2016
-
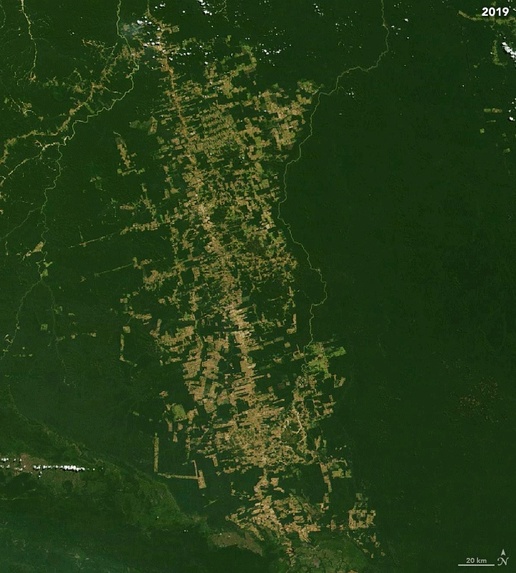
AmazonRainforest2019
-

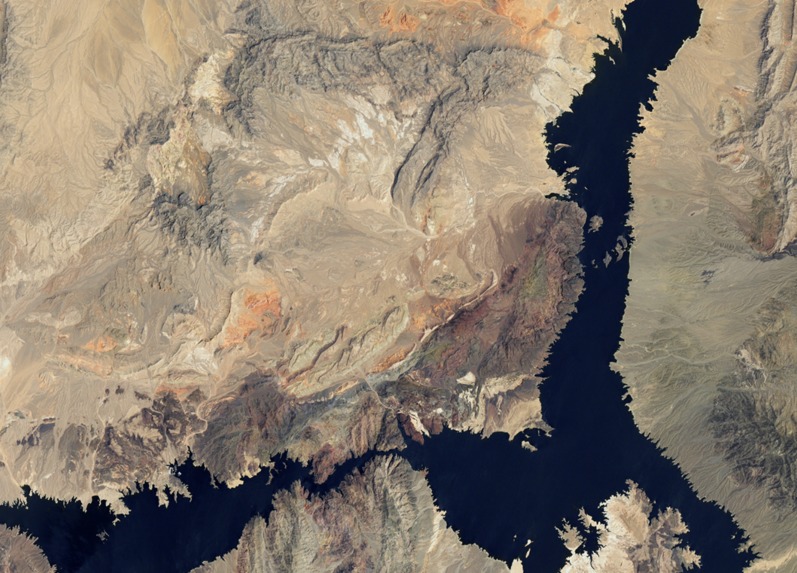
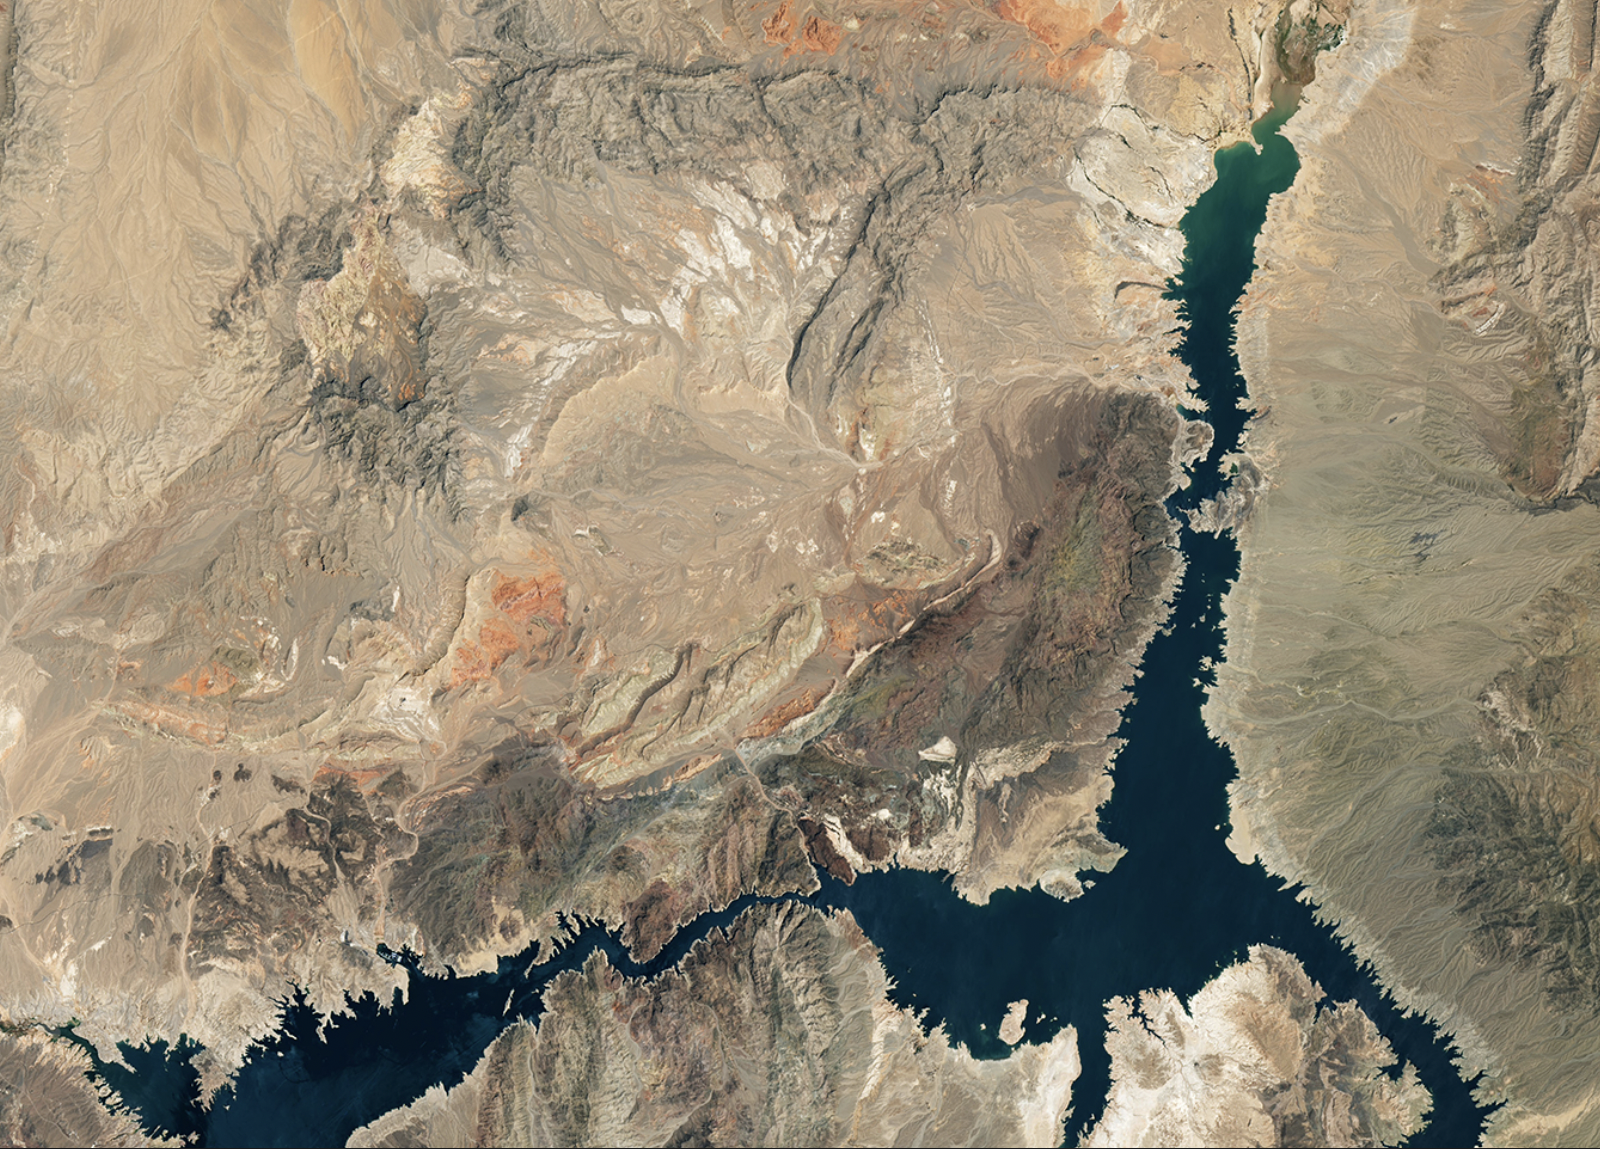
LakeAfter
-
LakeBefore


Inspiration
The Climate Crisis has become increasingly concerning over the years. We wanted to contribute toward solving this major problem, so we decided to create this project on the Causes and Effects of Climate Change.
What it does
In order the emphasize the causes and effects, we focused on one main cause, and one main effect of climate change: Deforestation in the Amazon Rainforest, and the Drying of Lake Mead. Our project includes two main parts. The first part is a program that analyzes satellite images and outputs data about the progression of the causes and effects of climate change. For the deforestation of the Amazon Rainforest, it outputs a percent representing the the amount of forested area in the rainforest. For the drying of Lake Mead, the output is the area of the remaining parts of the lake. This program can also be used to analyze many different images, so it is also reusable.
The second part of our project is an awareness website, showcasing the satellite imagery we used, along with the data output from our program. This website will help spread awareness on the crisis at hand. Also, the data is accurate and can be used for different projects by many different people.
How we built it
The program we designed to analyze the images works by going through each pixel and analyzing its coloring. Each pixel has an RGB Code, where R, G, and B are separate values, together representing the color of the pixel. For each color and its many different shades, there are multiple subsequent RGB codes, so we were able to accurately figure out the color of the pixel based on what range the RGB code falls into. We tracked the coloring of each pixel, and in the end came up with a ratio and a percent representing the colors.
Challenges we ran into
The only main challenge we faced was finding the imagery and being able to use it with our program. Firstly, finding a trustable source for satellite imagery and exporting the images proved somewhat difficult. However, the bigger problem was in the images itself. Many images has clouds in them, affecting our ratio of the colors. In order to overcome this problem, we had to adjust the RGB Code ranges many times in order to get accurate outputs form the program.
Accomplishments that we're proud of
1) We were able to write the program to analyze images, through the challenges we faced with it. We are proud of the fact that the program can be reused on many different images, not just the ones that we used it with, as the logic used to analyze the images remains the same. 2) We were able to create a fairly well-designed website, and portray our images and data properly. The website properly displays our project and anyone can look at and use the website and its data.
What we learned
We developed our skills in image analysis, by figuring our how to analyze the coloring of the images. We also developed our skills in designing a website. Overall, we were able to learn many new, interesting things, and will definitely use our newfound skills and further develop them in the future.
What's next for Climate Crisis
We hope our website and data reaches many people. We want them to be able to use our finding for what they need. We hope our data and project will be worthwhile and contribute to this crisis we face. We also want to continue to explore our image analysis and use it on many new images. We hope to further develop the program and make it even more useful and better in general
Built With
- css
- html
- javascript
- opencv
- python
- visualstudiocode
- w3spaces

Log in or sign up for Devpost to join the conversation.