-
-
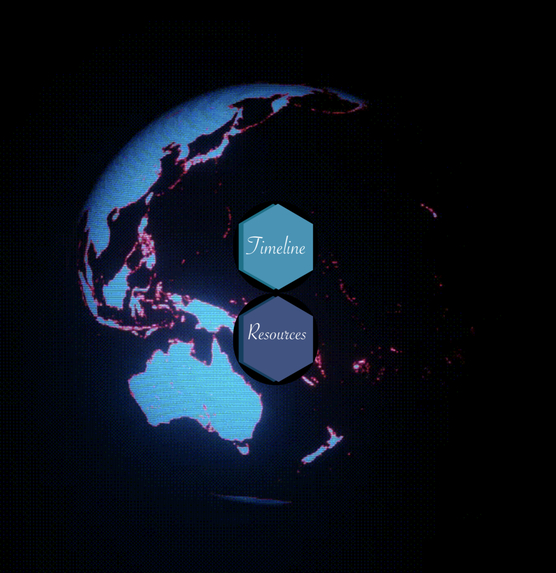
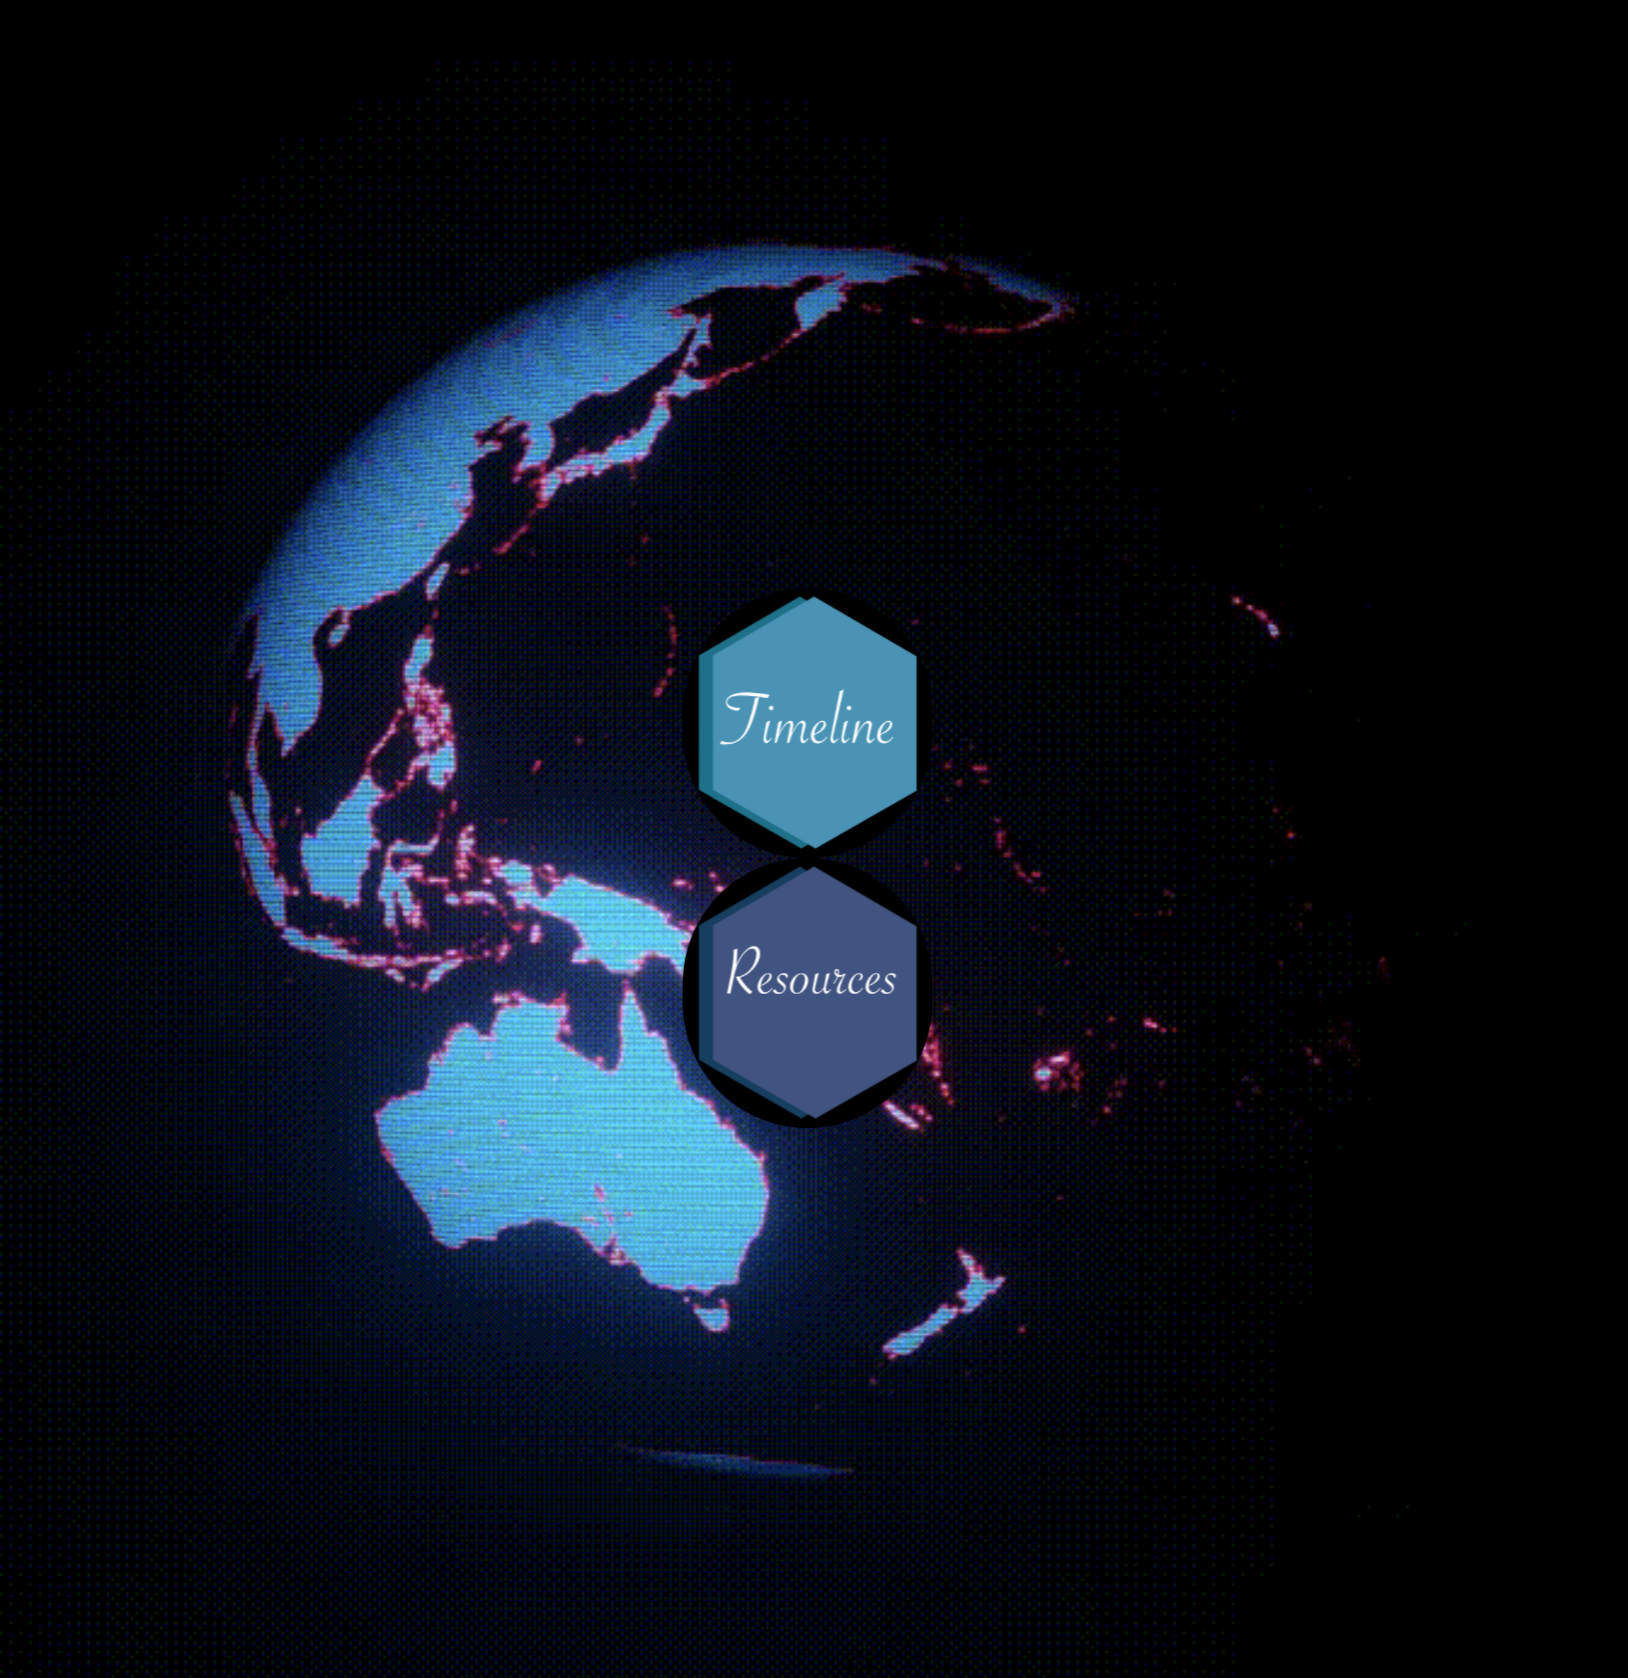
Climate Change Tracker Home screen
Inspiration:
My teammates and I (Christina, Sophia, and myself) were inspired to do this project because climate change is a pressing issue for our generation so we thought that we should make something that would hopefully help get more people informed in a more visual way by using graphs and charts from reliable resources such as NASA, and The European Commission Joint Research Centre.
What it does:
It shows people a forty year timeline of how much climate change
How we built it:
We built it using Thunkable and made the graphics using a 3d software called Blender and Procreate.
Challenges we ran into:
Learning Thunkable and getting used to the interface was hard because there's only so much that you can do with the UI but I think that it worked out in the end.
Accomplishments that we're proud of:
Learning how to get the page layout to work the way we wanted to.
What we learned:
How to adapt to new platforms (Thunkable) quickly and turn out something we're proud of.
What's next for Climate Change Tracker:
To refine the prototype and transfer our skills and what we learned in Thunkable to our future endeavours.
Built With
- thunkable

Log in or sign up for Devpost to join the conversation.