-
Global CO₂ Emissions by Country
-
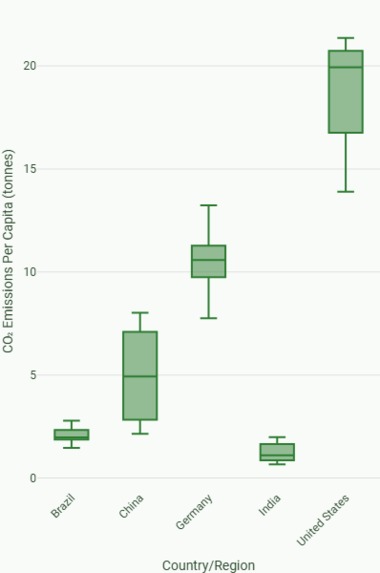
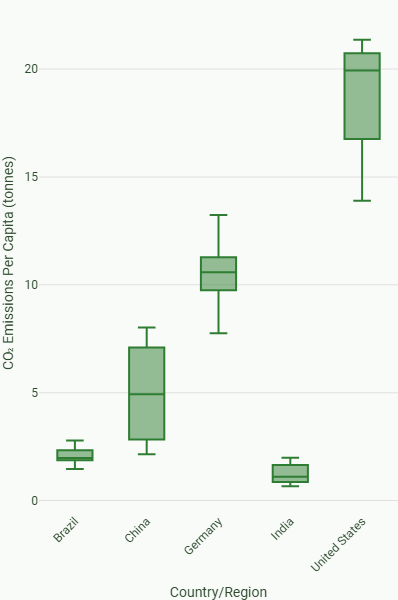
Per Capita CO₂ Emissions Comparison
-
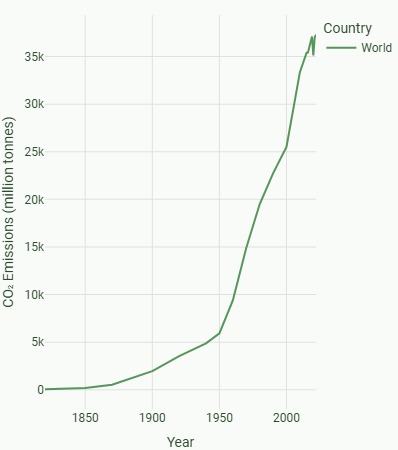
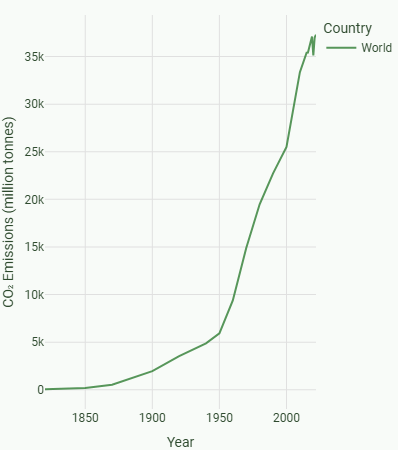
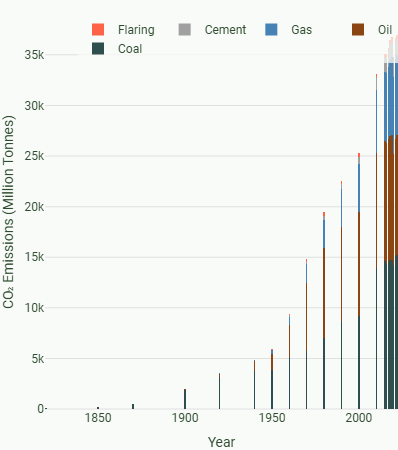
CO₂ Emissions Trends Over Time
-

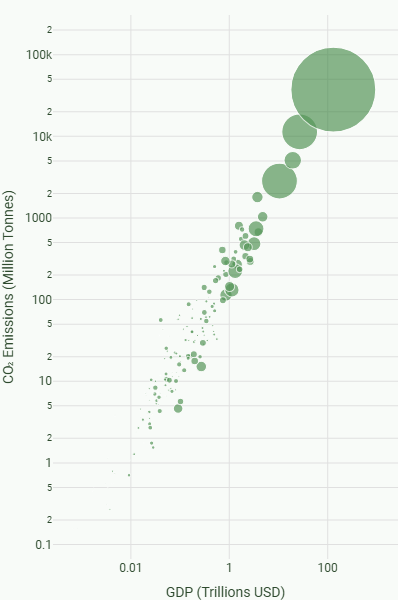
GDP vs CO₂ Emissions Relationship
-
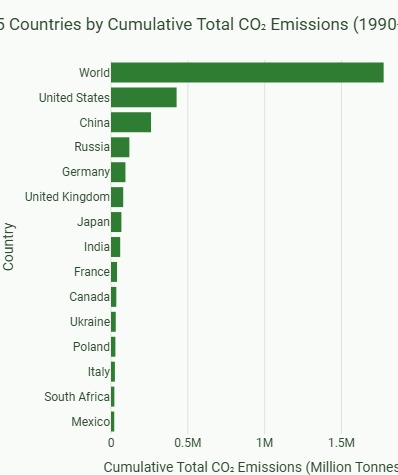
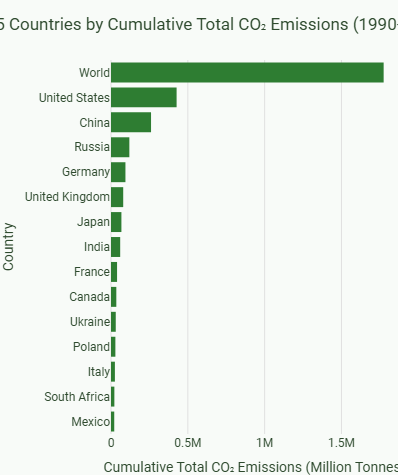
Cumulative Historical CO₂ Emissions by Country
-
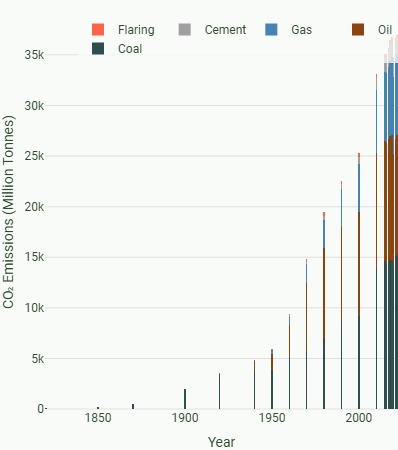
CO₂ Emission Sources Breakdown
Inspiration
The rising concerns around climate change and urban air pollution inspired us to act. We realized that while global reports highlight the dangers, most people lack local, real-time data that directly affects their health and daily decisions. We wanted to create a tool that makes invisible threats — like CO₂ levels and particulate matter — visible, understandable, and actionable.
What it does
Climate & Air Quality Monitor tracks and visualizes live environmental data such as temperature, humidity, CO₂, PM2.5, and VOC levels. It aggregates readings from IoT sensors and open data APIs into a single dashboard, providing users with insights and recommendations. The platform not only shows current conditions but also highlights trends and offers alerts when air quality reaches unhealthy thresholds.
How we built it
We combined Raspberry Pi and Arduino-based sensors with data from OpenWeatherMap and AirVisual APIs. The backend was built with Python (Flask/FastAPI) to process and normalize data, while the frontend uses React and D3.js for dynamic visualization. Machine learning models (scikit-learn/TensorFlow Lite) were integrated to forecast air quality trends. Everything runs on Dockerized containers, deployed to the cloud for scalability.
Challenges we ran into
Calibrating sensor data to ensure accuracy across different devices.
Integrating multiple APIs with different formats and update frequencies.
Maintaining real-time responsiveness while processing large datasets.
Designing a user interface that is both visually appealing and easy to understand.
Accomplishments that we're proud of
Successfully built a working prototype that combines IoT, APIs, and AI in one platform.
Achieved near real-time monitoring with accurate data visualization.
Designed a user-friendly dashboard that makes complex climate and air quality data accessible to everyone.
Validated the project’s usefulness through positive feedback from early testers.
What we learned
We learned the importance of data calibration and validation when working with sensors. We also gained experience in API orchestration, real-time data pipelines, and visualization techniques. Perhaps most importantly, we learned how impactful it is to transform technical data into actionable insights for everyday users.
What's next for Climate & Air Quality Monitor
Our next steps include:
Expanding to mobile platforms for wider accessibility.
Adding predictive analytics to forecast upcoming poor air quality days.
Integrating with wearables and smart home devices for personalized alerts.
Partnering with schools, healthcare providers, and city planners to use the data for policy and community health improvements.
Built With
- plotly
- plotlystudio

Log in or sign up for Devpost to join the conversation.