-
-
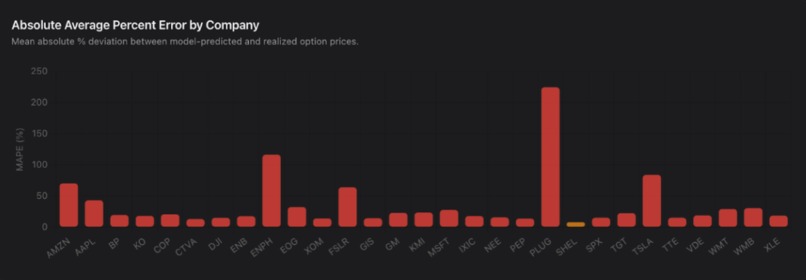
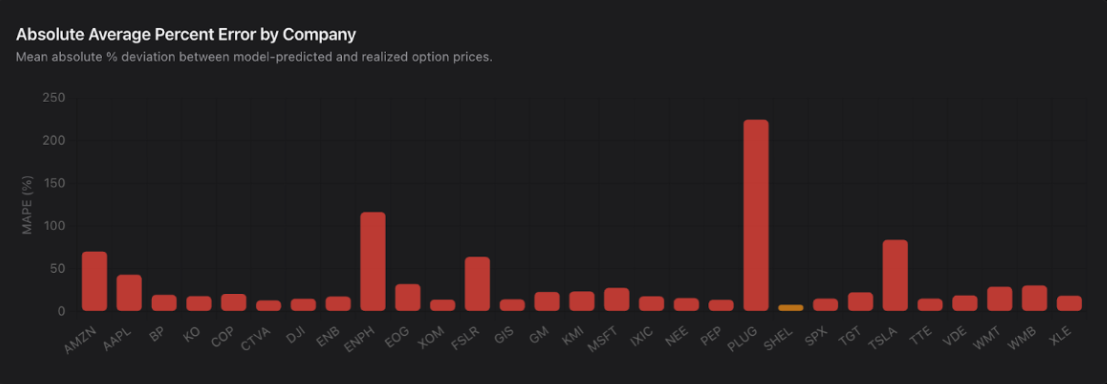
Average Percent Difference in Mature Stock Price and Initial Option and Strike Price By Company
-
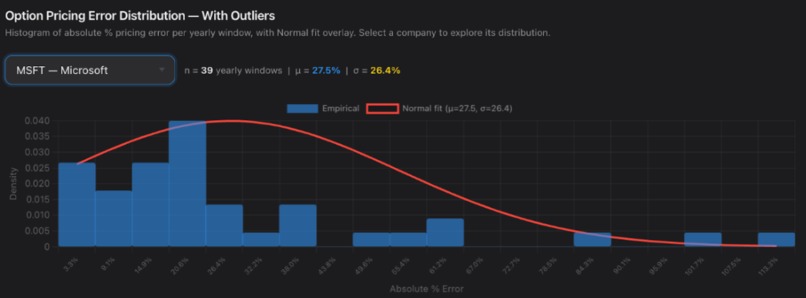
Normal Distribution of Average Percent Difference in Mature Stock Price and Initial Option and Strike Price By Company, With Outliers
-
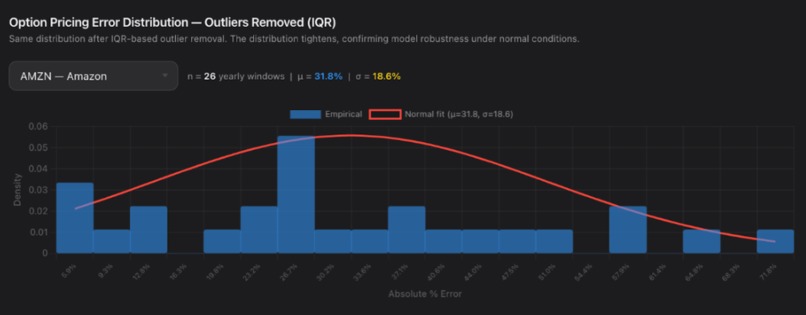
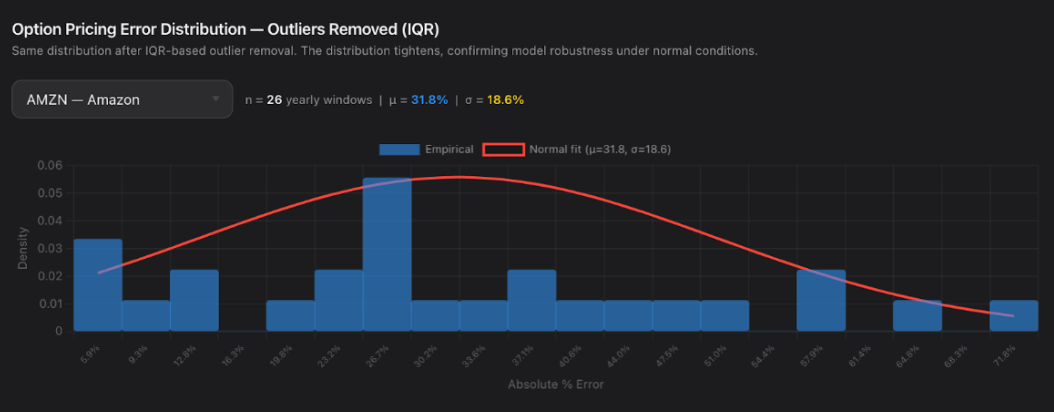
Normal Distribution of Average Percent Difference in Mature Stock Price and Initial Option and Strike Price By Company, Without Outliers
-
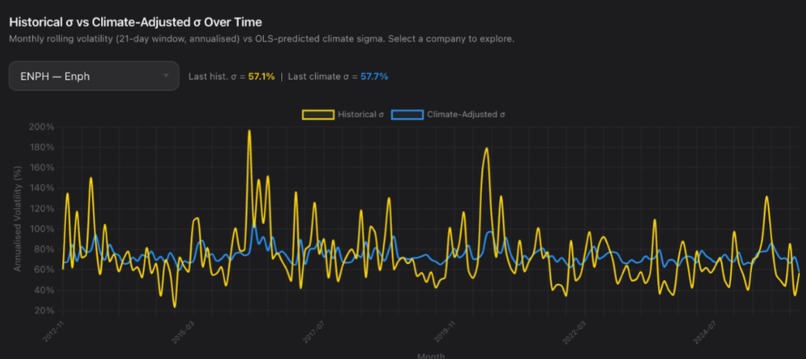
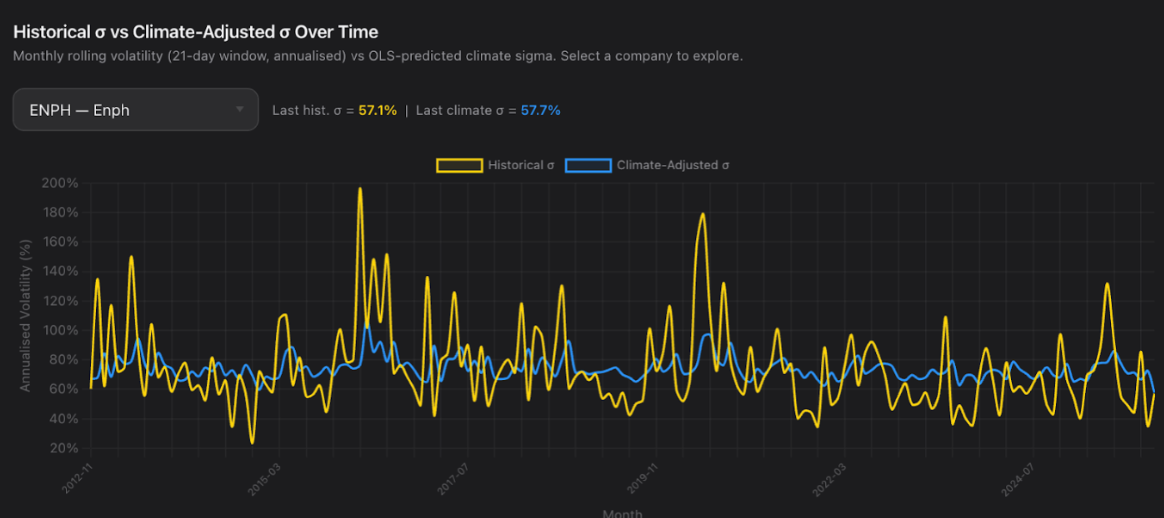
Volatility Time Series With and Without Climate Data
-
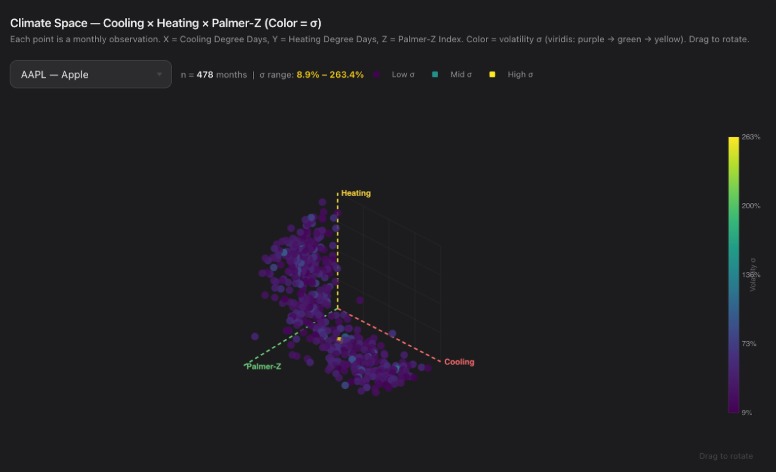
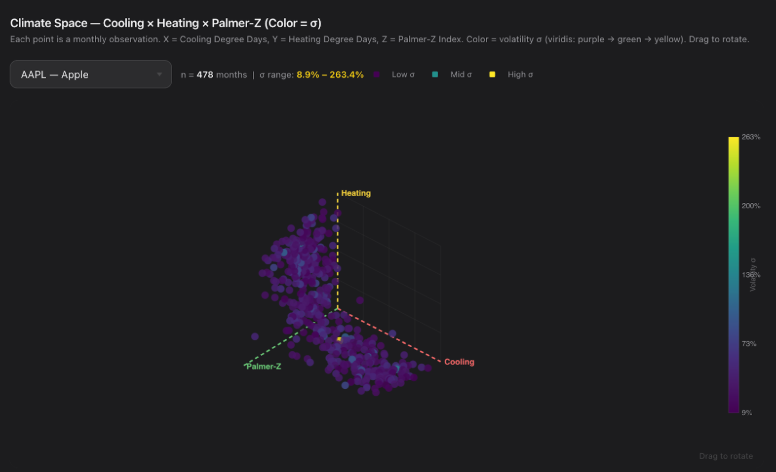
Volatility as a Function of Heating/Cooling Degree Days and Palmer Z Drought Index

Inspiration
Imagine you’re a stock market trader hoping to make significant money. What if you could buy a stock for a lower amount of money than its cost but still keep all the money it’s worth? Stock options allow you to do just that! The goal of this project is to create an innovative way of interacting with the financial world. We do this through a creative solution that integrates climate data into stock option trading strategies within a website anyone can use as a tool. By uniting climate data with financial data, we seek to break the barriers separating natural variability from economical variability. After all, as digital technology and AI further entrench data from human systems, it is imperative we always account for the natural systems upon which these human systems rely.
What it does
Key features of our application include an executive dashboard summarizing and comparing climate- and nonclimate-based volatility and option pricing across all companies, a calculator for option prices under scenarios of varying risk-free rates, maturation periods, and strike prices, and a research section depicting all of our data visualizations. All these features are designed to equip users with unique knowledge to make more informed trading decisions.
How we built it
To begin describing our development process, imagine yourself as a stock trader looking for the best stock option deals. Let’s say today, 22 February 2026, you want to buy a share from Willy Wonka Candy Company worth $100. But buying a stock is risky: for instance, what if the stock price never increases above the price you bought it for? So, you negotiate with Willy Wonka to buy the stock for a certain price (a.k.a., a **strike price, K**) in 1 year’s time (a.k.a, a **maturation period, T**). But wait! What if in 1 year’s time the stock price climbs to $200? Then Wonka would be losing out on an extra $100! So, using the **Black-Scholes equation**, he decides on an upfront price for you to pay called an **option price (C)**, calculated as:
$C = S_0 N(d_1) - K e^{-rT} N(d_2)$
$d_1 = \frac{\ln\left(\frac{S_0}{K}\right) + \left(r + \frac{1}{2}\sigma^2\right)T}{\sigma \sqrt{T}}$
$d_2 = d_1 - \sigma \sqrt{T}$ σ is volatility, that is, the standard deviation of (logarithmitized) returns; r is expected yield under zero-risk conditions; d1 is the deviation of the current stock price from the strike price; d2 is the difference between the expected future (logarithmitized) price and strike price; N() takes the cumulative density function of d1 and d2 under the normal bell curve.
Challenges we ran into
We faced two overarching challenges throughout development: (1) successfully creating our back-end development and (2) connecting our back-end methods within Claude AI (Anthropic’s) front-end environment. For creating our backend, we used Python to create, sort, and manipulate Dataframes. In the process, we encountered various idiosyncrasies we were unaware of, leading to frequent tracebacks. For example, our climate and stock data had different datetime indices and time-ranges that had to be matched and merged. Additionally, when outputting preliminary graphs and statistics, we had to fix our indexing so the right results were displayed for the right company. For connecting our back- and front-end, we struggled with properly getting Claude AI to execute our requests. Namely, it failed to easily parse our backend logic, thereby necessitating numerous re-promptings and clarifications. Moreover, getting many of the visualizations to appear in our application, as sometimes the API couldn’t fetch the necessary information.
Accomplishments that we're proud of
Being able to construct a working webpage that incorporates all of our figures and desired functionalities (calculation, visualization, and analysis) is a major source of joy for our team. As a group of first-time participants with mostly basic programming skills, we find it impressive that we were able to reason, implement, troubleshoot, and apply our own backend (not to mention within about thirty-six hours!). Moreover, being able to persevere and think critically about bugs and in turn, obtain a fairly involved minimum viable product, has been an extremely satisfying process for our team!
What we learned
We learned how to utilize basic Git (using git pull, fetch, push, commit, add, etc.), as well as the functionalities of Github and its associated capacity of maintaining repositories.
What's next for ClimaQuant
Presently, although all files are compiling and following intended logic, when attempting to make our website public, there have been issues with properly connecting to the necessary servers and in turn displaying the correct information on our public-website. In other words, due to server issues, we couldn’t get our website to host publicly, something we hope to change for the future! Additionally, we hope to use our data to perform deeper econometric experiments on various stock options and climate scenarios as well as assessing possible ramifications. How will new, extreme weather patterns influence market volatility, and how will that impact share option pricings? What if strike prices don’t match the stock price on that day? What if the maturation was 1 month instead? 15 years? We hope to keep prodding at this setup to explore how the stock market could shift under different scenarios and what that means long-term economically, and potentially, socially as well.
Built With
- anthropic
- css3
- html5
- javascript
- openai
- python

Log in or sign up for Devpost to join the conversation.