TL;DR: Europe imports about €126 billion a year of goods that must now prove they weren't grown on forest cleared after 2020. The law has been delayed twice, because the system to check it wasn't ready. OpenCanopy checks one plot in one click, with free satellite data. On our sample plot in Borneo it found 880 hectares of forest cleared in 2023.
Try it live: opencanopy.world If previous link does not work, use this alternate.
Inspiration
Every minute in 2024, the tropics lost about 18 soccer fields of primary rainforest. That is 6.7 million hectares in one year, a record and nearly double 2023 (WRI / Global Forest Watch). Since 1990, about 420 million hectares of forest have been converted to other uses, an area larger than the whole EU (FAO).
A lot of it ends up on our plates and shelves. The European Parliament ties EU consumption to about a tenth of global deforestation, and palm oil and soy make up over two thirds of that share. The chocolate, coffee, leather, tires and furniture we buy are often grown on land that was rainforest a few years ago.
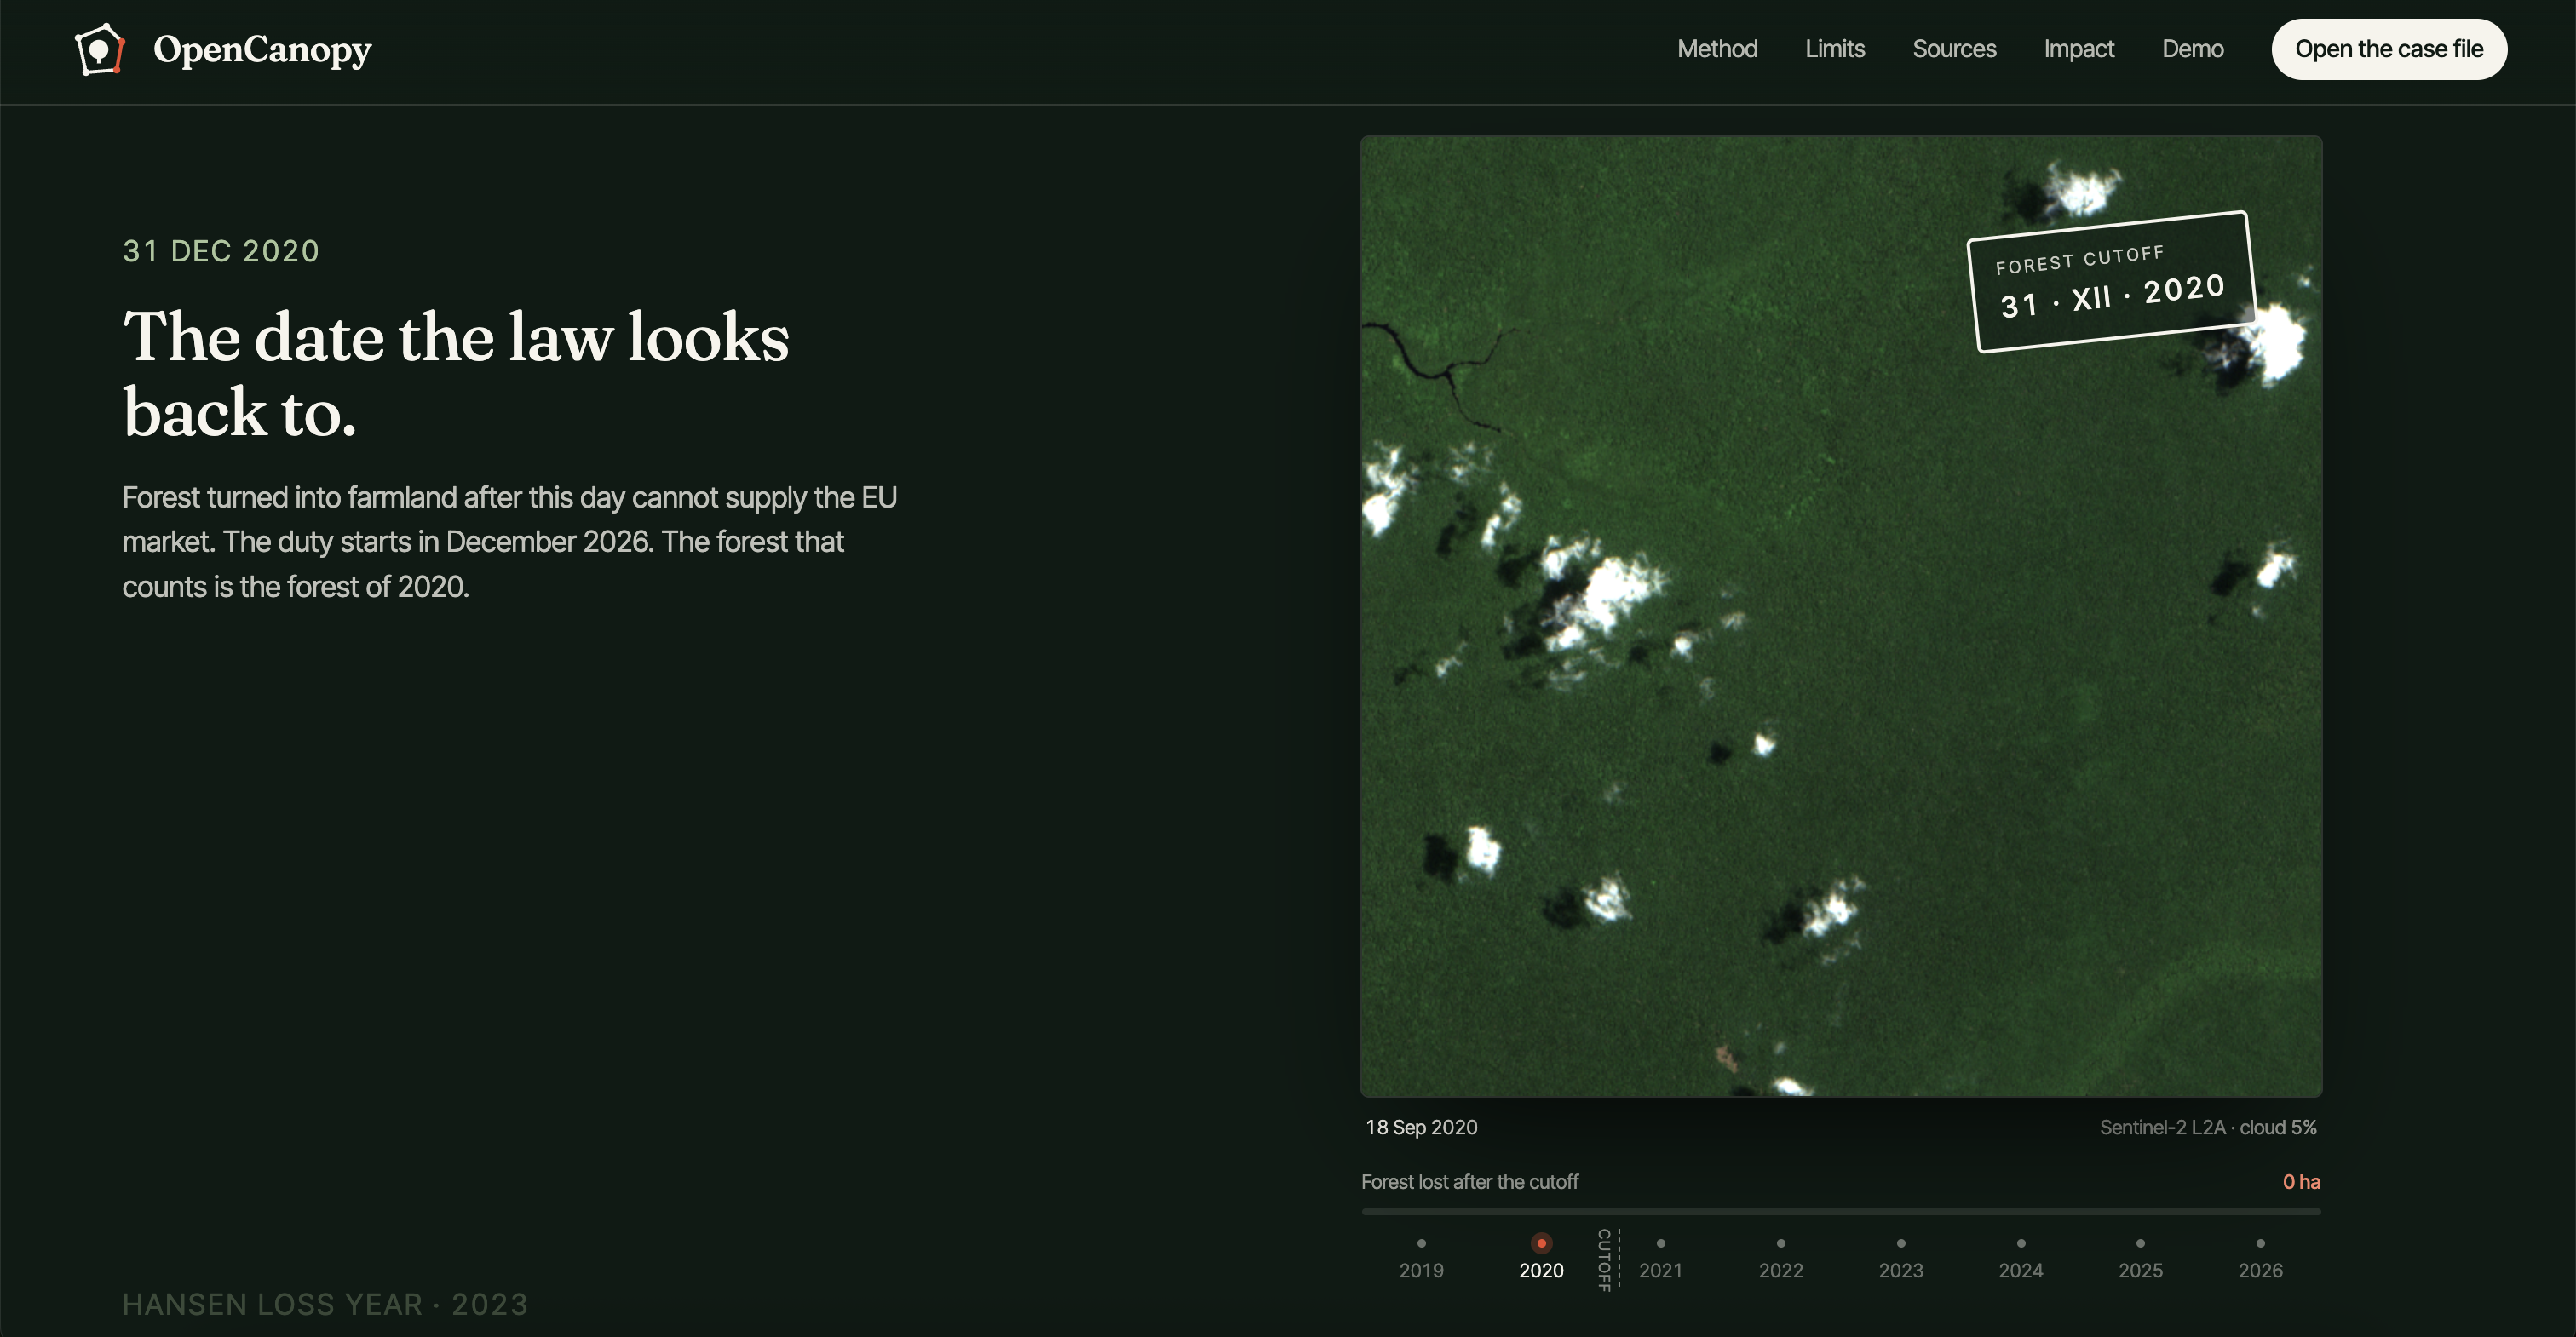
Europe wrote a law to stop it, and then couldn't enforce it. The EU Deforestation Regulation says that from 30 December 2026, cocoa, coffee, palm oil, soy, rubber, cattle and wood can't enter the EU market if they come from land deforested after 31 December 2020. That covers about €126 billion of imports a year (S&P Global). Every shipment must name the plot it came from.
Naming the plot is easy. Checking it is the hard part. The rule was meant to start in December 2024. It was pushed back a year, and then pushed back again in December 2025, with the Commission pointing to systems that weren't ready to handle the checks. The European Commission's own estimate of compliance costs was €8.1 billion a year, cut to about €2 billion only by simplifying the rules and exempting more countries and small operators. That money pays for paperwork. It doesn't let a reviewer see the land.
Today, to check one polygon by hand, a reviewer needs a 2020 forest map, a loss map for every year since, and a clear satellite picture for each year, all lined up on the same box. So approval leans on the applicant's own description of the land. That is exactly the gap a bad actor walks through.
The people who know the truth are the ones who live next to that forest. They watched it get cleared, but the maps that could prove it are written for GIS experts. We built the check a reviewer and a village can both read, in one click, from open data that costs nothing.
What it does
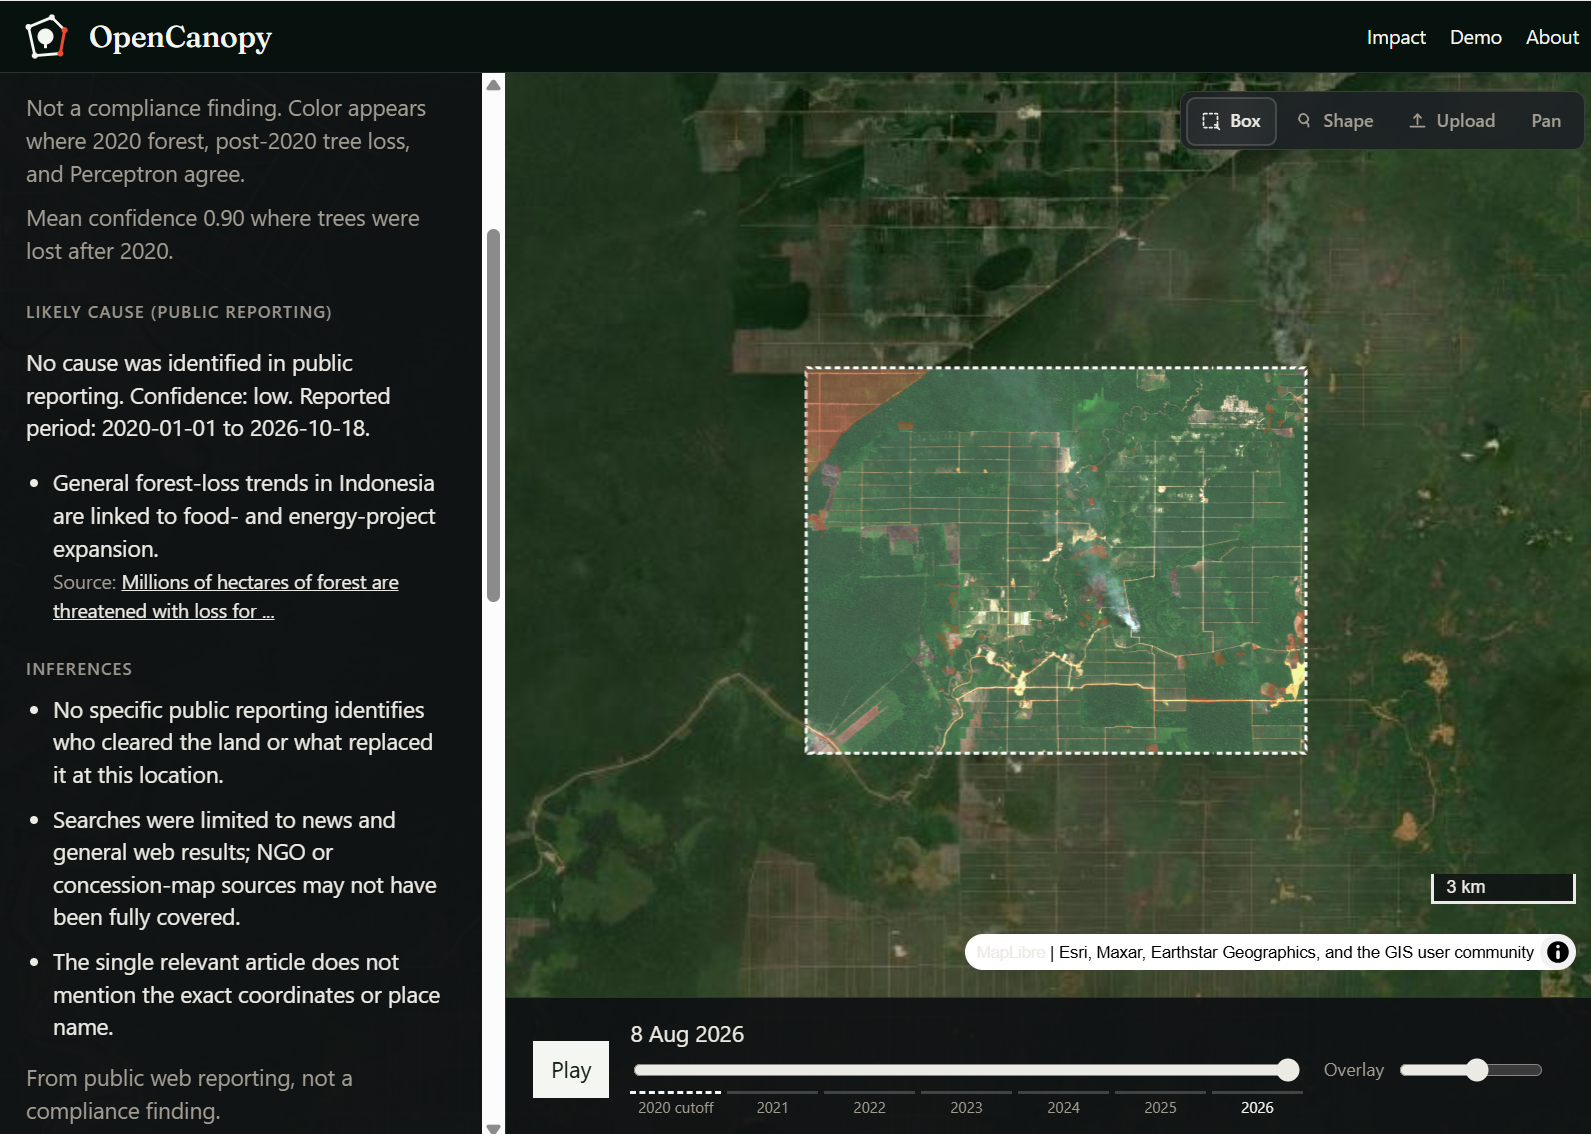
Give OpenCanopy one plot: draw a box, sketch a shape, or upload GeoJSON / KML / GPX. It builds the satellite record for that ground back to the cutoff:
- Two pictures. The clearest Sentinel-2 scene before the cutoff and the clearest one now, plus every year in between to scrub or play.
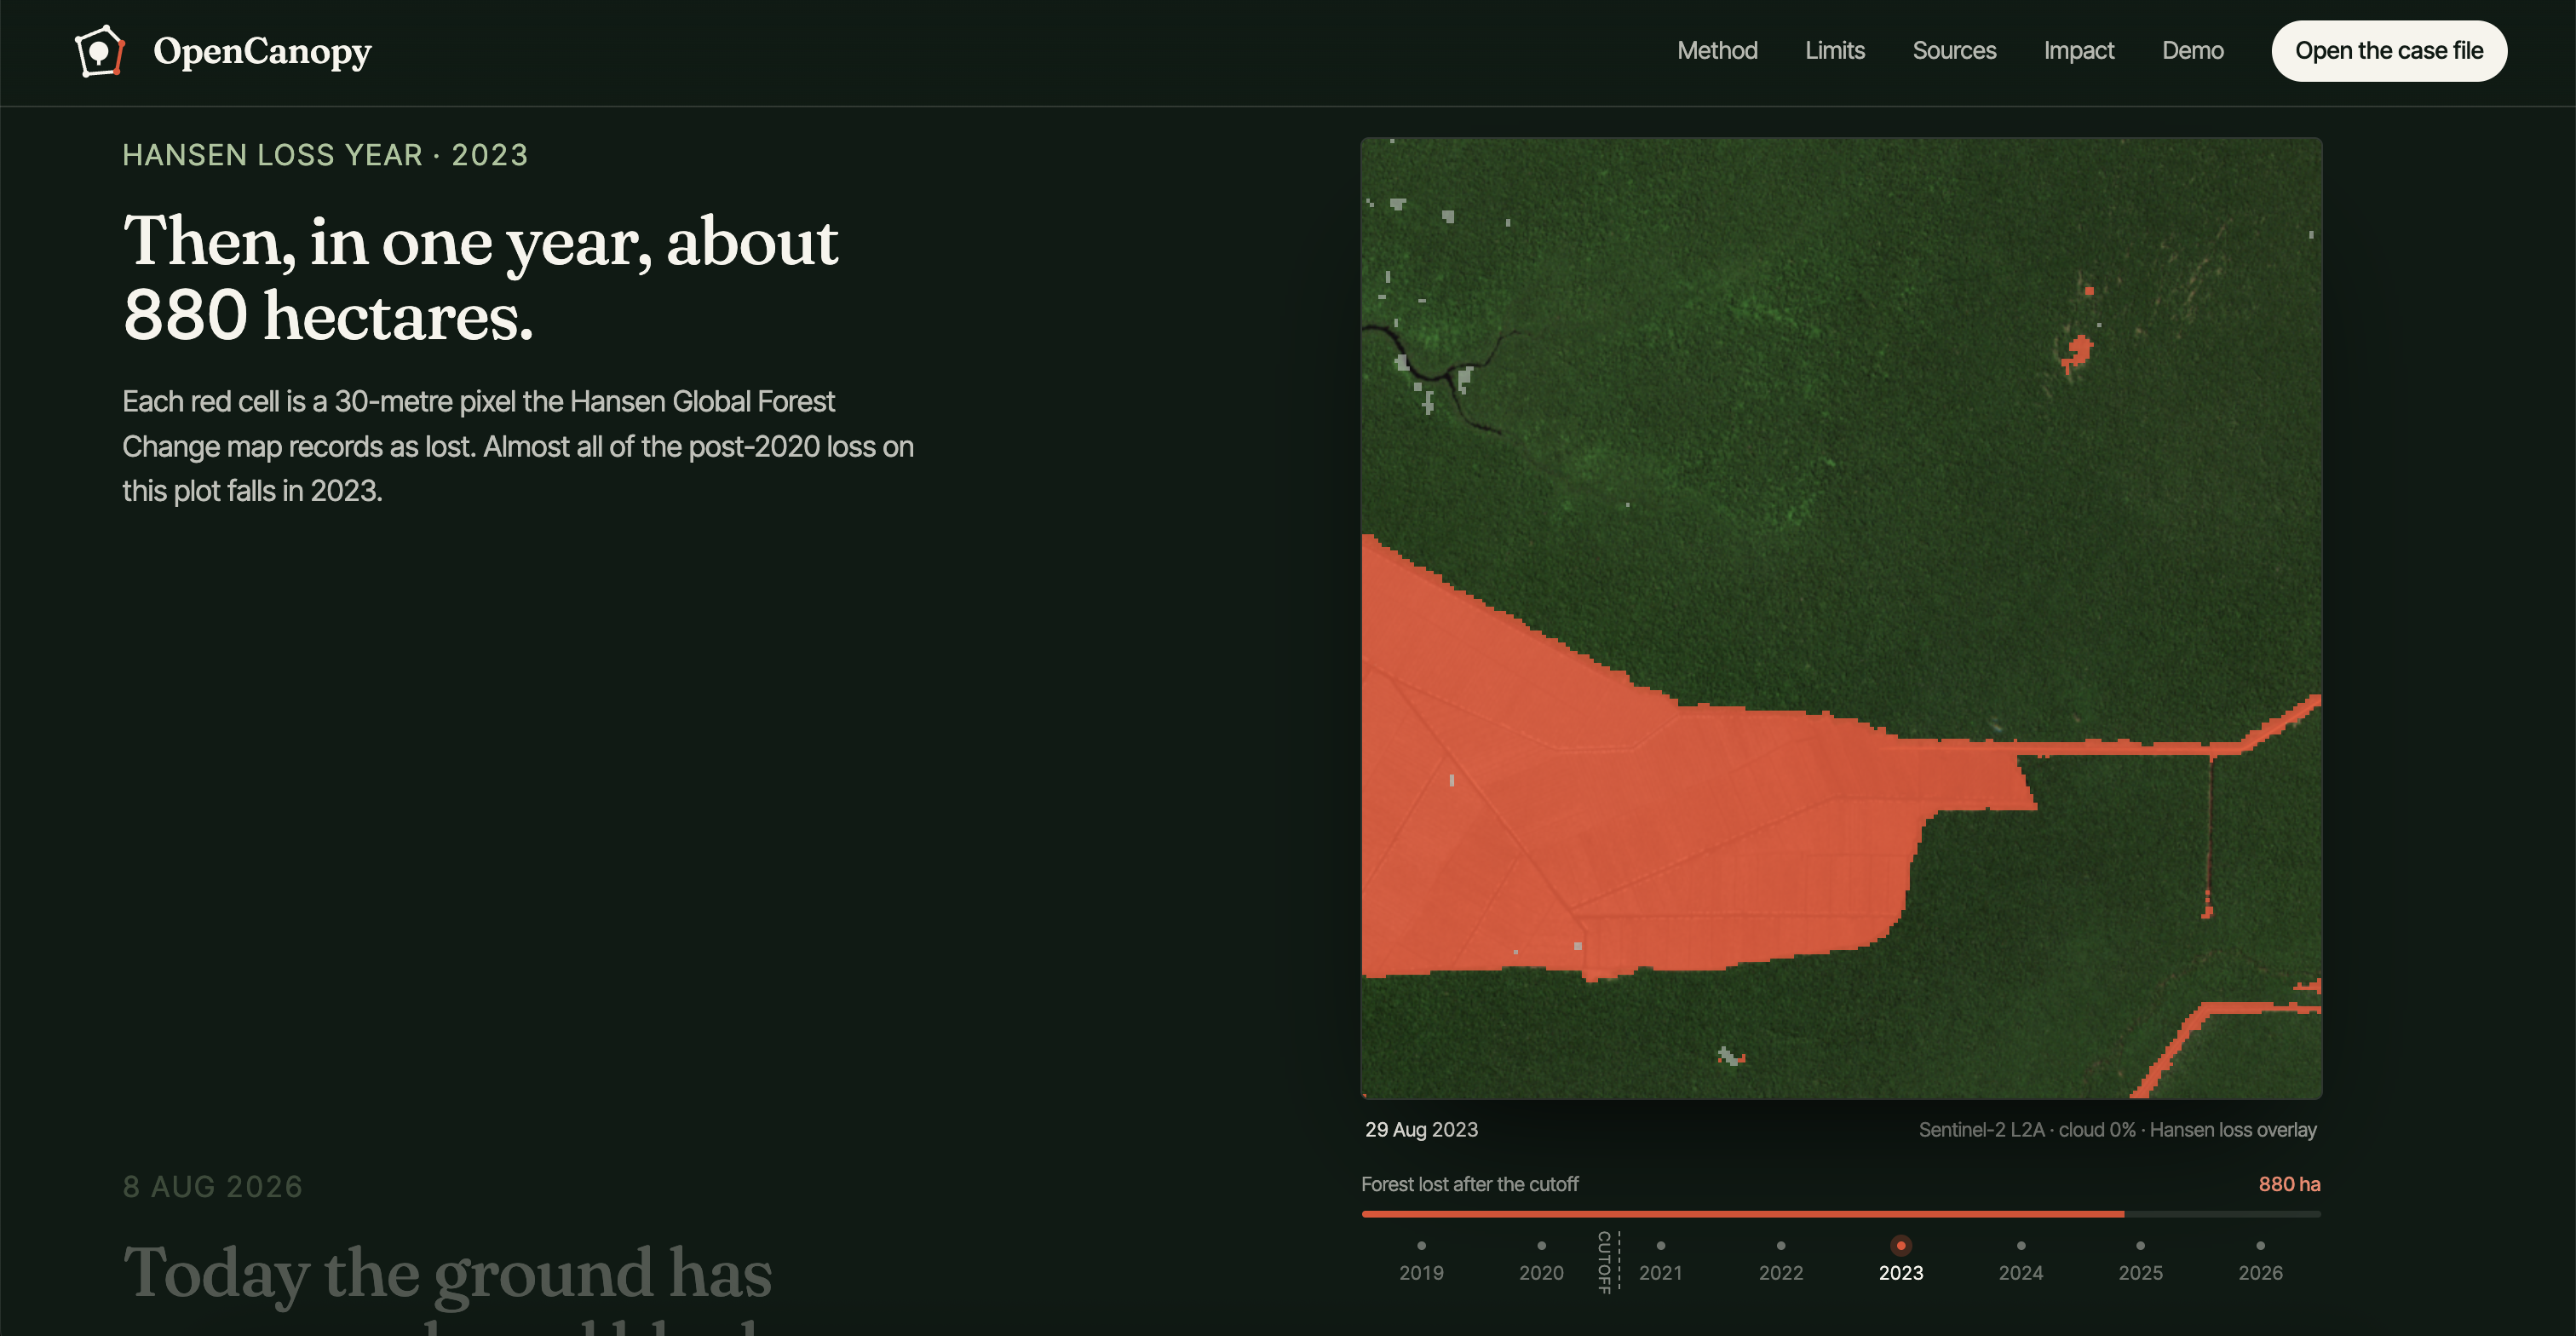
- The loss year. Hansen Global Forest Change marks the year each 30 m pixel lost its trees, through 2024. The JRC 2020 forest map marks what was forest at the cutoff.
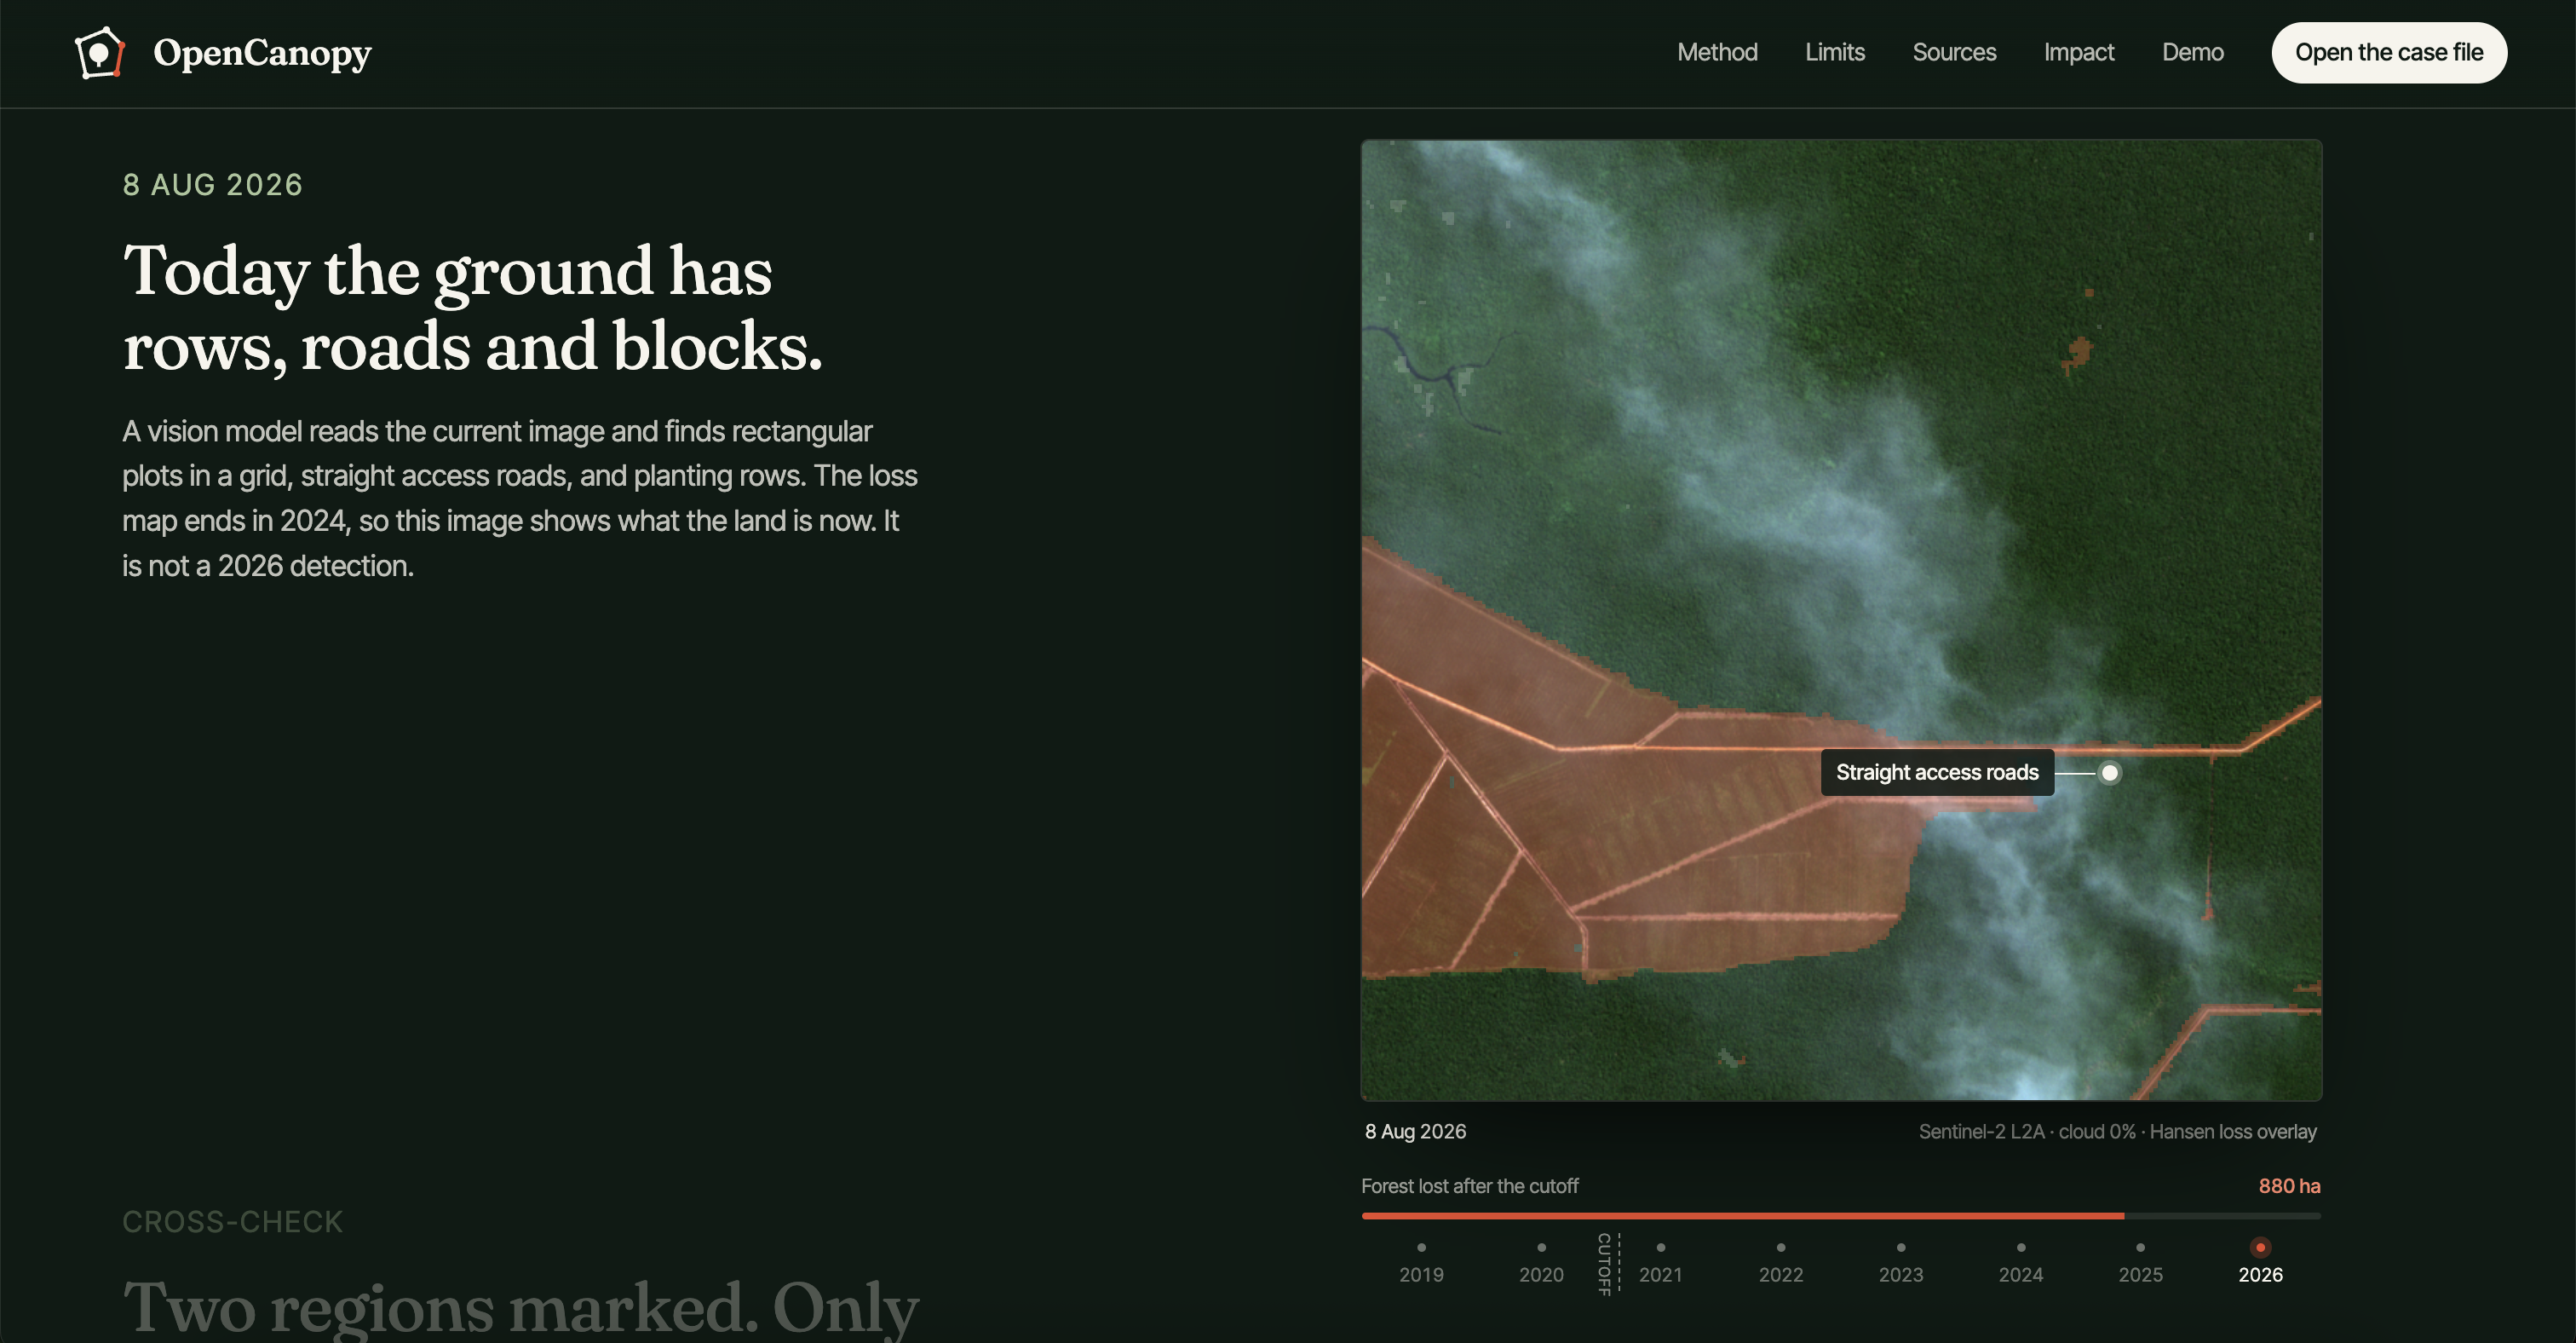
- What it became. Perceptron's vision model reads the current image and outlines regions that look converted: blocks, straight roads, planting rows.
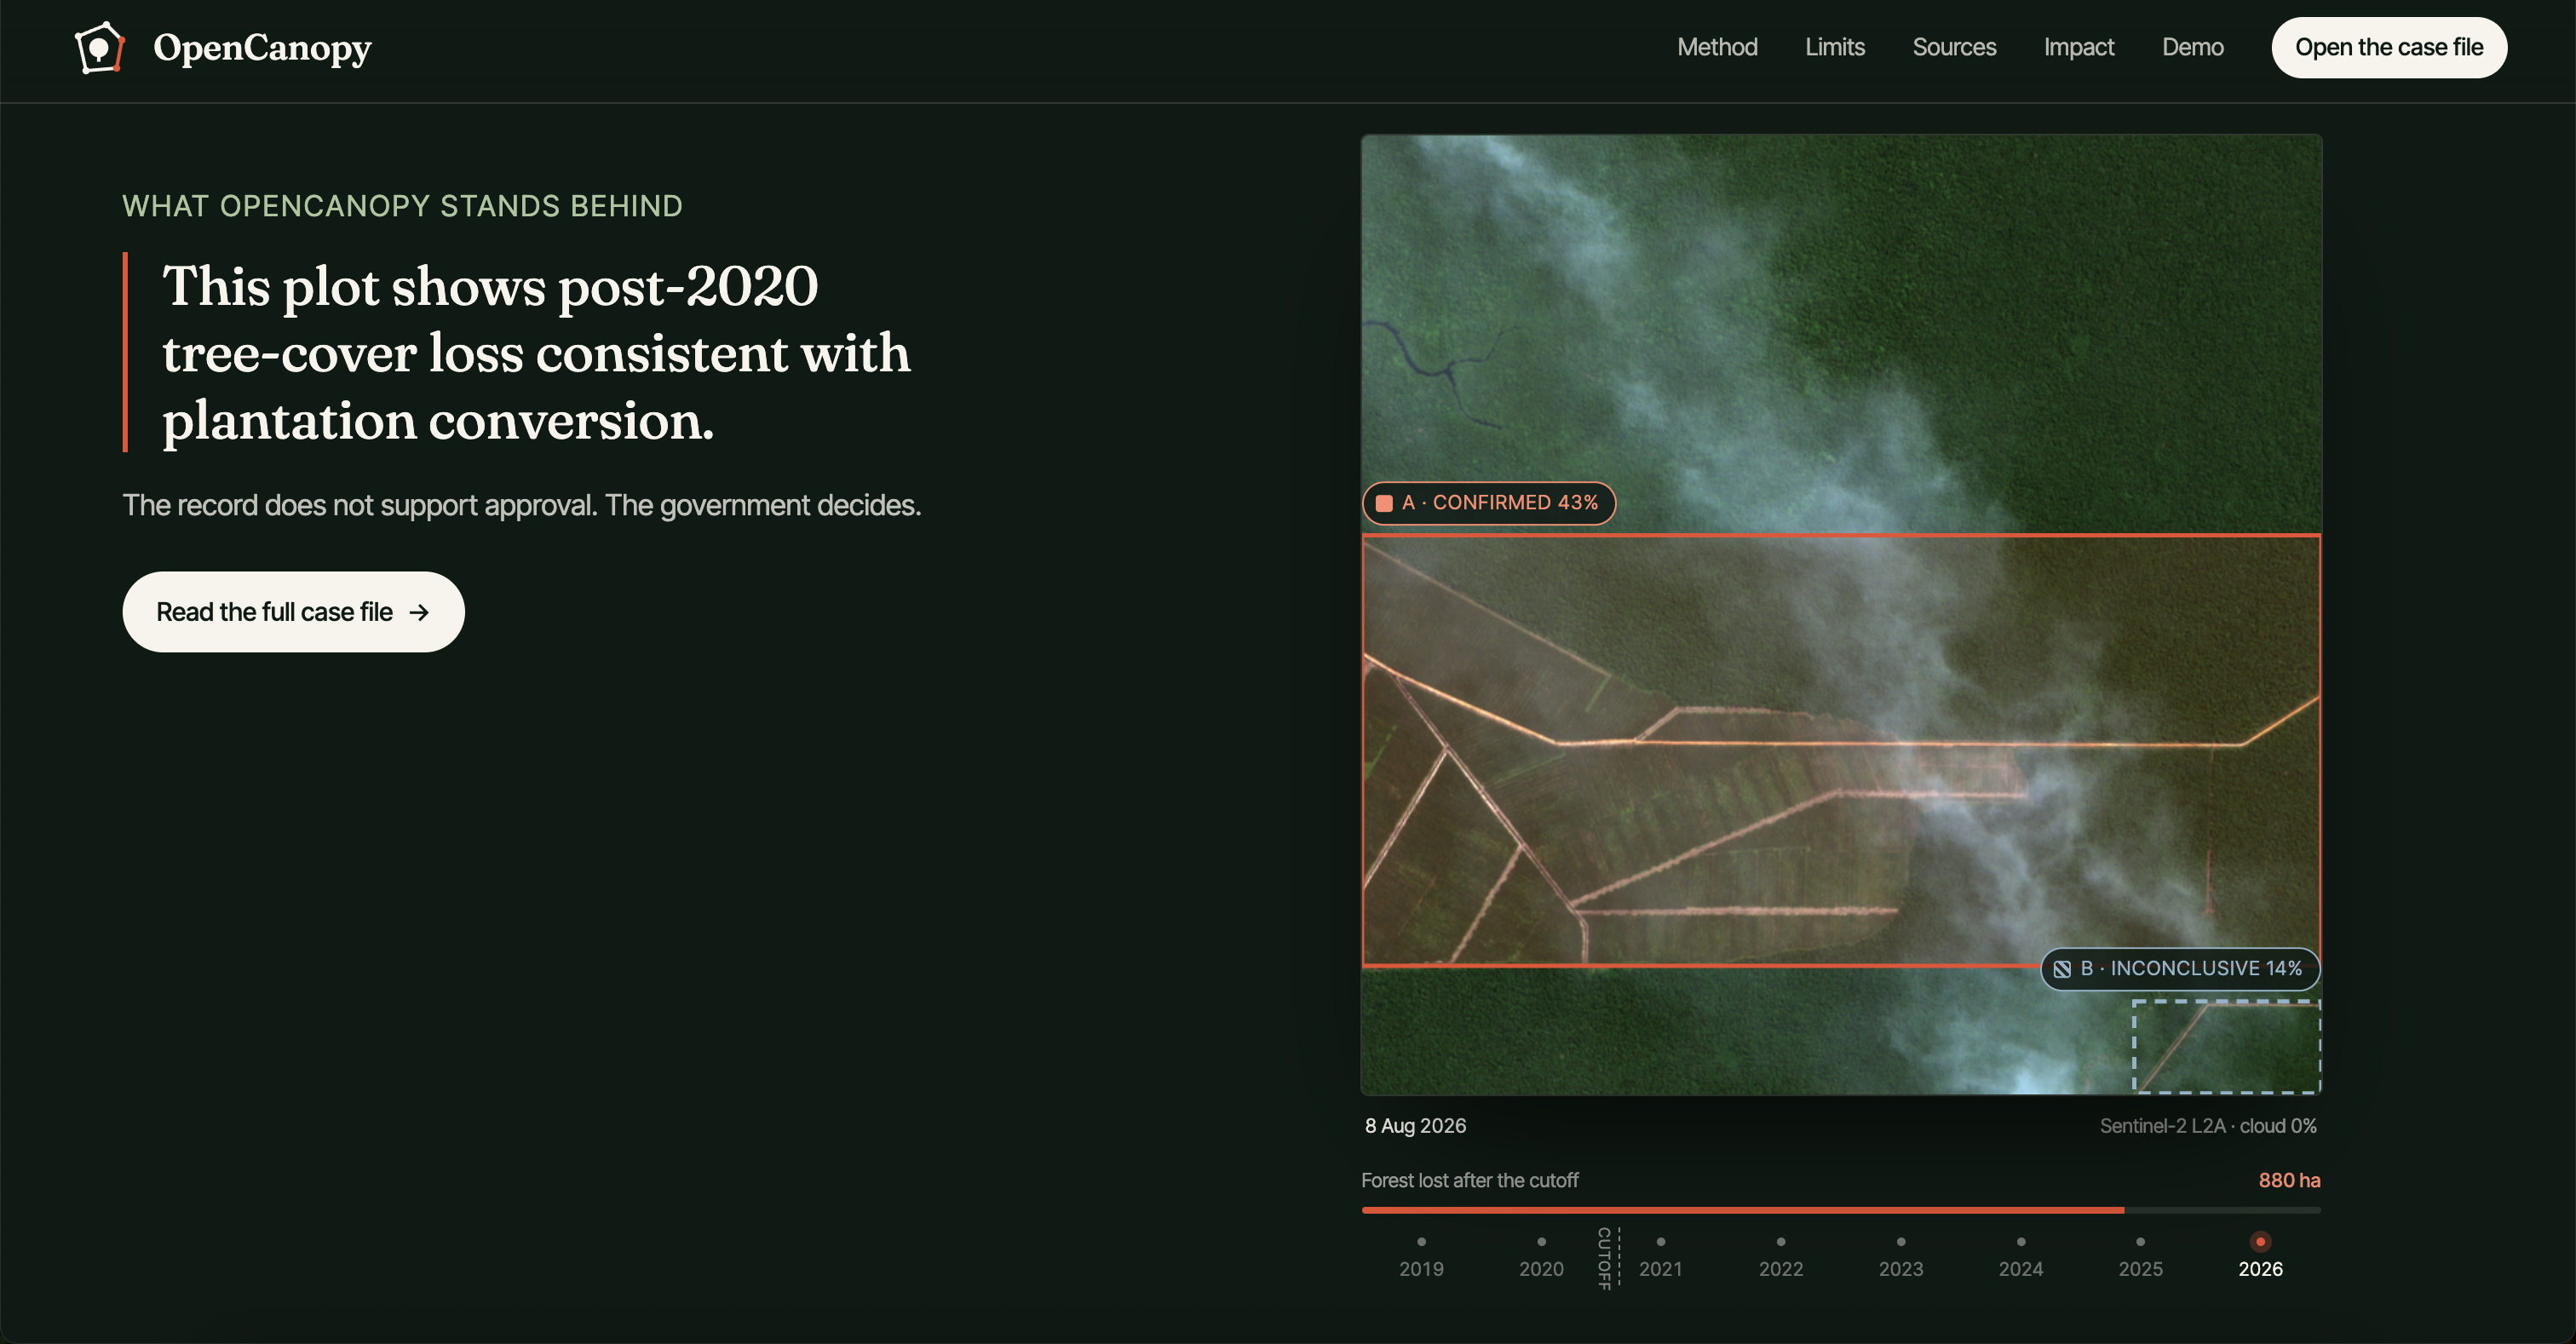
- The cross-check. A region is confirmed only if at least 25% of it shows post-2020 loss. Anything else stays inconclusive and goes to a person. We show the inconclusive region on purpose.
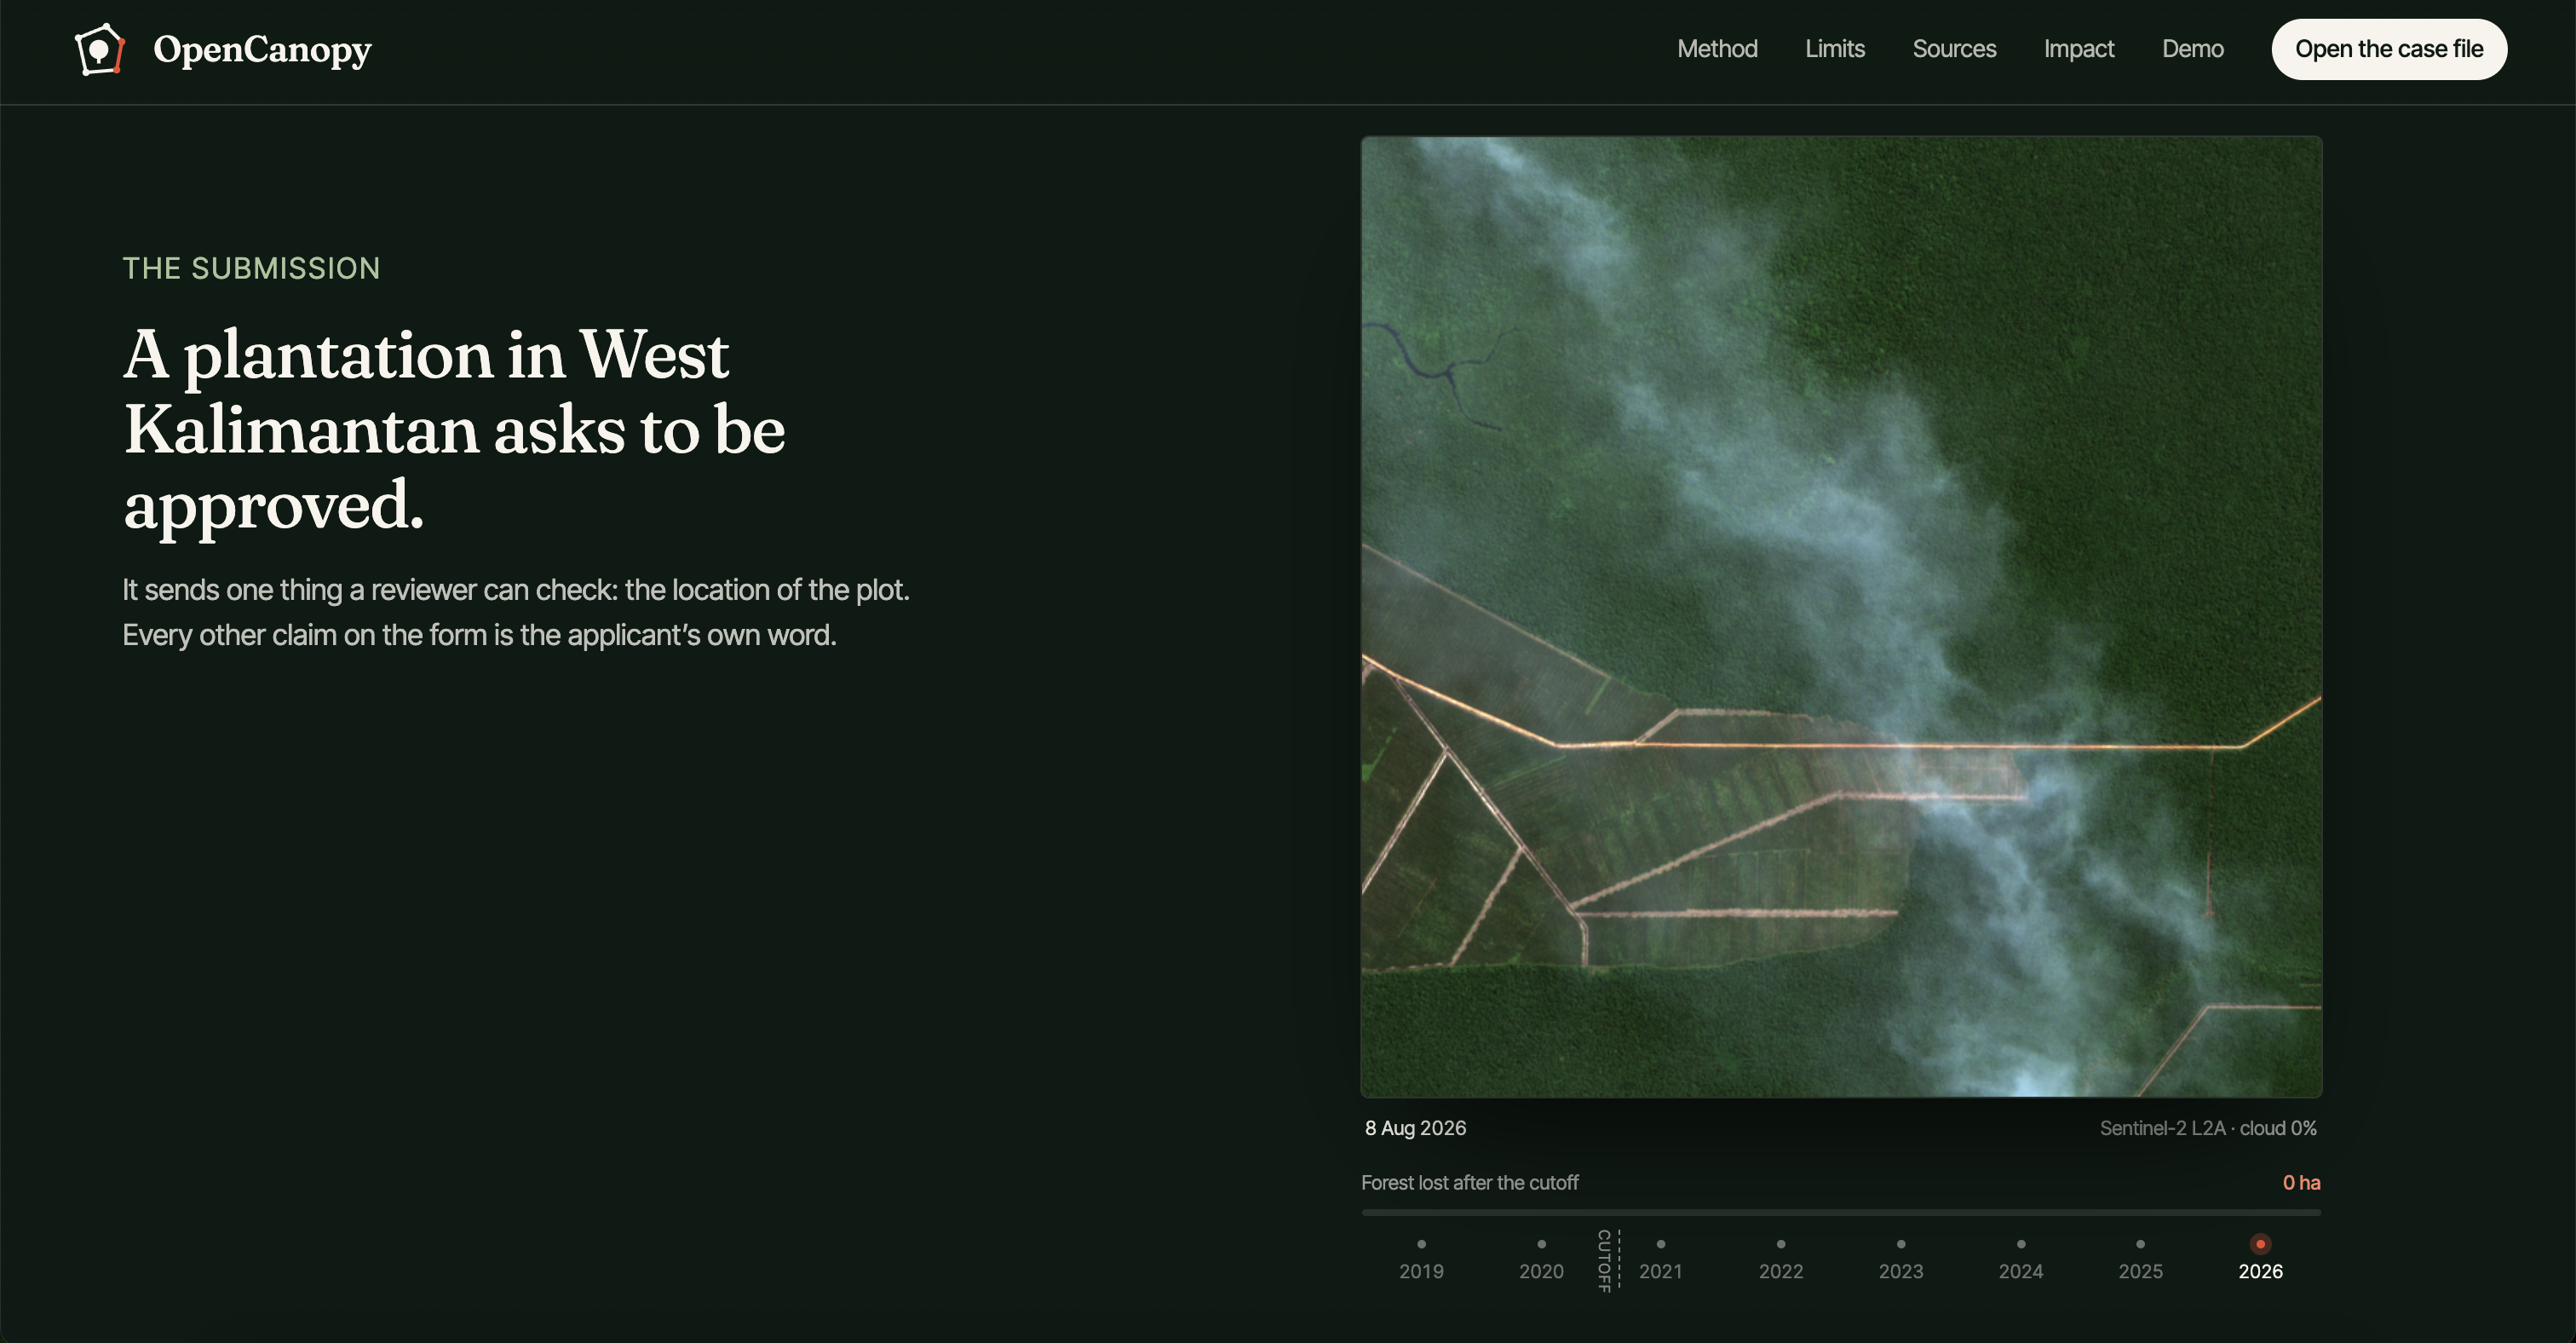
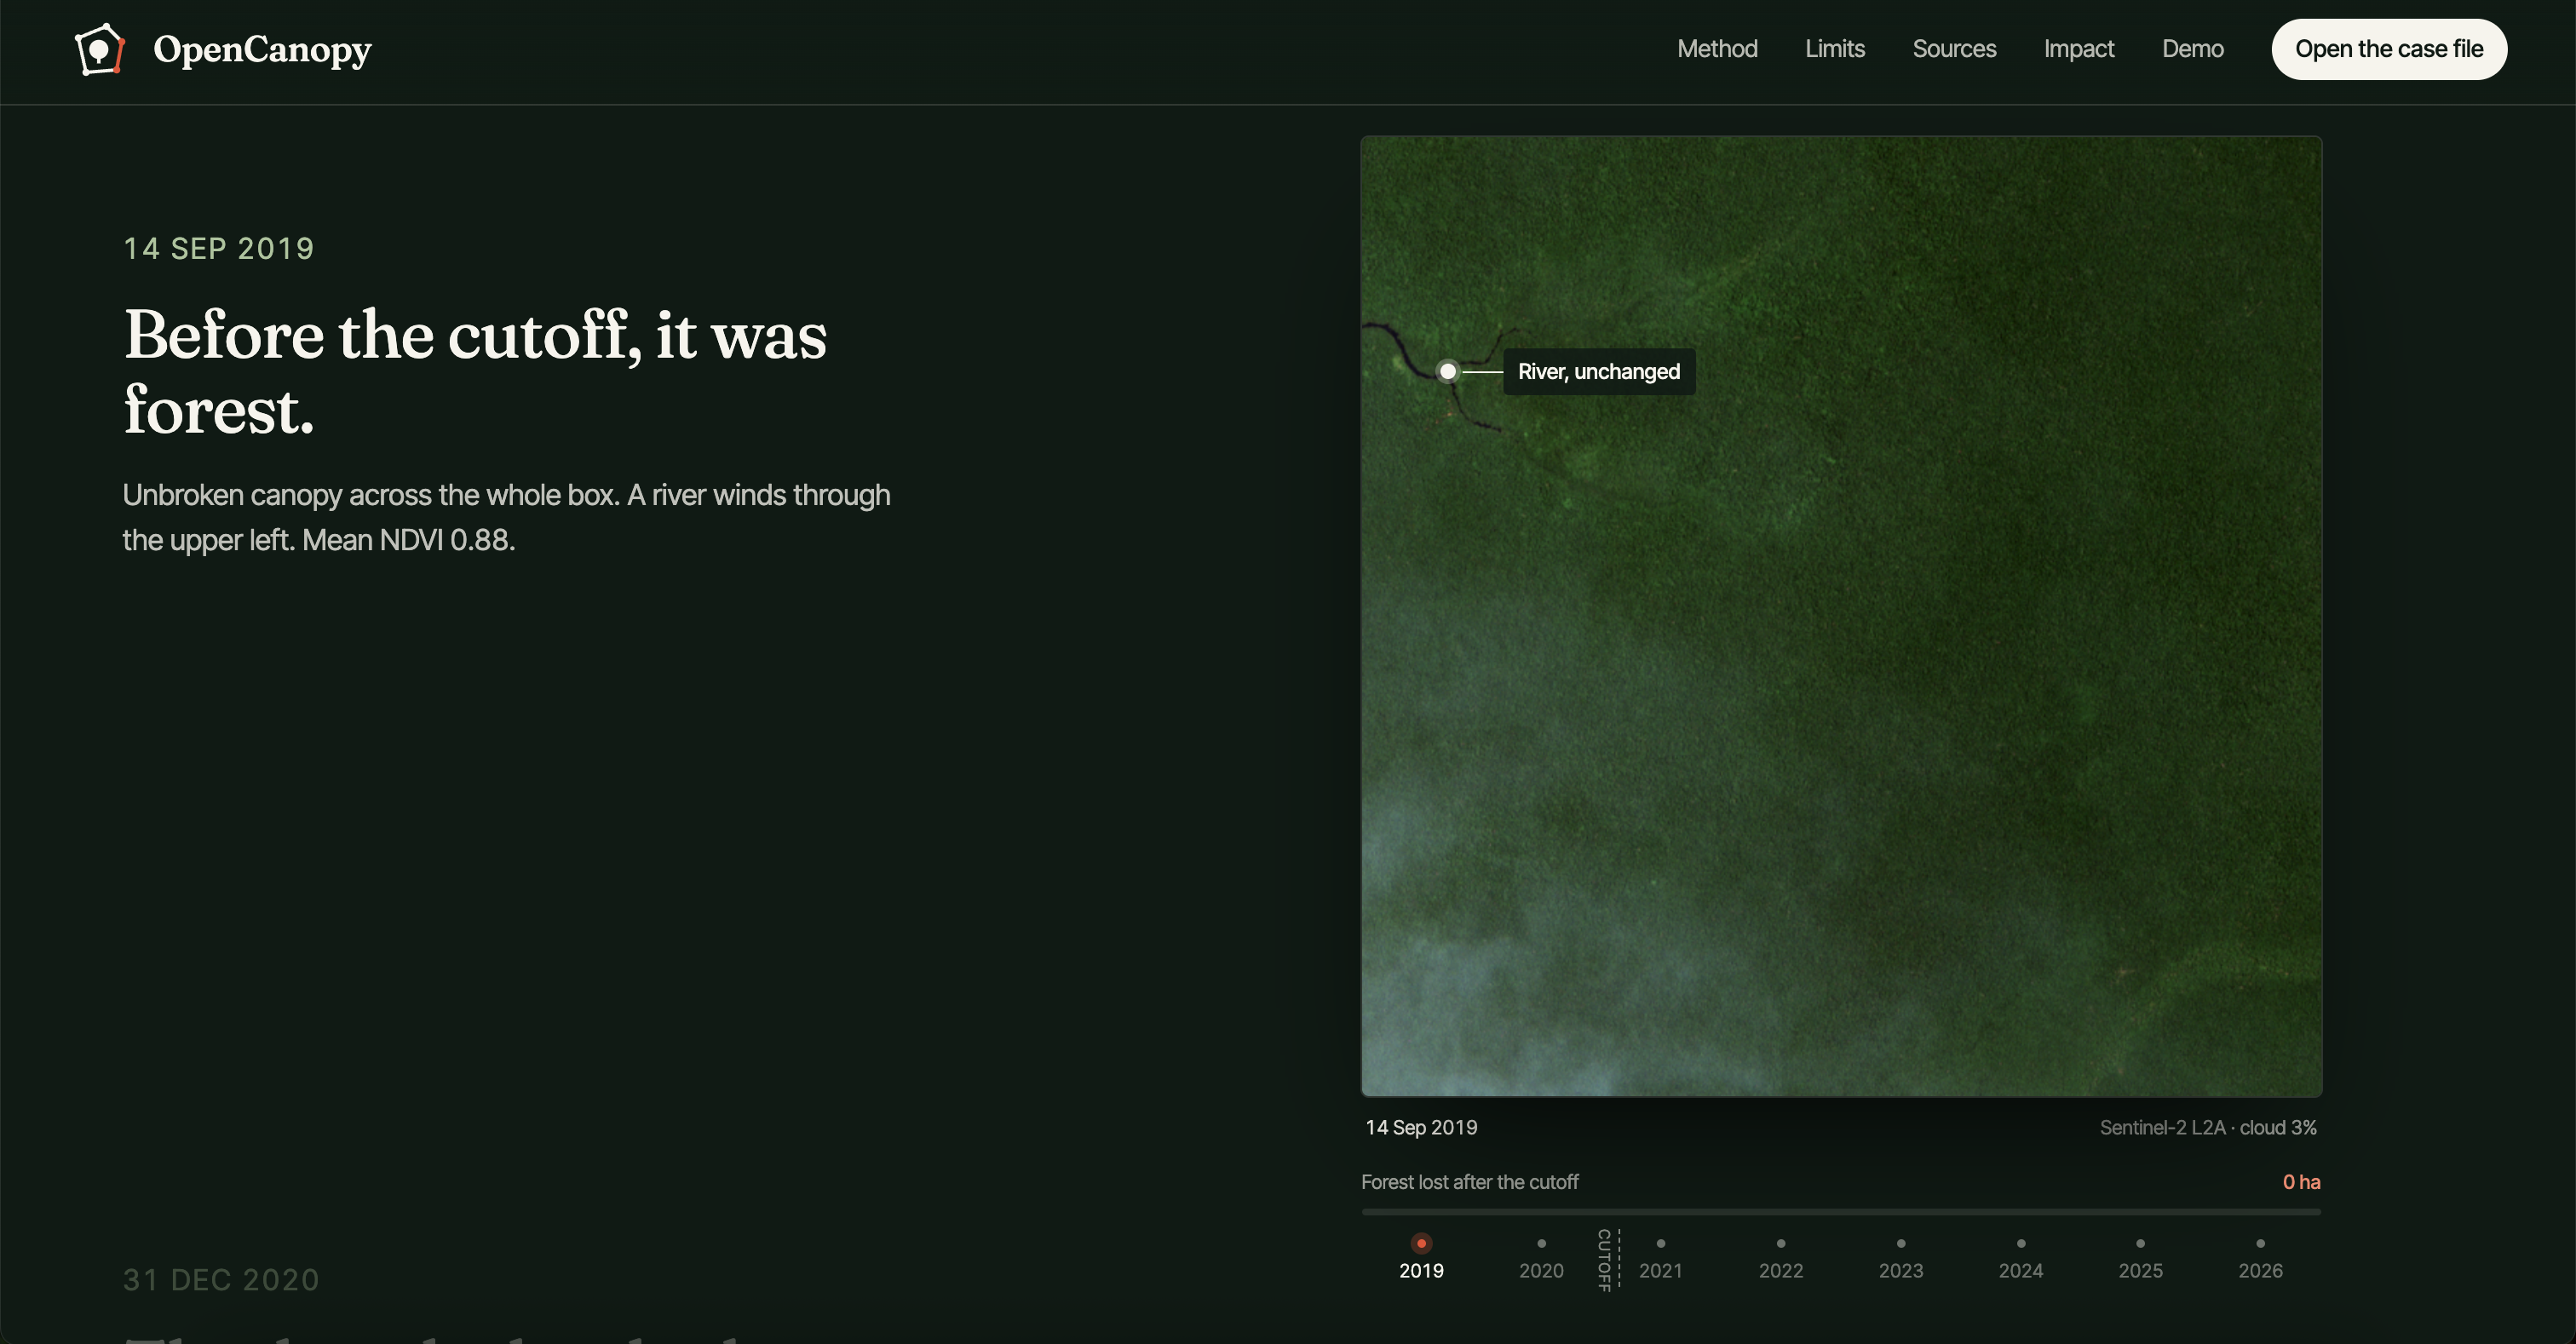
On our sample plot in West Kalimantan, Borneo, the record shows unbroken forest in 2019. About 880 ha (20% of the plot) was lost after the cutoff, almost all of it in 2023, and the land now shows plantation rows. The vision model marked two regions. One is confirmed (43% loss). The other is inconclusive (14% loss).
Why that matters: a reviewer sees the answer in one screen, without a GIS team, and the inconclusive region keeps a person in the loop instead of letting a model decide. The only sentence OpenCanopy will say is: "This plot shows post-2020 tree-cover loss consistent with plantation conversion." It never says "illegal" or "non-compliant". The government decides. Every check includes its scene IDs, dates and cloud cover, so anyone can pull the same data and see the same thing. The result is a printable case file with numbered exhibits.
How we built it
Every byte of evidence comes from space. Sentinel-2 photographs the plot from orbit every five days at 10 m. The Hansen loss map is built from 20+ years of Landsat satellite imagery. OpenCanopy turns that space data into one answer on the ground.
- Imagery: Copernicus Sentinel-2 L2A from Microsoft Planetary Computer (
pystac-client,planetary-computer). For each year we pick the least cloudy scene in the same season. - Loss and forest layers: Hansen GFC-2024-v1.12 loss-year and JRC Global Forest Cover 2020 v4 rasters, clipped to the plot with
rasterioandshapely. - Vision: Perceptron Mk1.5 is the engine. Every judgment about what the land became comes from Perceptron. It reads before/after Sentinel-2 pairs, it watches a year-by-year video of the plot (one frame per year since 2020, at 2 fps), and it draws boxes around converted areas on a 0–1000 grid. That is how a pile of red loss pixels becomes "this region is now a plantation". See Why Perceptron below.
- Global search: we didn't stop at one plot. We indexed every 10° Hansen/JRC tile on Earth for 2020 forest that later lost trees, polygonized each clearing over 10 ha, cut a 2.56 km Sentinel-2 chip around each one, and asked Perceptron one question per chip as Slurm array jobs on UW's Hyak cluster. Perceptron flagged 69 clearings as plantation, and we pulled before/after imagery for every one.
- Cross-check:
numpycompares each model region against the post-2020 loss pixels and applies the 25% rule. - Built in Cursor: we wrote the pipeline, server and site in Cursor.
- Web: a small Python server (
/api/analyze) and plain HTML/CSS/JS:- the demo map uses MapLibre GL over Esri imagery, with a year slider, playback and overlay opacity
- the landing page is a scroll-driven story
- the case file is a print-ready evidence dossier with a before/after slider, a flicker mode, and a loss-by-year chart with the cutoff marked.
Why Perceptron
Without Perceptron, OpenCanopy is just another loss map. The loss map says trees disappeared. It can't say what replaced them: fire, logging, a road, or an oil palm estate. That last step is the whole EUDR question, and Perceptron is what answers it.
- It works with no training data. There is no global labeled set of forest converted to plantation after 2020; that's the point of the law. A custom classifier would need thousands of labels we don't have. Perceptron worked out of the box, which is the only way this could be built in a weekend, or scaled to the whole planet.
- It understands time. We give it a before/after pair, or a video of the same ground year by year, and ask about the change, not a single frame. Most vision APIs take one image and describe it.
- It localizes. It returns boxes, so we can cross-check exactly the region it points at against the loss map, pixel by pixel. That turns a model opinion into evidence.
- It's cheap enough to point at the whole planet. Perceptron Mk1.5 costs $0.15 per million input tokens. Each question is one small Sentinel-2 chip and a one-word answer, so a single check costs well under a cent. That means the limit on a global sweep is how many clearings exist, not the budget: a hackathon team could afford to ask about every post-2020 clearing we indexed worldwide. For a regulator, that turns satellite review from a specialist service into something you can run on every plot.
- It's fast. One Perceptron call reads a whole 2020–2026 video of a 10 km tile and answers in about 4 to 8 seconds (6.8 s on average in our benchmark). We fire calls in parallel and only ask about windows where the maps already show loss, which skipped 12 of 25 windows on our test plot. One-word answers with reasoning off let us batch it across every clearing on the planet.
We tested it hard. On labeled Sentinel-2 chips from Riau, Sumatra, generic prompts ("are there planting rows?", "is this an estate?") scored 8 of 16, a coin flip. So we studied what oil palm looks like at 10 m and rewrote the question around it: a dense, regular dotted texture inside rectangular blocks. On a 48-chip test set with that prompt, Perceptron reached 100% precision (16 of 16 "yes" answers correct, zero false alarms) at 67% recall. For a tool that a government acts on, zero false accusations matters more than catching everything, and the loss-map cross-check plus the "inconclusive" state catch the rest.
Challenges we ran into
- Clouds and smoke. Several years over Borneo are mostly cloud, and 2026 has haze. Scene selection by season and cloud cover mattered more than any model.
- Not overclaiming. The Hansen loss map ends in 2024, so we can't say anything was "detected in 2026". The newest images show only what the land is now. Writing honest copy was as much work as the code.
- Models hallucinate rows. A vision model alone will call a mature forest a plantation. Gating it behind the loss map and keeping an "inconclusive" state fixed that.
- Drawing any shape. Supporting freehand polygons and three upload formats, and still running on a clean bounding box.
Accomplishments that we're proud of
- An end-to-end check on real open data, from a drawn box to a printable case file.
- An inconclusive region is shown front and center, not hidden.
- A design that a non-expert can follow: one plot, one story, and one allowed sentence.
What we learned
- Open satellite data is good enough to answer the EUDR question for one plot. The hard part is lining it up and explaining it.
- Restraint is a feature. Every word we banned ("illegal", "score", "fail") made the tool more trustworthy.
- How the EUDR actually works: the cutoff is not the start date, and the authority, not the software, decides.
What's next for OpenCanopy
- Attach the case file to the due diligence statement, so the next reviewer and the public can rerun the same check.
- Plain-language and local-language packs for communities and forest monitors.
- Batch checks for every plot in a supply chain, with the same per-plot evidence.
- Radar (Sentinel-1) to see through cloud in the wettest years.
Why it should exist
- Economic: €126 billion of trade a year depends on these checks. Every day a check takes, a shipment waits, and every unverifiable plot is a risk for importers and their suppliers.
- Supply chain: honest smallholders get evidence on their side. One public satellite record per plot replaces stacks of self-declared paperwork that nobody can verify.
- Environment: if checks stay slow, the cutoff means nothing and 2020's forest keeps turning into plantations. Tropical forest loss is already at a record. A fast, public check is what makes the law real.
- Trust: every number comes from open data with scene IDs, so anyone (a regulator, a buyer, a journalist, or the village itself) can rerun it and get the same answer.
Sources
WRI / Global Forest Watch, 2024 forest loss data (May 2025) · FAO Global Forest Resources Assessment 2020 · European Parliament EUDR briefing · S&P Global, deforestation rules' impact on supply chains (2023) · European Commission EUDR simplification review (2026) · Regulation (EU) 2023/1115 and its 2024 and 2025 amendments.
Built With
- css3
- cursor
- grok-bot
- hansen-global-forest-change
- html5
- javascript
- maplibre
- microsoft-planetary-computer
- numpy
- perceptron
- python
- rasterio
- sentinel-2
- shapely
- slurm


Log in or sign up for Devpost to join the conversation.