-
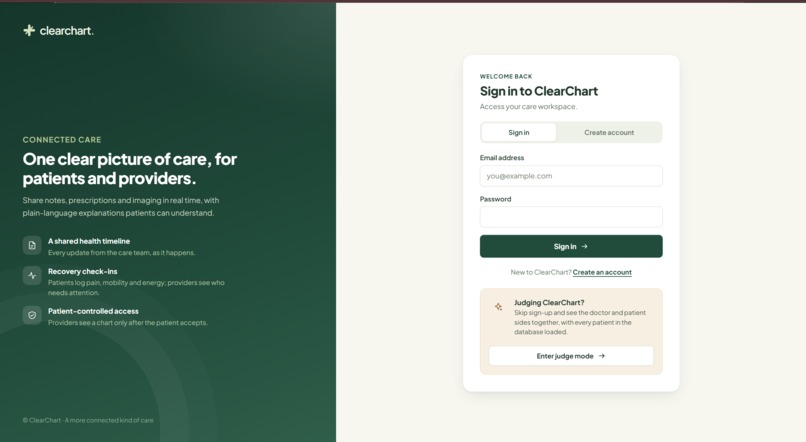
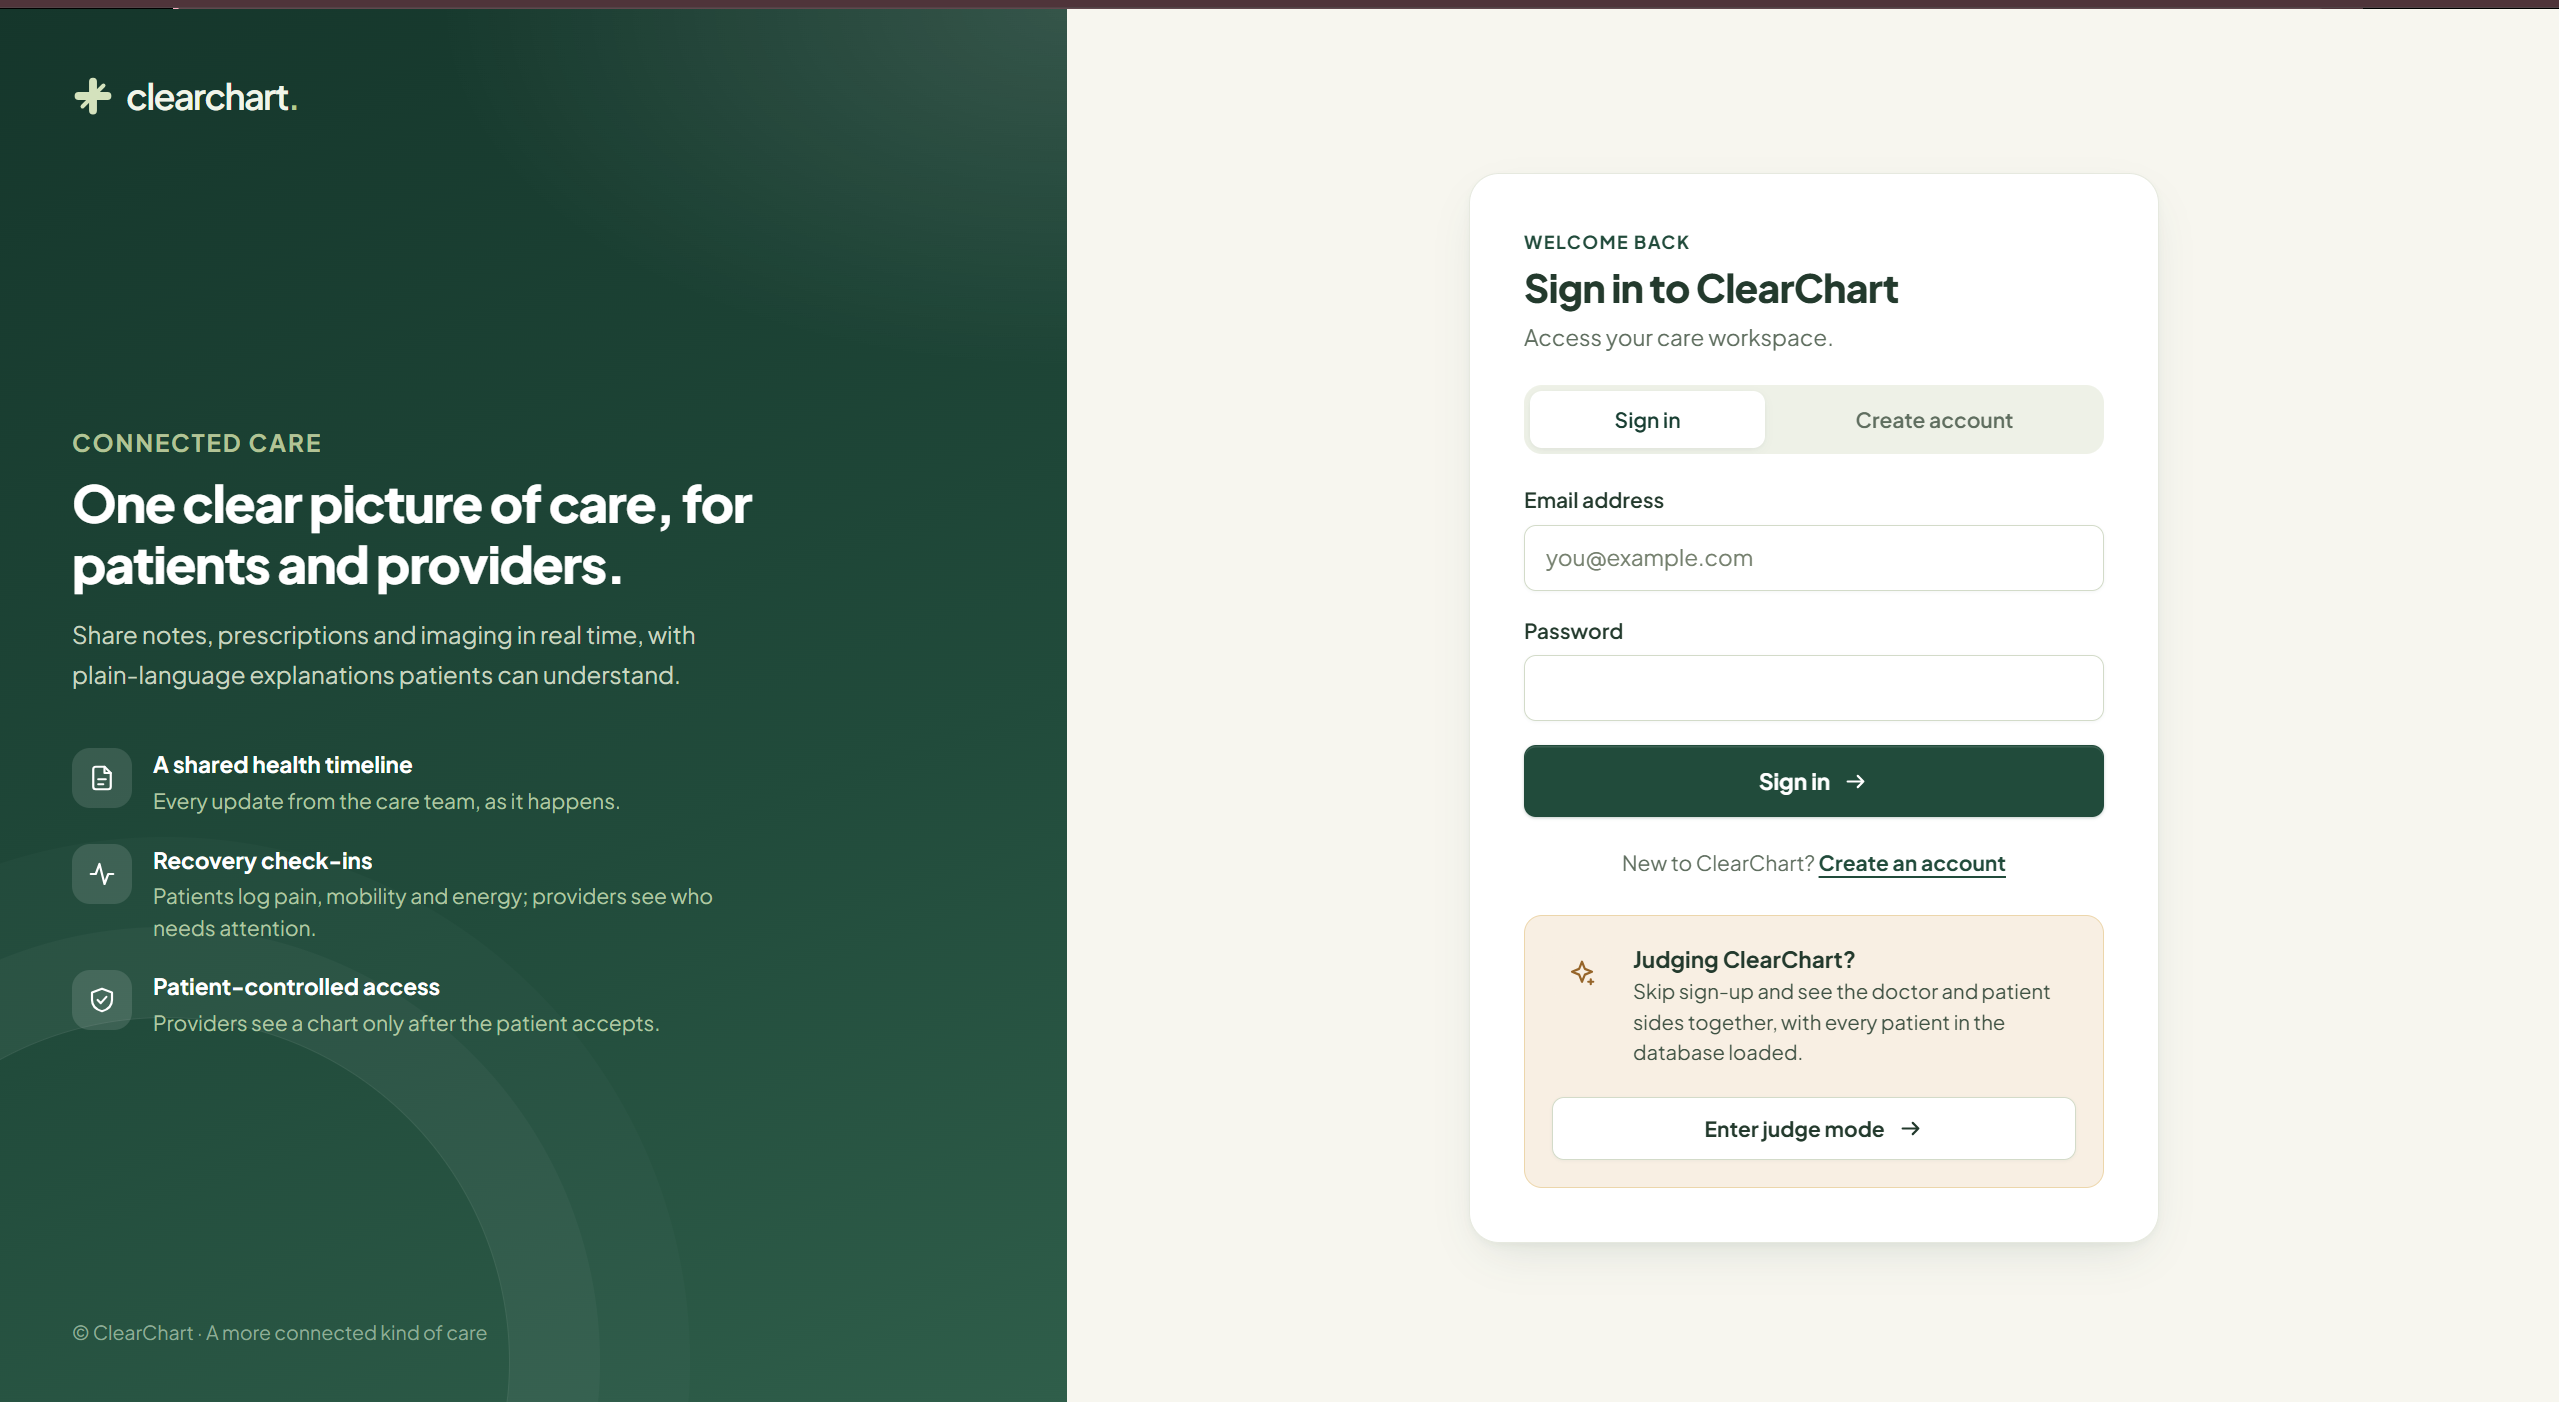
Login page
-
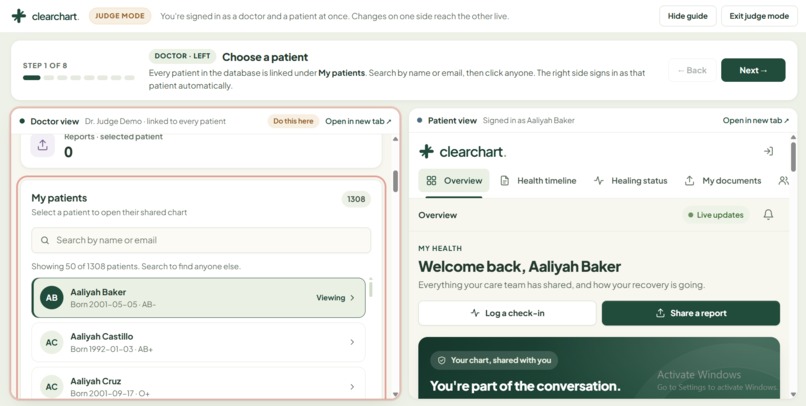
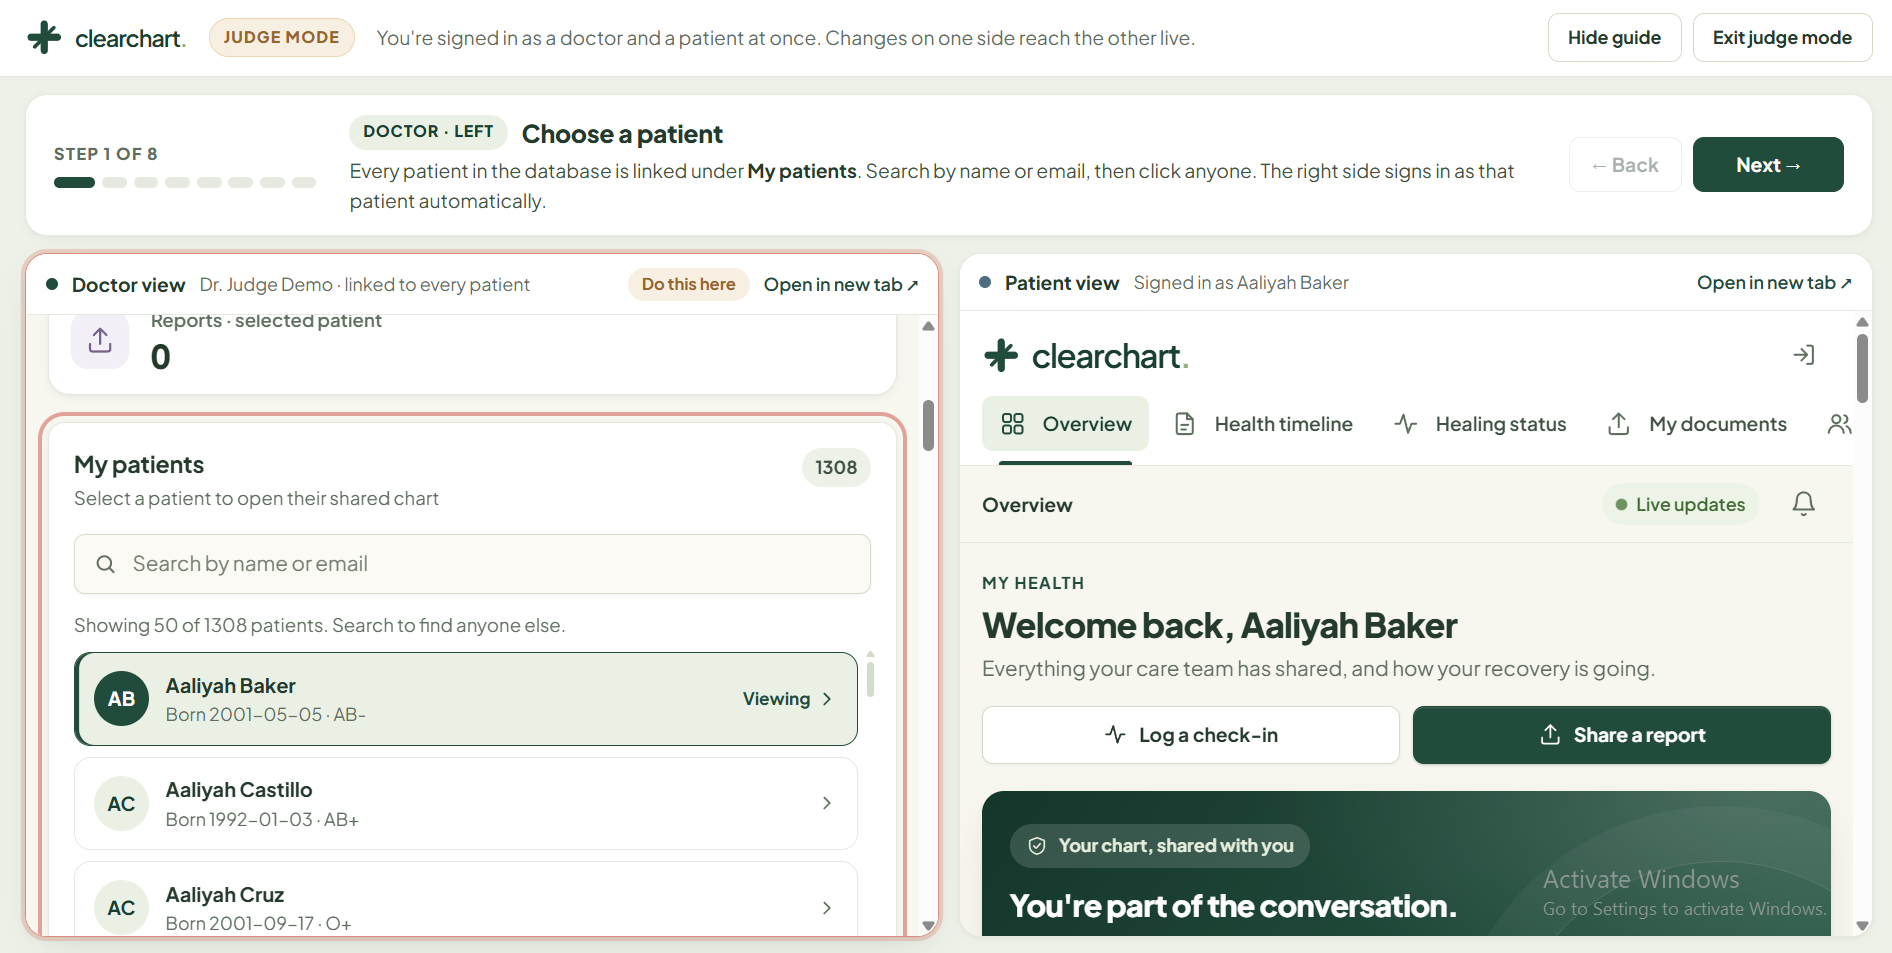
Patient mode and Doctor mode side-by-side (Judge View)
-
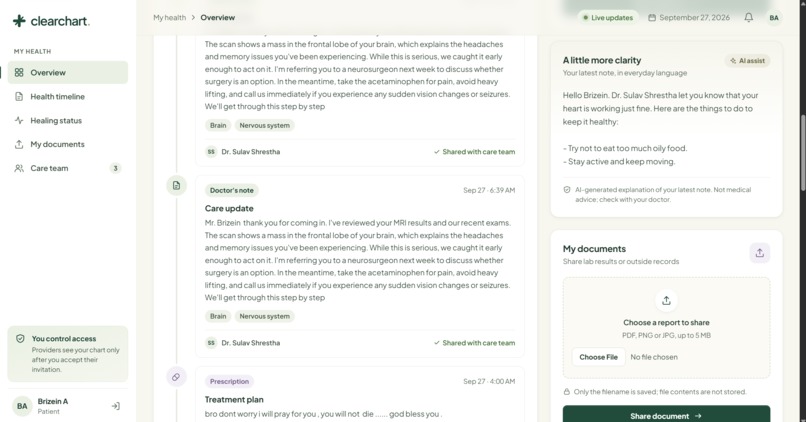
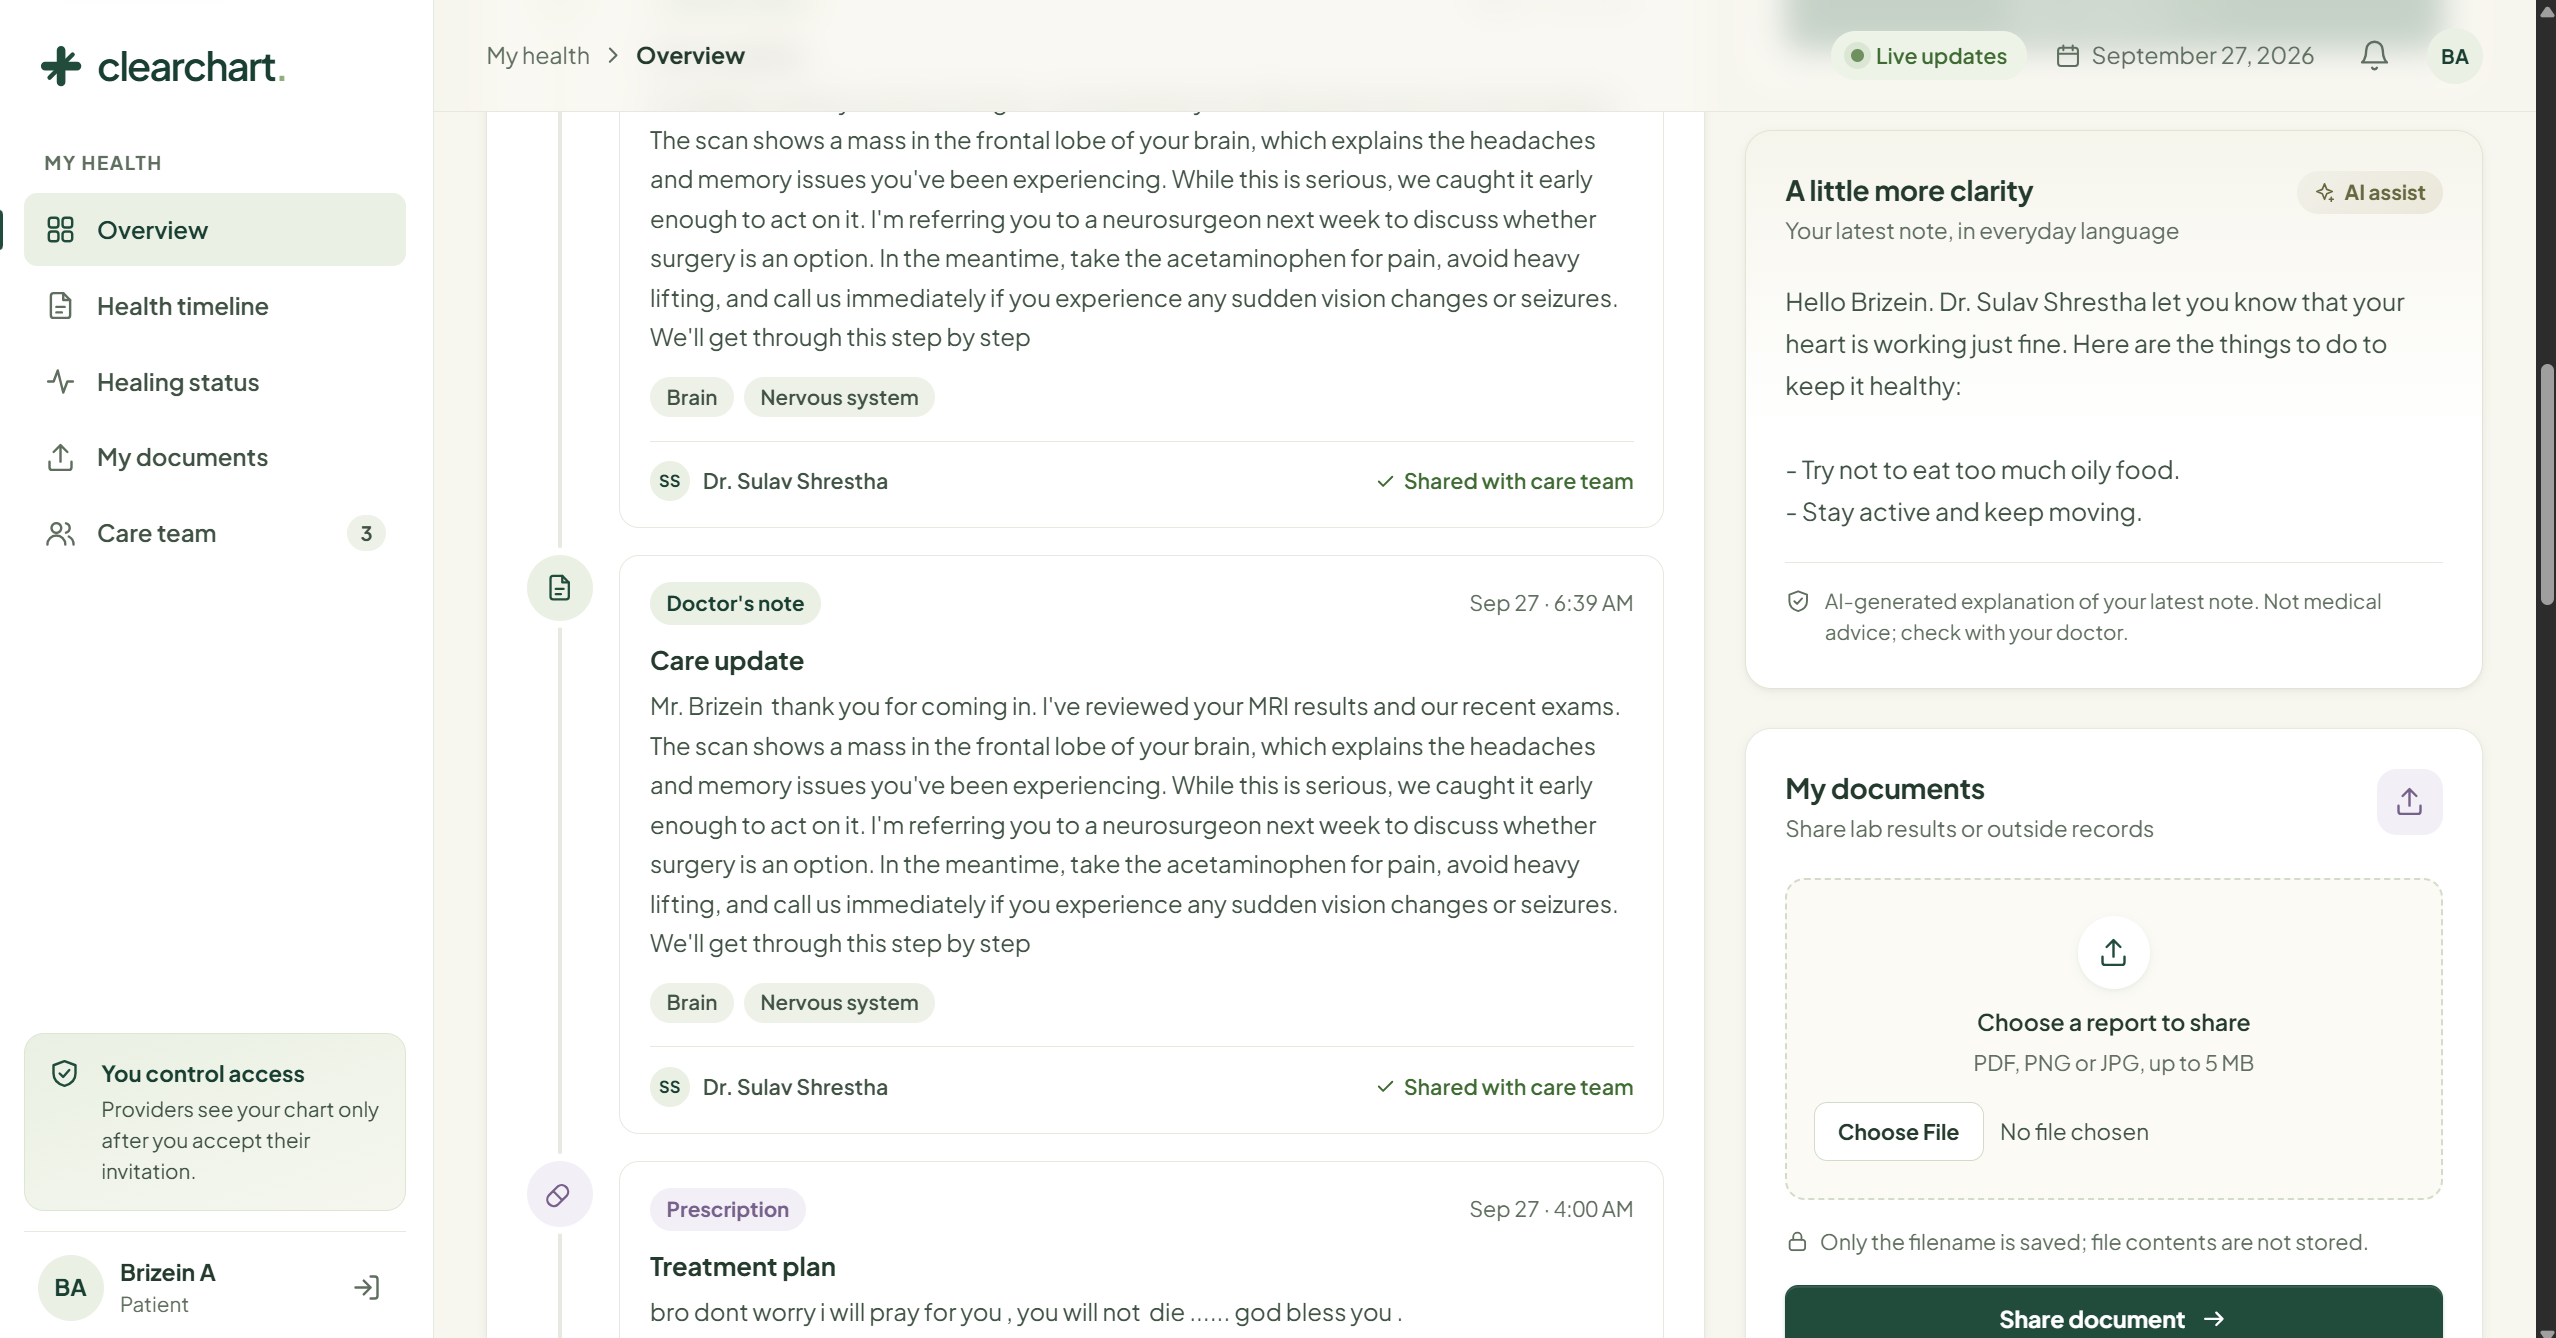
Dashboard of a Patient
-
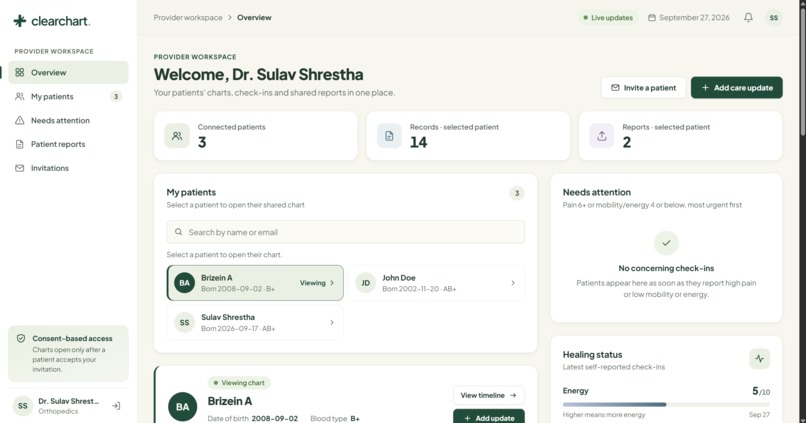
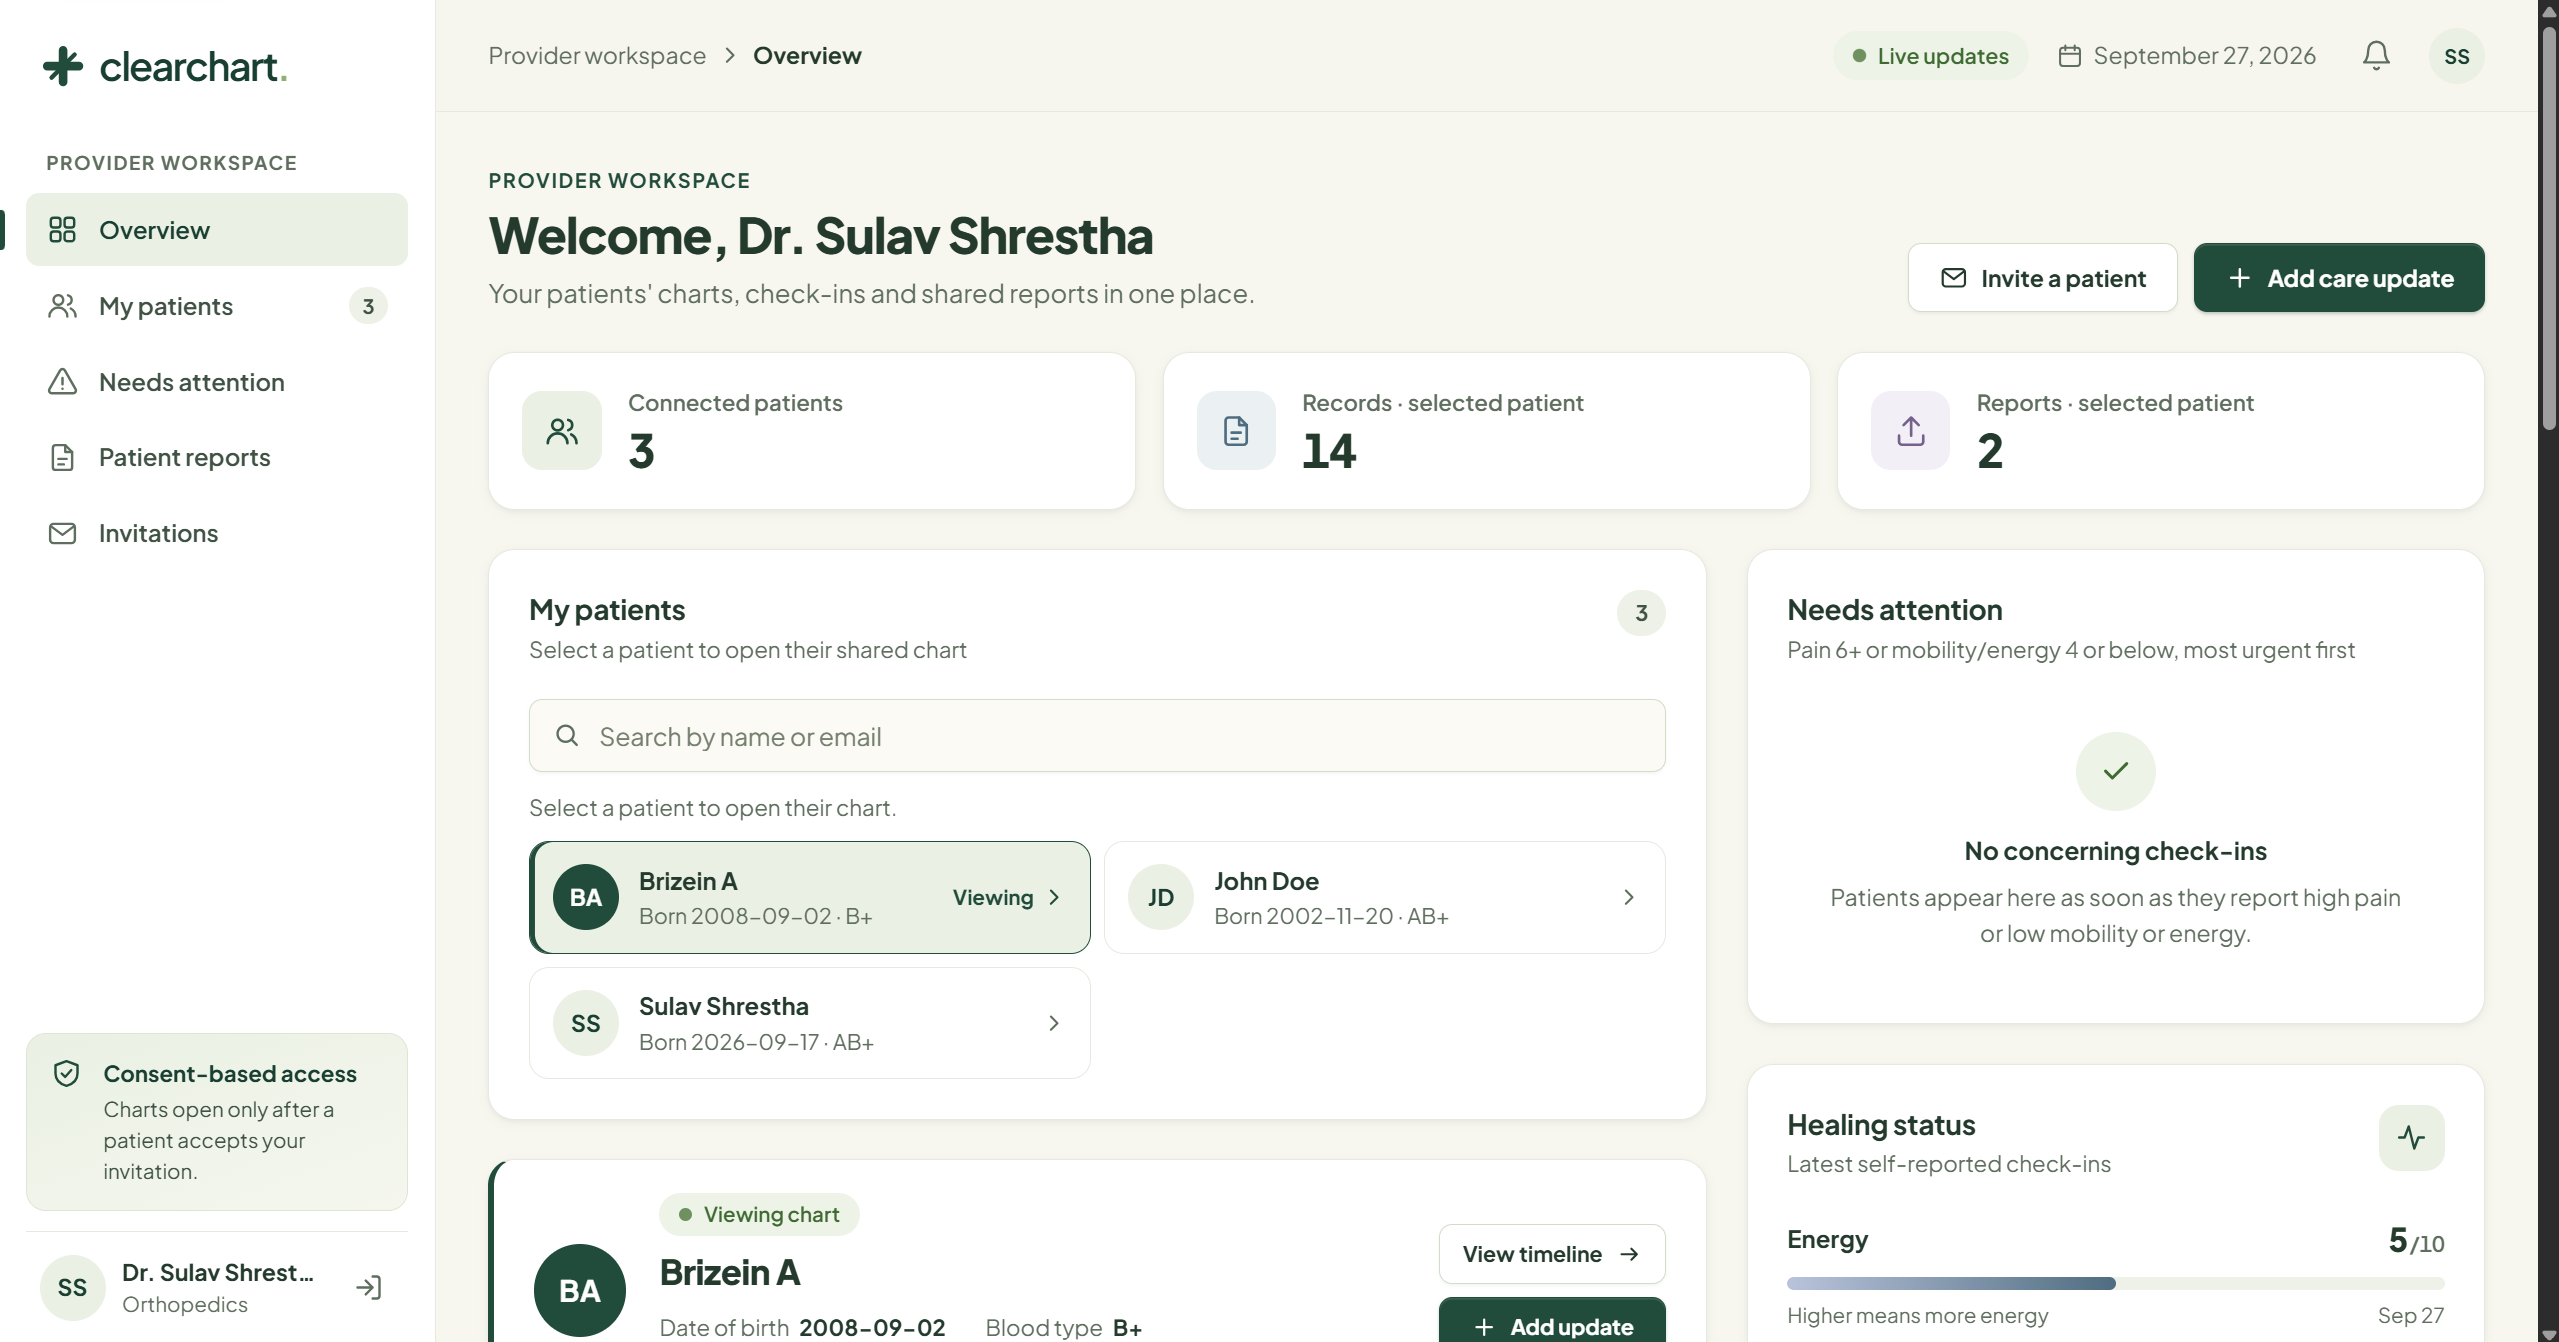
Dashboard of Doctor
-
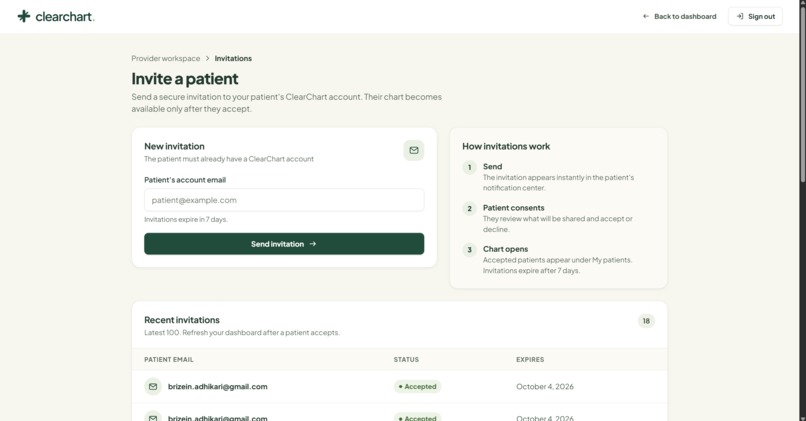
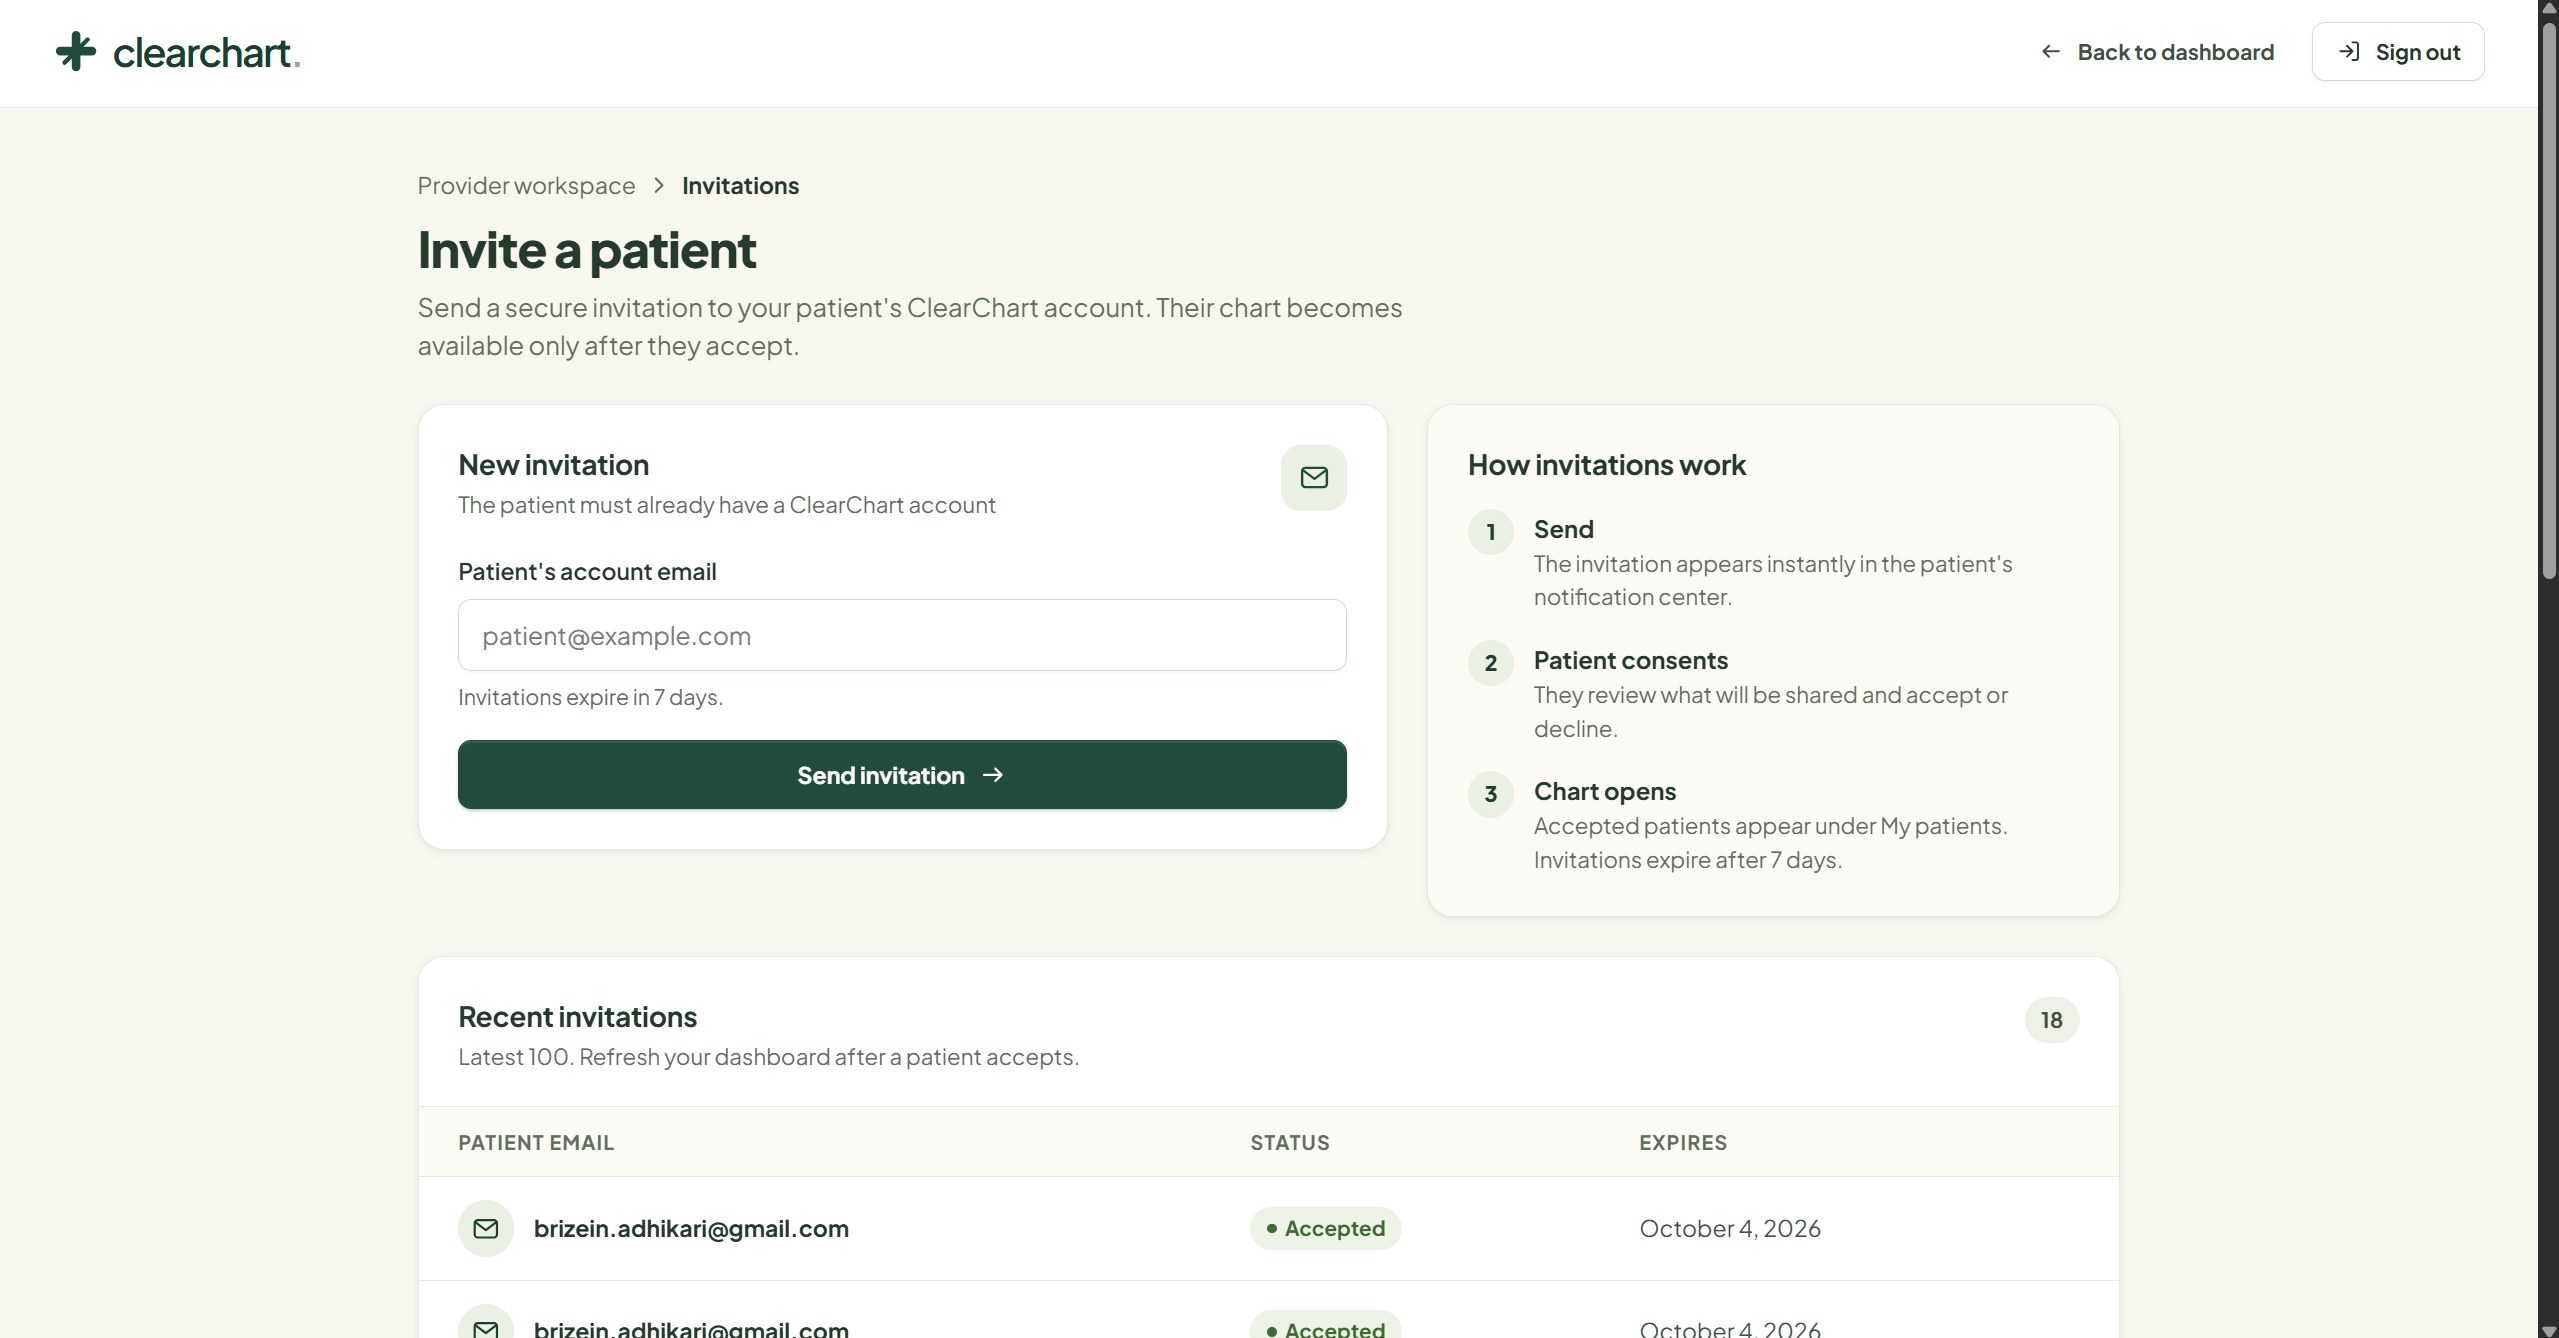
Invitation Page
Inspiration
For most people, a medical recovery happens in pieces. Lab results are in one place, a doctor's notes in another, and the prescriptions and scans are wherever the patient left them. Each time a patient sees a new doctor, they have to gather everything again, bring folders, chase test results, and explain what the last doctor said.
Doctors have the opposite problem. Once a patient goes home, they know very little until the next appointment, which is often weeks away. They don't know how the patient is recovering, and they don't know whether new reports have come in. When a patient is referred to them, they often start with only part of the history.
Everyone involved is working on the same recovery, but no one has the full picture. We wanted a single workspace that both the doctor and the patient can see, that follows the patient from doctor to doctor, and that stays up to date.
What it does
ClearChart is a live, shared workspace for doctors and patients. Each patient has one chart holding their whole medical story. They control who can see it, and every doctor they let in reads the same chart.
For patients
- Everything in one place. Doctor notes, prescriptions, imaging and reports sit on one timeline, which can be filtered by type and by body area.
- Nothing to carry. Patients add their own documents once, and every doctor on their care team can see them.
- Health status updates. Patients log their pain, mobility and energy on a 1–10 scale, and their doctor sees it right away.
- Clarity. An AI card explains the latest doctor note in everyday language, so patients understand what was written about them.
- Control. No doctor can see a chart until the patient accepts that doctor's invitation.
For doctors
- A dashboard of all their patients, with search, and each patient's full chart one click away.
- Needs attention. Patients whose latest check-in shows high pain or low mobility or energy are flagged automatically, with the most serious cases at the top.
- Care updates that arrive live. When a doctor sends a note, prescription or imaging record (tagged by body area), it shows up on the patient's screen straight away, with no refresh and no waiting for the next visit.
- Review before the visit. Doctors can read a patient's reports and recent check-ins before the appointment starts.
Continuity between doctors. When a patient is referred to a new doctor, the new doctor sends an invitation. Once the patient accepts, that doctor can see the full history, including everything the previous doctors wrote. Nothing is lost in the handoff, and nothing is shared without the patient's consent.
Transparency. Patients see everything their care team writes about them. Only doctors the patient has approved can read the chart or add to it.
How we built it
- Backend: Go (
net/http,html/template). The server renders all the HTML. - Live updates: Datastar and server-sent events. When data changes, the server sends new sections of the page to every open screen that shows it. We wrote no custom frontend JavaScript for the app itself.
- Database and sign-in: Supabase PostgreSQL and Supabase Auth. Row-level security blocks direct browser access to the tables, and database triggers check that every profile has the correct role (doctor or patient).
- AI: Google Gemini writes the plain-language explanations. If Gemini is slow or unavailable, a rule-based summary is shown instead.
- Deployment: Fly.io, with a one-click Judge mode that shows the doctor's and the patient's screens side by side, so you can watch updates move between them live.
Challenges we ran into
- Speed. Each dashboard originally needed 8–10 separate database queries. We merged them into a single SQL query, which also checks that the doctor is allowed to see that patient. On our test setup, the doctor dashboard went from about 1 second to under 100 ms.
- Waiting on the AI. A Gemini call can take several seconds. We moved it to the background, so the page loads immediately with a loading state and the explanation appears once it's ready. Our first version cancelled the AI request every time the page reloaded, and we had to fix that.
- Consent and access. Every change to the data has to check the user's role, whether they are on that patient's care team, and protection against forged requests (CSRF). An invitation only works if the patient accepts it from an account with the matching email address.
- Realistic demo data. We generated 1,000 fictional patients and 40 doctors, each patient with a coherent recovery story, so the dashboards look like real use.
Accomplishments that we're proud of
- Doctors and patients really do work from one chart, and changes appear on both sides in real time.
- A patient's history follows them to a new doctor, and the patient decides who gets access.
- Doctors can see who needs help without waiting for the next appointment.
- Judges can try the doctor side and the patient side together in one click.
What we learned
- One well-structured SQL query can be much faster than several simple ones.
- For AI features, keeping the page fast and having a fallback matter as much as the model itself.
- In healthcare, consent and access control have to be designed in from the start. They are hard to add afterwards.
What's next for ClearChart
- Direct lab uploads, so results reach the chart without the patient having to handle them.
- Full file storage for uploaded documents. For now, uploads record the file name.
- Recovery trend charts, and alerts that notify doctors as soon as a patient is flagged.
- Standard health-data formats (FHIR), so ClearChart can connect to hospital record systems.
Built With
- datastar
- docker
- fly.io
- go
- google-gemini
- html
- http
- postgresql
- server-sentevents
- supabase


Log in or sign up for Devpost to join the conversation.