Inspiration
We started looking into environmental justice data for NJ and the numbers were pretty striking. Cities like Newark and Camden have asthma rates that are way higher than the state average, and they're also the same communities sitting next to highways and industrial sites. But when we actually tried to find the air quality data for those areas, it was scattered across government portals that nobody's realistically going to dig through. We figured if the data is already public, the least we could do is make it actually usable.
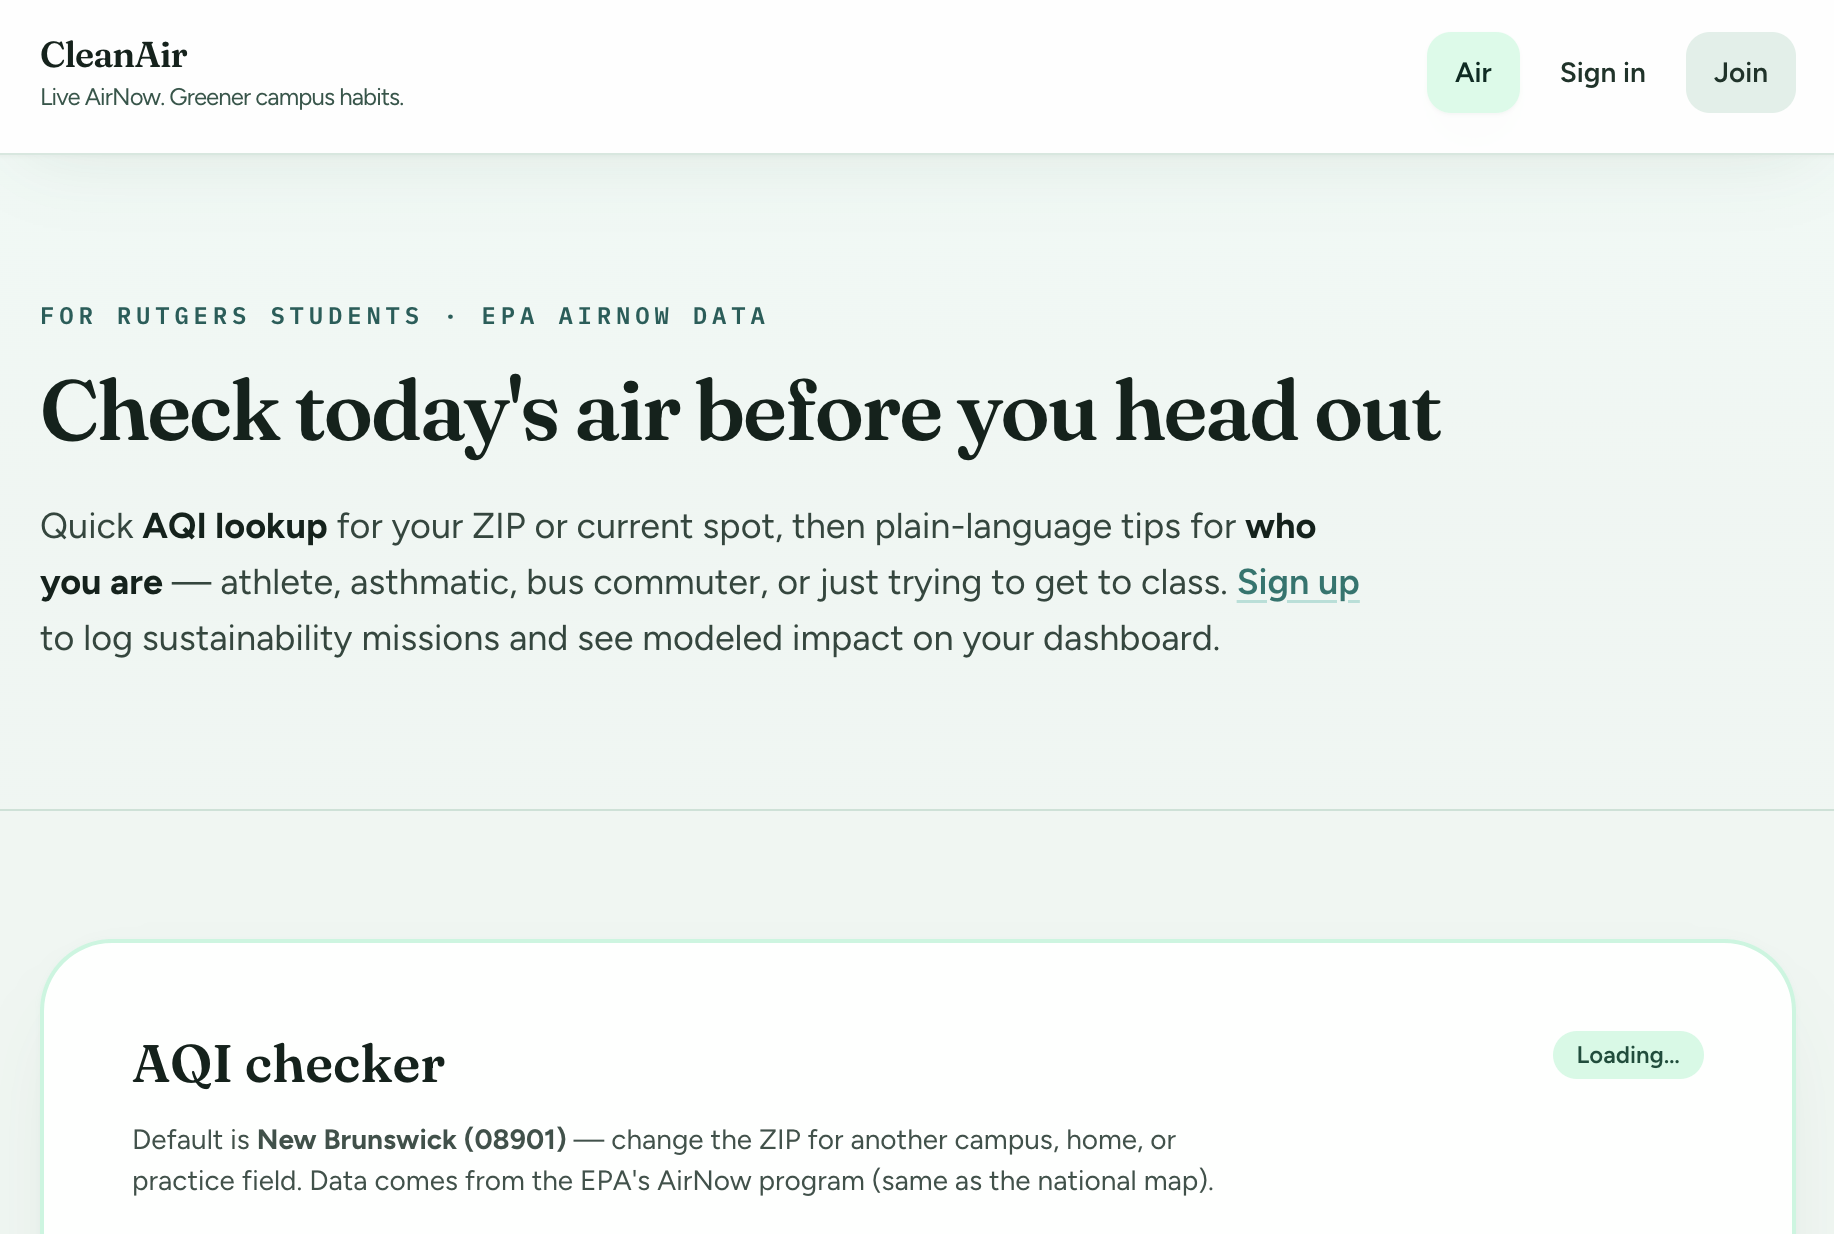
What it does
You type in your ZIP code (or let it use your location), and ClearAir Check pulls live AQI readings from the nearest EPA monitor, broken down by pollutant, mapped, and translated into guidance based on who you are. The advice for someone with asthma is different from what a college athlete or daily commuter should know. If you make an account, you get a personal dashboard where you can log clean-air challenges, build streaks, and see a rough estimate of your impact over time.
How we built it
React, Vite, Tailwind, and shadcn/ui on the frontend. Air quality data comes from EPA AirNow, the same public API anyone can access, with Zippopotam handling ZIP-to-coordinates lookup. We used Recharts for the trend graphs and had to set up proxy configs for Vite in dev and separate rewrite rules for Netlify and Vercel, since browsers block direct calls to AirNow's servers.
Challenges we ran into
The biggest honest challenge was figuring out what we could actually say with the data we had. EPA AirNow is public and free, but monitor coverage is sparse in a lot of places. If there's no station near you, the reading you get is interpolated, not measured. We tried to be upfront about that in the UI rather than pretend every number is gospel. Same with the impact stats on the personal dashboard, which are illustrative estimates based on rough factors, not anything measured. The CORS situation with AirNow was a technical headache too. Browsers refuse direct calls to airnowapi.org, so we had to wire up environment-aware proxy routing across three different contexts without breaking anything.
Accomplishments that we're proud of
Being honest about the data's limits and shipping anyway. It would've been easy to just show numbers and not explain where they come from or how reliable they are, and a lot of apps do exactly that. We tried to label what's real, what's modeled, and what's just a rough estimate, and let users decide what to do with that.
What we learned
Public data is more complicated than it looks. The EPA data is accessible to everyone, which is great, but sparse monitor coverage means a lot of what gets shown is an approximation of reality rather than a direct reading. We also learned that being transparent about uncertainty is actually a feature, not a weakness.
What's next for ClearAir
Better data, honestly. The public AirNow API only gets you so far. Longer term we'd want to pull in more granular sources, partner with local environmental justice orgs who do their own monitoring, and give users a clearer sense of how confident we actually are in any given reading. We'd also swap the demo localStorage accounts for real auth and build out the cohort comparison with actual anonymous data. Additionally also add incentives.

Log in or sign up for Devpost to join the conversation.